Significance
Transferrin receptor 1 (Tfr1) facilitates cellular iron acquisition by binding to and internalizing iron-loaded transferrin. Although this function is essential for red blood cell precursors, the role of Tfr1 in nonhematopoietic tissues has not been thoroughly studied. In this study, we investigated the role of Tfr1 in the intestine by developing mutant mice in which Tfr1 is inactivated specifically in the intestinal epithelium. We discovered that inactivation of Tfr1 has pleiotropic consequences leading to the loss of intestinal epithelial proliferation and homeostasis and induction of genes involved in epithelial–mesenchymal transition. These effects are not related to the iron uptake, revealing a surprising role for this ubiquitous membrane protein.
Keywords: transferrin receptor, intestinal epithelium, epithelial–mesenchymal transition, homeostasis, stem cell
Abstract
Transferrin receptor 1 (Tfr1) facilitates cellular iron uptake through receptor-mediated endocytosis of iron-loaded transferrin. It is expressed in the intestinal epithelium but not involved in dietary iron absorption. To investigate its role, we inactivated the Tfr1 gene selectively in murine intestinal epithelial cells. The mutant mice had severe disruption of the epithelial barrier and early death. There was impaired proliferation of intestinal epithelial cell progenitors, aberrant lipid handling, increased mRNA expression of stem cell markers, and striking induction of many genes associated with epithelial-to-mesenchymal transition. Administration of parenteral iron did not improve the phenotype. Surprisingly, however, enforced expression of a mutant allele of Tfr1 that is unable to serve as a receptor for iron-loaded transferrin appeared to fully rescue most animals. Our results implicate Tfr1 in homeostatic maintenance of the intestinal epithelium, acting through a role that is independent of its iron-uptake function.
Transferrin receptor 1 (Tfr1) resides on the cell surface and internalizes iron-loaded serum transferrin (Fe-Tf) through receptor-mediated endocytosis (1). It is critical for iron acquisition by erythroid precursors (2) but its role in most other tissues has not been determined experimentally. Tfr1−/− embryos develop anemia, attributable to impaired proliferation of erythroid precursors, and die by embryonic day 12.5 (E12.5). Hematopoietic cells require Tfr1 to develop but most other tissues appear not to require it (3). Mice with profound deficiency of its ligand, Tf, accumulate iron in nonhematopoietic tissues (4). These observations, and others, demonstrate that Tfr1 is not universally required for iron uptake.
Diverse, noncanonical functions of Tfr1 have been elucidated. In the liver, TFR1 interacts with HFE, a protein mutated in patients with genetic iron overload, to sequester HFE and thus modulate expression of hepcidin, an iron-regulatory hormone (5). In celiac disease, Tfr1 is improperly localized on the apical surface of mature enterocytes, where it can bind and transport IgA (6). Tfr1 endocytosis is not ligand-dependent (7). It requires an internalization motif, 20YTRF23, found in its 67-amino acid N-terminal cytoplasmic domain (8). Src can phosphorylate 20Y of the internalization sequence (9).
The proliferative compartment of the intestinal epithelium is composed of stem cells and transit amplifying cells, which differentiate into several types of mature intestinal epithelial cells (IECs) (10). In newborn mice, proliferative cells reside in intervillous regions, which invaginate to form crypts before weaning. Tfr1 is enriched on the basolateral surface of IECs in the intervillous spaces and crypts (11); consistent with this localization, it does not play a role in dietary iron absorption (12). To understand the function of Tfr1, we developed conditional knockout mice using Cre recombinase expressed throughout the intestinal epithelium to inactivate a floxed Tfr1 allele. These mutant mice had a severe, early lethal phenotype that appears to result from loss of a novel function of Tfr1, not involving iron assimilation. Surprisingly, the mice showed marked induction of genes associated with epithelial–mesenchymal transition in IECs, suggesting that Tfr1 normally acts to suppress this cell fate change. There was also abnormal accumulation of lipids, similar to mice lacking transcription factor Plagl2, and increased expression of stem cell markers.
Results
Conditional Deletion of Tfr1 in IECs.
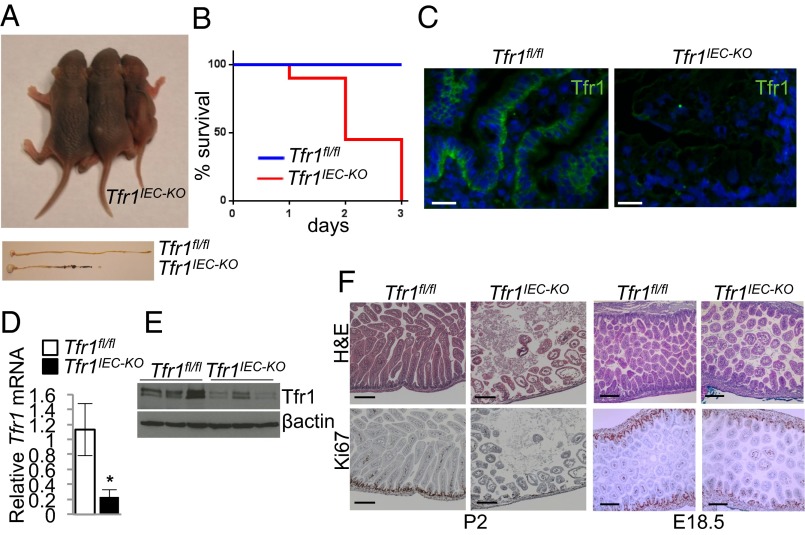
We developed Tfr1fl/fl mice carrying loxP sites flanking Tfr1 exons 3–6 (Fig. S1). These mice were indistinguishable from wild-type mice in these and other experiments. We crossed Tfr1fl/fl mice with villin-Cre transgenic mice (13) to produce IEC-specific conditional knockout (Tfr1IEC-KO) mice. The villin-Cre transgene is expressed by E12.5 and is active in all IECs, including stem cells. Tfr1IEC-KO pups were born in Mendelian ratios and similar to control (Tfr1fl/fl) littermates at birth. However, they failed to thrive and were runted by postnatal day 1 (P1) (Fig. 1A). All Tfr1IEC-KO pups died before P3 but there was variability in the time of death (Fig. 1B); their stomachs were distended with milk and there was milk in the intestinal lumen. Although similar at birth, both the intestine and colon were shorter in Tfr1IEC-KO pups by P1, with apparent melena (Fig. 1A). We do not know whether the mice died from nutritional failure or from disruption of the epithelial barrier.
Fig. S1.
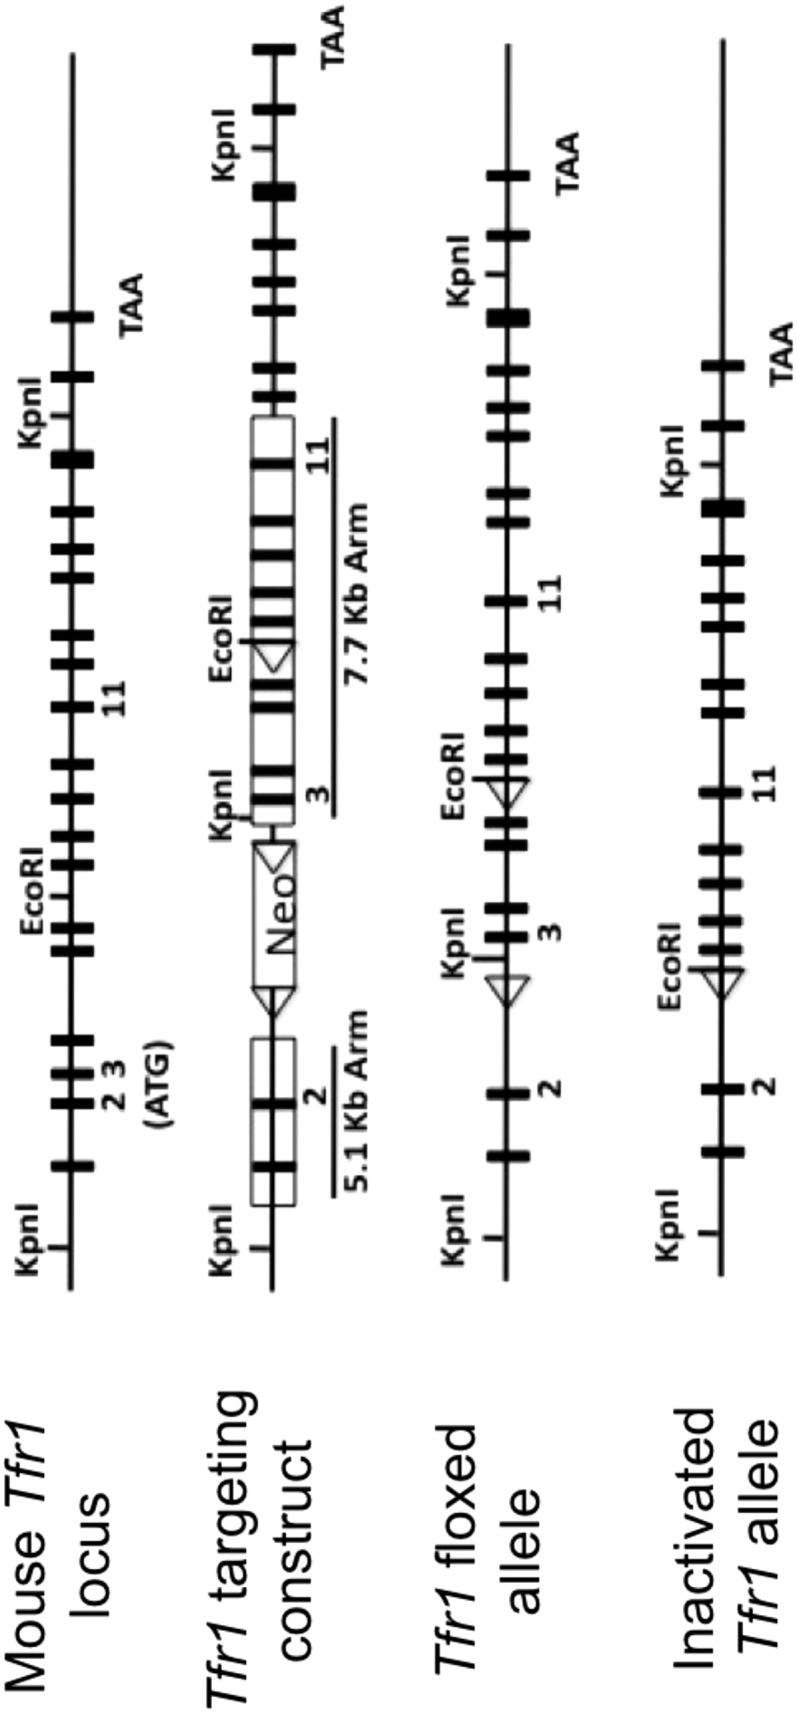
Strategy used to develop floxed Tfr1 allele. The mouse Tfr1 locus is shown at top. A targeting construct was introduced into ES cells to insert three loxP sites (triangles) including two flanking a neomycin-resistance cassett (Neo) in intron 2. As described in Materials and Methods, Cre recombinase was used to recombine the allele in vivo to produce the Tfr1 floxed allele with 2 remaining loxP sites flanking exons 3–6. In the presence of Cre recombinase there is further recombination resulting in the inactivated Tfr1 allele lacking exons 3–6.
Fig. 1.
Neonatal lethality. (A) P1 neonates. Two Tfr1fl/fl control mice on left; Tfr1IEC-KO mouse on right. (Lower) P1 stomach (Left), small intestine and colon; genotypes indicated. (B) Survival of neonates (Tfr1fl/fl n = 12; Tfr1IEC-KO n = 12). (C) Immunofluorescence localization of Tfr1 (green) and DAPI (blue) in P0 duodenum showed Tfr1 on the basolateral surface of Tfr1fl/fl intervillous IECs and absent from Tfr1IEC-KO IECs. (Scale bars, 20 μM.) See also Fig. S2. (D) Tfr1 mRNA expression, relative to Rpl19, determined by qRT-PCR (*P < 0.05, n = 3 each). (E) Tfr1 protein; β-actin control. (F, Upper) H&E staining of P2 (Left) and E18.5 (Right) duodenal sections showed blunted villi, smaller intervillous regions, and edema in Tfr1IEC-KO mice. (Lower) reduced Ki67 staining in Tfr1IEC-KO mice relative to Tfr1fl/fl controls at both ages. (Scale bars, 200 μM.) See Fig. S3A for quantitation of Ki67 staining.
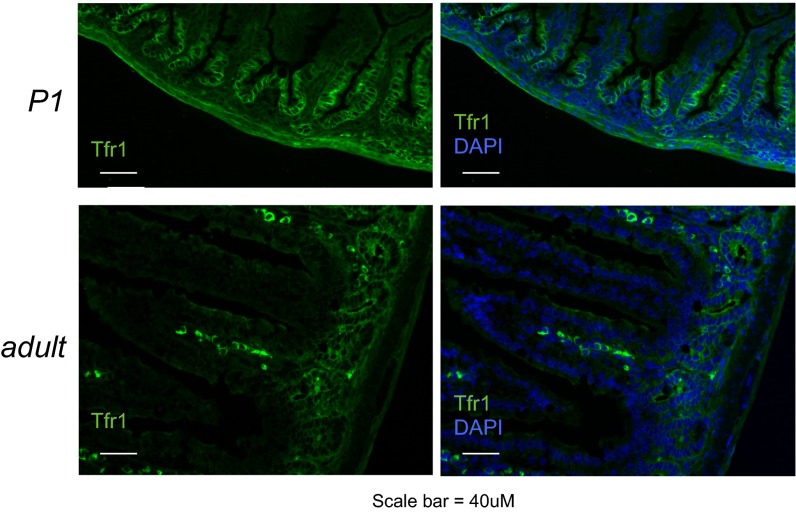
We confirmed Tfr1 localization in control mice and loss of Tfr1 in Tfr1IEC-KO mice (Fig. 1C and Fig. S2). As expected, Tfr1 was enriched on the basolateral surface of P0 IECs in controls, with highest expression in intervillous regions, but it was absent in Tfr1IEC-KO IECs. Tfr1 mRNA expression was markedly decreased in Tfr1IEC-KO IECs (Fig. 1D) and less Tfr1 protein was present (Fig. 1E). Residual Tfr1 may be from non-IEC contamination.
Fig. S2.
Localization of Tfr1 in control mice (supplemental to Fig. 1C). Immunofluorescence localization of Tfr1 in P0 and adult mice. In newborn mice, Tfr1 localizes primarily to the basolateral surface of intervillous IECs. In adult mice, Tfr1 is confined to the basolateral surface of crypt cells.
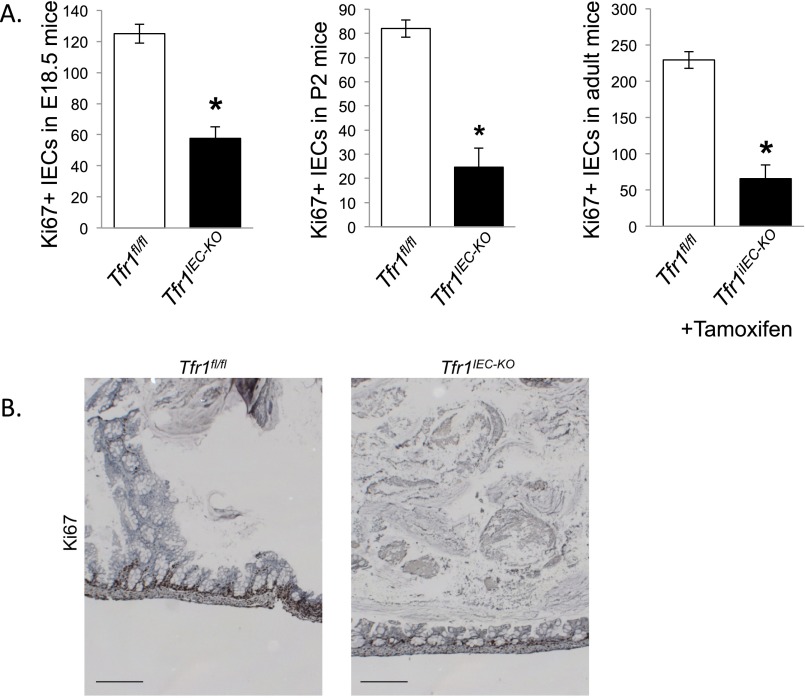
Duodenal sections revealed severe disruption of epithelial integrity in Tfr1IEC-KO mice on P2 (Fig. 1F), explaining why the animals died soon after birth. We observed blunted villi, smaller intervillous regions, edema in the lamina propria, and enlarged vacuole-like structures in the IECs. Ki67 staining showed a marked reduction in proliferating IECs in intervillous regions of Tfr1IEC-KO animals (Fig. 1F; quantified in Fig. S3A). Similar changes were observed in Tfr1IEC-KO colon at P2 (Fig. S3B) and small intestine at E18.5 (Fig. 1F).
Fig. S3.
Ki67 staining (supplemental to Figs. 1F and 2B). (A) Ki67+ IECs were counted in five fields from 3 Tfr1fl/fl and Tfr1IEC-KO mice at E18.5 and P2 and from three Tfr1fl/fl and Tfr1iIEC-KO tamoxifen treated 2-mo-old mice. Ages are shown on the y axis. *P < 0.005 by Student’s t test. Values represent mean ± SEM. (B) The figure shows general morphological changes and decreased Ki67 staining in colonic crypts in Tfr1IEC-KO mice. (Scale bars, 200 μM.)
Tfr1 Is Required for Adult Intestinal Epithelial Homeostasis.
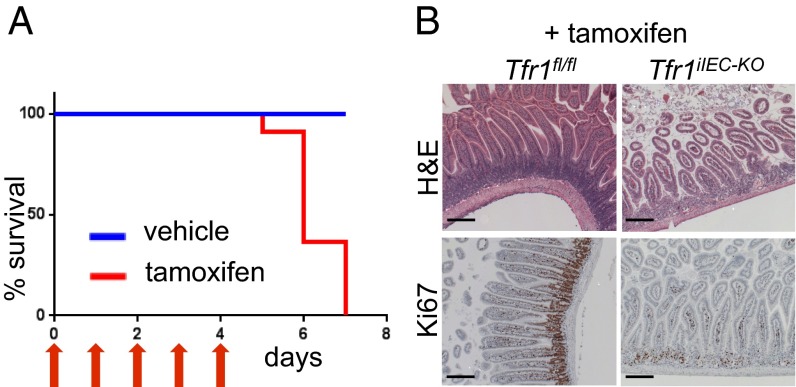
To determine whether Tfr1 was important for early intestinal development but dispensable later, we crossed Tfr1fl/fl animals with transgenic mice carrying a tamoxifen-inducible villin-CreERT2 allele (13). Adult mice were given tamoxifen daily for 5 d to induce deletion of Tfr1 in IECs. Resulting Tfr1iIEC-KO mice had diarrhea and weight loss as early as the fourth day of tamoxifen administration, whereas control animals treated with tamoxifen had no apparent abnormalities. Because of poor health, all Tfr1iIEC-KO mice were killed 1–3 d after the last tamoxifen dose (Fig. 2A). Similar to Tfr1IEC-KO mice, Tfr1iIEC-KO mice had distended stomachs. Tfr1iIEC-KO duodenal sections showed blunted villi and reduction in proliferating crypt IECs compared with tamoxifen- and vehicle control-treated Tfr1fl/fl intestines (Fig. 2B and Fig. S3A). We conclude that Tfr1 is required by IECs throughout life.
Fig. 2.
Tfr1 is required for adult intestinal epithelial homeostasis. (A) Survival of 2-mo-old control (n = 10) and tamoxifen-treated Tfr1iIEC-KO mice (n = 10). Daily tamoxifen injections shown with red arrows. (B) H&E staining showed disruption of the duodenal epithelium in adult Tfr1iIEC-KO mice (Upper). Ki67 staining showed reduction of proliferating IECs in Tfr1iIEC-KO mice (Lower). (Scale bars, 200 μM.) See Fig. S3A for quantitation of Ki67 staining.
Attempts to Rescue the Phenotype.
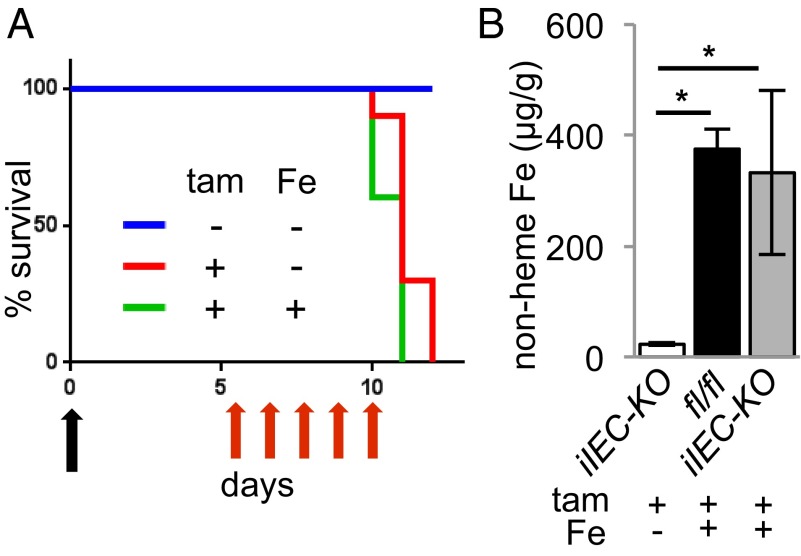
Administration of a large dose of iron dextran—to supersaturate circulating Tf—results in iron loading of most tissues. We have used this approach to rescue muscle-specific Tfr1 conditional knockout mice. We gave iron dextran to P0 Tfr1IEC-KO pups and observed no extension of lifespan. We treated Tfr1iIEC-KO adult mice with iron dextran before deletion of Tfr1 with tamoxifen. The lifespan of iron-loaded Tfr1iIEC-KO mice was not extended (Fig. 3A) and the animals developed gastric distension, diarrhea, and weight loss similar to Tfr1iIEC-KO mice not treated with iron. We confirmed iron loading of IECs by measuring nonheme iron in intestinal scrapings (Fig. 3B).
Fig. 3.
Iron-loading does not rescue viability. (A) Survival of iron-preloaded mice treated with tamoxifen. A single dose of iron-dextran was given (black arrow). Daily injections of tamoxifen (tam) were given as indicated (red arrows). All animals in this experiment carried the floxed Tfr1 allele and inducible Cre recombinase; treatments as shown in the legend; blue n = 10, red n = 10, green n = 8. (B) Nonheme iron content of IECs, normalized by tissue wet weight; genotypes and treatments indicated (*P < 0.001, n = 3 each).
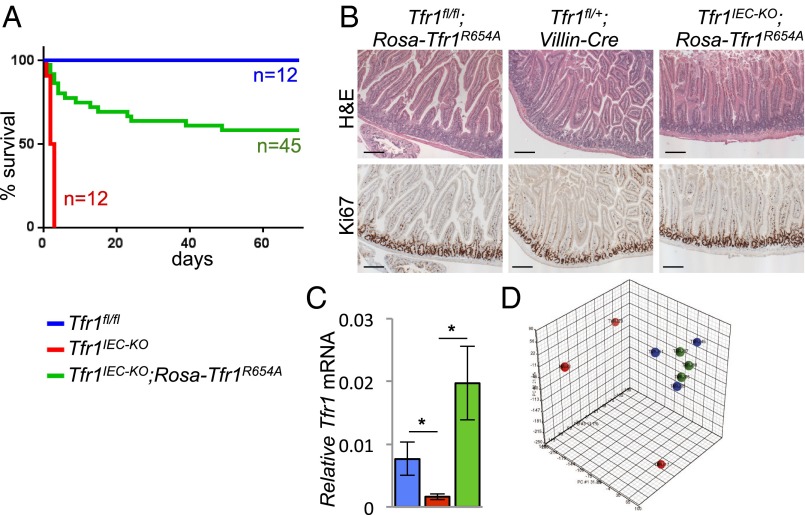
Our results suggested that Tfr1 might be needed for a function other than iron uptake. To investigate, we took advantage of Rosa26Tfr1R654A/+ mice that ubiquitously express an allele of Tfr1 carrying a missense mutation that precludes Tf binding (5). Although mice homozygous for this transgene develop mild iron overload later, their iron endowment is not increased in neonates. We bred to generate Tfr1IEC-KO mice carrying a single Rosa26Tfr1R654A allele (Tfr1IEC-KO;Rosa26Tfr1R654A/+). We found that most Tfr1IEC-KO;Rosa26Tfr1R654A/+ animals survived the neonatal period, and ∼60% were alive at 2 mo (Fig. 4A). Tfr1IEC-KO;Rosa26Tfr1R654A/+ pups that did not survive appeared to develop the same phenotype as Tfr1IEC-KO pups; we do not know why they were not rescued. Intestinal sections of Tfr1IEC-KO;Rosa26Tfr1R654A/+ survivors at 2 mo showed normal architecture and normal proliferation of crypt IECs (Fig. 4B). We confirmed that Tfr1 mRNA was increased relative to Tfr1IEC-KO mice (Fig. 4C). These observations suggest that Tfr1 plays a role in intestinal epithelial homeostasis that is independent of its ability to bind and assimilate iron-Tf.
Fig. 4.
Tfr1R654A rescues Tfr1IEC-KO mice. The color key is used throughout this figure. (A) Survival curves showed rescue of most Tfr1IEC-KO;Rosa26-Tfr1R654A/+ mice. (B) H&E staining of duodenum from 2-mo-old Tfr1fl/fl;Rosa26-Tfr1R654A/+ and Tfr1IEC-KO;Rosa26-Tfr1R654A/+ mice showed rescue of epithelial integrity (Upper). Ki67 staining at 2 mo showed normal IEC proliferation in rescued crypts (Lower). (Scale bars, 200 μM.) (C) Relative Tfr1 mRNA expression by qRT-PCR (*P < 0.05, n = 3 Tfr1fl/fl, n = 9 Tfr1IEC-KO, n = 4 Tfr1IEC-KO;Rosa26Tfr1R654A/+). (D) Principal component analysis of P0 IEC gene expression from Tfr1fl/fl, Tfr1IEC-KO, and Tfr1IEC-KO;Rosa26Tfr1R654A/+ mice (n = 3 each). Samples from Tfr1fl/fl and Tfr1IEC-KO;Rosa26Tfr1R654A/+ mice are tightly clustered (blue and green). One Tfr1IEC-KO (red) outlier is apparent toward the bottom.
Gene Expression Profiling.
We isolated P0 IECs, enriched for intervillous cells and proximal colon crypts, from each of three Tfr1fl/fl, Tfr1IEC-KO, and Tfr1IEC-KO;Rosa26Tfr1R654A/+ mice and prepared mRNA for microarray profiling (NCBI GEO accession no. GSE68984). Tfr1 mRNA was decreased in Tfr1IEC-KO mice, as previously observed, and expressed in Tfr1IEC-KO;Rosa26Tfr1R654A/+ and Tfr1fl/fl mice at comparable levels. Principal component analysis (PCA) indicated that Tfr1fl/fl and Tfr1IEC-KO;Rosa26Tfr1R654A/+ samples were highly similar to each other, but one of the three Tfr1IEC-KO samples was an outlier (Fig. 4D). The outlier mouse may have had less Tfr1 inactivation, consistent with variability shown in Fig. 1E, or expression changes might have developed later, consistent with the observed range in lifespans (Fig. 1B). To develop hypotheses, we excluded the outlier from our preliminary analysis but included it in figures shown later. Results were analyzed by the Duke Microarray Shared Resource using Partek Genomics Suite 6.5, comparing Tfr1IEC-KO with Tfr1fl/fl or with Tfr1IEC-KO;Rosa26Tfr1R654A/+ samples. The only significant differences between the two comparisons were in Y chromosome genes, attributable to differences in the proportion of male and female animals used, and in Tfr1 itself, which was more highly expressed in Tfr1IEC-KO;Rosa26Tfr1R654A/+ animals. In other words, rescued animals were similar to controls compared with Tfr1IEC-KO mice, consistent with the PCA and supporting our hypothesis that mutant Tfr1 could restore a necessary function. Furthermore, we saw no increase in mRNAs induced in iron deficiency [e.g., Slc11a2 (1), Cybrd1 (14), Cdc14a (15)], indicating that P0 IECs had obtained sufficient iron through another mechanism and supporting our interpretation that Tfr1 has a role independent of iron uptake.
We looked for informative patterns using Gene Set Enrichment Analysis (GSEA) (16, 17). Genes up-regulated at least twofold in Tfr1IEC-KO animals compared with Tfr1fl/fl animals were associated with the adult tissue stem cell signature, epithelial–mesenchymal transition (EMT), extracellular matrix interactions, axon guidance, and cell adhesion (Table S1). Many known stem cell markers—Kit, Thy1, Prom1, Cd34, Cd44, Fabp7, Ly6a, Ndn, Dclk1—were strongly up-regulated in Tfr1IEC-KO IECs. Transcriptional targets of Lef1, Foxo4, Nfat, and Maz were highly represented. These transcription factors have complex functions that could be related to the phenotype observed; several interact with Wnt (18, 19) and Notch (20, 21) signaling, which are important in IEC cell fate determination. Our results suggested that at least some cells in Tfr1IEC-KO intestine had acquired a stem cell phenotype or were undergoing EMT.
Table S1.
GSEA of differentially expressed genes in in Tfr1IEC-KO IECs
| Gene class | No. Affymetrix tags | P value | FDR Q-value |
| Up-regulated > 2X in mutant – 898 total Affymetrix tags | |||
| Wong adult tissue stem cell module | 171 | 4.12 e-134 | 4.86 e-131 |
| HALLMARK epithelial-mesenchymal transition | 90 | 7.96 e-99 | 2.16 e-96 |
| NABA matrisome (extracellular matrix genes) | 152 | 5.95 e-87 | 7.91 e-84 |
| REACTOME axon guidance | 47 | 7.96 e-32 | 1.77 e-29 |
| KEGG focal adhesion | 41 | 1.81 e-29 | 3.43 e-27 |
| KEGG ECM receptor interaction | 28 | 5.02 e-27 | 7.41 e-24 |
| CTTTGT Lef1 targets | 205 | 1.67 e-89 | 1.03 e-86 |
| TTGTTT Foxo4 (Mllt7) targets | 200 | 8.21 e-82 | 1.68 e-79 |
| TGGAAA Nfat/Nfatc targets | 191 | 1.21 e-80 | 1.86 e-79 |
| GGGAGGRR Maz targets | 207 | 7.96 e-80 | 9.79 e-78 |
| miR-200b,200c, miR-429 targets | 58 | 6.04 e-29 | 1.34 e-26 |
| miR-124a targets | 60 | 7.25 e-27 | 8.01 e-25 |
| miR-19a, 19b targets | 55 | 2.64 e-24 | 1.94 e-22 |
| miR-29a, 29b, 29c targets | 55 | 4.21 e-24 | 2.33 e-22 |
| miR-506 targets | 64 | 1.61. e-23 | 7.1 e-22 |
| miR-520d targets | 41 | 1.33 e-20 | 4.9 e-19 |
| Down-regulated > 2X in mutant – 320 total Affymetrix tags | |||
| KEGG arginine and proline metabolism | 10 | 4.25 e-12 | 5.65 e-9 |
| KEGG fatty acid metabolism | 8 | 4.87 e-10 | 3.24 e-7 |
| KEGG lysosome | 11 | 1.02 e-9 | 4.51 e-7 |
| REACTOME metabolism of lipids and Lipoproteins | 19 | 1.58 e-9 | 5.2 e-7 |
| REACTOME metabolism of amino acids and derivatives | 13 | 1.96 e-9 | 5.2 e-7 |
| KEGG glycolysis/gluconeogenesis | 8 | 1.24 e-8 | 2.05 e-6 |
| REACTOME SLC-mediated transmembrane transport | 13 | 1.83 e-8 | 2.71 e-6 |
| miR-181a, miR-181b, miR-181c, miR-181d targets | 12 | 1.72 e-4 | 2.43 e-2 |
| miR-489 targets | 5 | 3.88 e-4 | 2.43 e-2 |
| Let-7a, Let-7b, Let-7c, Let-7d, Let-7e, Let-7f, Let-7g, Let-7i, miR-98 targets | 10 | 4.65 e-4 | 2.43 e-2 |
| miR-125a, miR-125b targets | 9 | 5.51 e-4 | 2.43 e-2 |
Genes up-regulated at least twofold in Tfr1IEC-KO IECs compared with Tfr1fl/fl IECs were used for GSEA. We excluded the Tfr1IEC-KO outlier identified by PCA. Representative results are shown. This analysis was carried out on May 31, 2015. Similar results were obtained by comparing Tfr1IEC-KO IECs to Tfr1IEC-KO;Rosa26Tfr1R654A/+ IECs. FDR, false-discovery rate; KEGG, Kyoto Encyclopedia of Genes and Genomes.
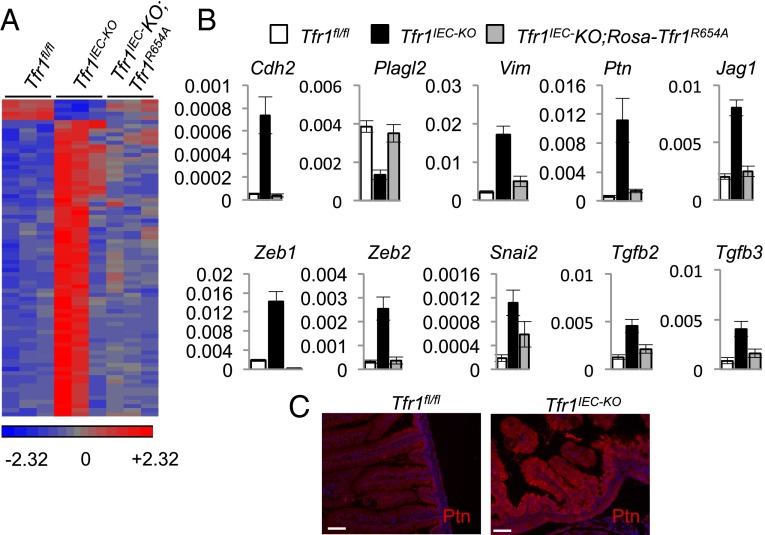
We compared expression of EMT genes in a heat map (Fig. 5A and Table S2). Approximately 70 EMT-associated genes were markedly up-regulated in two Tfr1IEC-KO mice but only a subset were up-regulated the PCA outlier mouse (Fig. 4D). Five EMT genes were up-regulated in control mice but down-regulated in Tfr1IEC-KO mice. Selected results were validated by real-time PCR using samples from a separate set of mutant and control mice and we saw no discordance (Fig. 5B). Strongly up-regulated EMT-associated genes included transcription factors activated early in EMT and their target genes. RNA encoding the growth factor pleiotrophin (Ptn), which induces EMT (22), was markedly induced and its protein product was abundant in Tfr1IEC-KO IECs (Fig. 5 B and C). Additionally, mRNAs encoding components of the Tgfβ, Wnt, Notch, and Hedgehog signaling pathways were increased. Hnf4a, which promotes mesenchymal–epithelial transition (23), was down-regulated, as was fructose-1,6-bisphosphatase 1 (Fbp1), which is repressed in EMT to cause metabolic changes (24). Although many EMT-associated genes were induced, E-cadherin mRNA was not down-regulated in Tfr1IEC-KO IECs. Down-regulation of E-cadherin is a hallmark of EMT, but it does not always occur (25). In summary, these observations indicate that Tfr1IEC-KO IECs have transcriptional changes indicative of EMT. Tfr1IEC-KO;Rosa26Tfr1R654A/+ rescued mice were more similar to Tfr1fl/fl mice than Tfr1IEC-KO mice in their expression of EMT-related genes (Fig. 5 A and B), consistent with the overall microarray data and corroborating our finding that a mutant Tfr1 that cannot bind Tf largely rescues the mutant phenotype.
Fig. 5.
Induction of EMT-associated genes. (A) Heat map representing expression of EMT-associated genes ascertained by microarray profiling of IECs at P0 (samples correspond to Fig. 4D). Color code (arbitrary scale) is at bottom. A list of genes in the same order is given in Table S2. (B) Expression of a subset of EMT-associated genes was validated using qRT-PCR (see Table S4 for primers used) with Tfr1fl/fl (n = 6), Tfr1IEC-KO (n = 9), and Tfr1IEC-KO;Rosa26Tfr1R654A/+ (n = 6) P0 IECs; key shown at top. Expression was normalized to Rpl19. All differences between Tfr1IEC-KO and the other genotypes have P < 0.05, Student’s t test. Values represent mean ± SEM. (C) Immunofluorescence detection of increased pleiotrophin (Ptn) protein in Tfr1IEC-KO IECs. Nuclei were stained with DAPI. (Scale bars, 20 μM.)
Table S2.
Names of EMT-associated genes for Fig. 5
| Gene symbol | Expression in Tfr1IEC-KO compared with Tfr1fl/fl |
| Nox4 | Down in Tfr1IEC-KO |
| Bmp7 | Down in Tfr1IEC-KO |
| Fbp1 | Down in Tfr1IEC-KO |
| Vdr | Down in Tfr1IEC-KO |
| Tert | Down in Tfr1IEC-KO |
| Lamc2 | Up in Tfr1IEC-KO |
| Vldr | Up in Tfr1IEC-KO |
| Krt19 | Up in Tfr1IEC-KO |
| Cd44 | Up in Tfr1IEC-KO |
| Prom1 | Up in Tfr1IEC-KO |
| Foxa1 | Up in Tfr1IEC-KO |
| Dsg2 | Up in Tfr1IEC-KO |
| Ahnak | Up in Tfr1IEC-KO |
| Egfr | Up in Tfr1IEC-KO |
| Cadm1 | Up in Tfr1IEC-KO |
| Serpine2 | Up in Tfr1IEC-KO |
| Jag1 | Up in Tfr1IEC-KO |
| Dpysl3 | Up in Tfr1IEC-KO |
| Tgfbr2 | Up in Tfr1IEC-KO |
| Notch2 | Up in Tfr1IEC-KO |
| Cald1 | Up in Tfr1IEC-KO |
| Mmp14 | Up in Tfr1IEC-KO |
| Fn1 | Up in Tfr1IEC-KO |
| Igfbp3 | Up in Tfr1IEC-KO |
| Tmeff1 | Up in Tfr1IEC-KO |
| Sox11 | Up in Tfr1IEC-KO |
| Fzd7 | Up in Tfr1IEC-KO |
| Spp1 | Up in Tfr1IEC-KO |
| Itgb3 | Up in Tfr1IEC-KO |
| Tgfb3 | Up in Tfr1IEC-KO |
| Meis2 | Up in Tfr1IEC-KO |
| Smo | Up in Tfr1IEC-KO |
| Notch1 | Up in Tfr1IEC-KO |
| Sox4 | Up in Tfr1IEC-KO |
| St6gal1 | Up in Tfr1IEC-KO |
| Cav1 | Up in Tfr1IEC-KO |
| Sparc | Up in Tfr1IEC-KO |
| Col1a2 | Up in Tfr1IEC-KO |
| Col1a1 | Up in Tfr1IEC-KO |
| Vim | Up in Tfr1IEC-KO |
| Cdh11 | Up in Tfr1IEC-KO |
| Fbn1 | Up in Tfr1IEC-KO |
| Ptn | Up in Tfr1IEC-KO |
| Postn | Up in Tfr1IEC-KO |
| Col3a1 | Up in Tfr1IEC-KO |
| Igfbp5 | Up in Tfr1IEC-KO |
| Tgfbr3 | Up in Tfr1IEC-KO |
| Msn | Up in Tfr1IEC-KO |
| Reln | Up in Tfr1IEC-KO |
| Notch3 | Up in Tfr1IEC-KO |
| Bgn | Up in Tfr1IEC-KO |
| Timp1 | Up in Tfr1IEC-KO |
| Zeb1 | Up in Tfr1IEC-KO |
| Igfbp4 | Up in Tfr1IEC-KO |
| Igf1 | Up in Tfr1IEC-KO |
| Serpinf1 | Up in Tfr1IEC-KO |
| Nrp1 | Up in Tfr1IEC-KO |
| Fgfr1 | Up in Tfr1IEC-KO |
| Zeb2 | Up in Tfr1IEC-KO |
| Vcan | Up in Tfr1IEC-KO |
| Ncam1 | Up in Tfr1IEC-KO |
| Gli1 | Up in Tfr1IEC-KO |
| Snai2 | Up in Tfr1IEC-KO |
| Mmp2 | Up in Tfr1IEC-KO |
| Myh11 | Up in Tfr1IEC-KO |
| Cav2 | Up in Tfr1IEC-KO |
| Dclk1 | Up in Tfr1IEC-KO |
| Col5a2 | Up in Tfr1IEC-KO |
| Cdh2 | Up in Tfr1IEC-KO |
| Hoxa5 | Up in Tfr1IEC-KO |
| Acta2 | Up in Tfr1IEC-KO |
| Vcam1 | Up in Tfr1IEC-KO |
| Tgfb2 | Up in Tfr1IEC-KO |
| Tcf4 | Up in Tfr1IEC-KO |
| Pbx1 | Up in Tfr1IEC-KO |
| Nrp2 | Up in Tfr1IEC-KO |
| Wnt5a | Up in Tfr1IEC-KO |
Intracellular Lipid Accumulation.
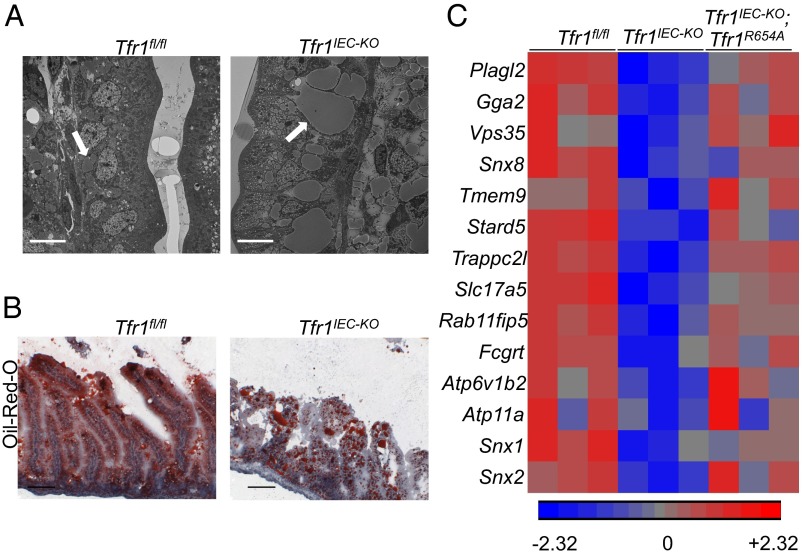
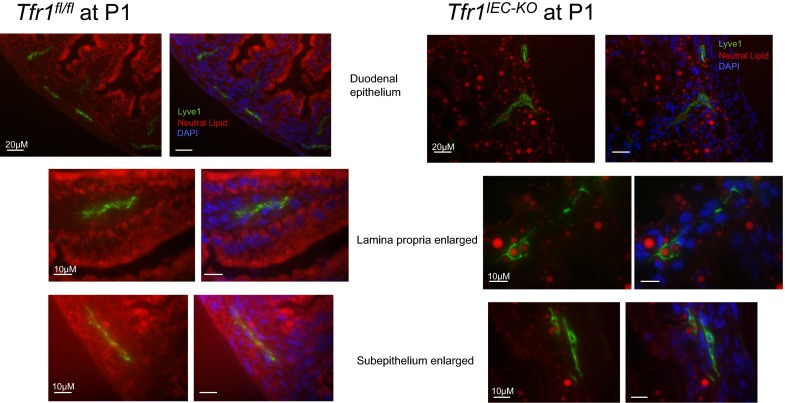
Genes down-regulated in Tfr1IEC-KO mice were associated with fatty acid metabolism, lysosomes, and lipid and lipoprotein metabolism. We noted vacuole-like structures in IECs in sections from Tfr1IEC-KO small intestine and hypothesized that they might contain lipids. Electron microscopy revealed homogeneous intracellular inclusions in Tfr1IEC-KO IECs that appeared to be present but much smaller in control animals (Fig. 6A). Oil-red-O staining confirmed that the large inclusions contained neutral lipid (Fig. 6B). Similar inclusions, larger in Tfr1IEC-KO mice than in controls, were observed in lacteal vessels of the lamina propria and lymphatic vessels of subepithelial tissue in control and mutant mice (Fig. S4).
Fig. 6.
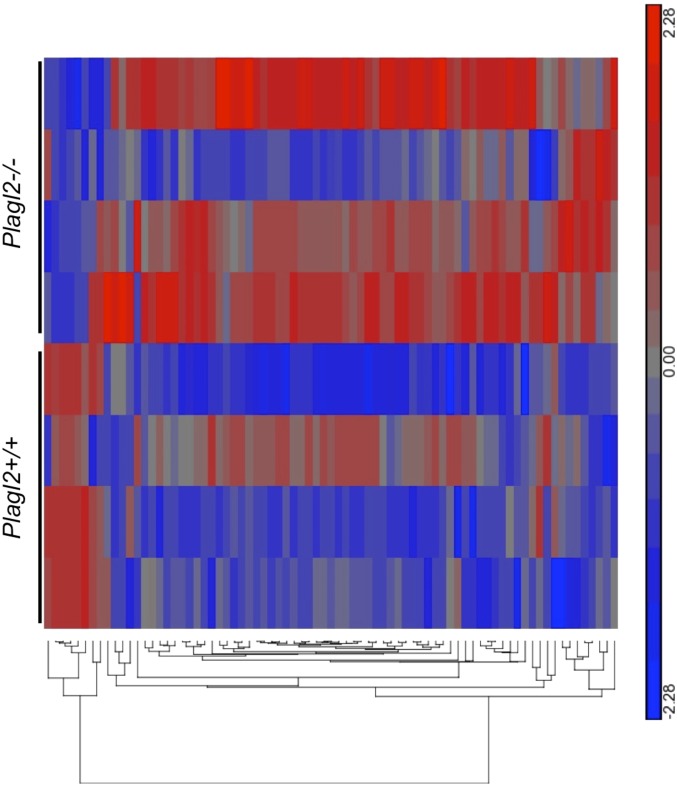
Altered lipid metabolism in Tfr1IEC-KO IECs. (A) Electron micrographs showed large inclusions in IECs of Tfr1IEC-KO intestinal epithelium and similar, smaller inclusions in Tfr1fl/fl epithelium at P1 (white arrows). (Scale bars, 10 μM.) (B) Oil-red-O staining of P1 intestinal epithelium confirming that inclusions, seen as large red spots in Tfr1IEC-KO IECs, contain neutral lipids. Staining was more diffuse in Tfr1fl/fl IECs. (Scale bars, 100 μM.) See Fig. S4 for additional detail. (C) Heat map of genes reported to be down-regulated in Plagl2−/− mice (28), from microarray profiles of Tfr1fl/fl, Tfr1IEC-KO, and Tfr1IEC-KO;Rosa26-Tfr1R654A/+ IECs.
Fig. S4.
Neutral fat in lymphatic vessels (supplemental to Fig. 6). Neutral lipid in the lacteal system was detected by fixing frozen sections in 4% paraformaldehyde and costaining with human anti-mouse Lyve-1 conjugated to Alexafluor 488 (eBioscience) and LipidTOX Red Neutral Lipid Stain (Life Technologies). DAPI stain was used to identify nuclei to discern villous structure.
Loss of transcription factor Plagl2 similarly results in accumulation of lipid vacuoles within IECs and Plagl2−/− pups also died early in life (26). Microarray analysis of Plagl2−/− IECs showed decreased expression of cargo transport and vacuolar trafficking genes, thought to lead to improper chylomicron assembly and transport, resulting in lipid accumulation (26). Importantly, Plagl2 mRNA was down-regulated in Tfr1IEC-KO IECs, and we observed decreased expression of the same genes decreased in Plagl2−/− IECs thought to act in chylomicron packaging (Fig. 6C) (26). Consistent with other results, transcript levels showed partial restoration in Tfr1IEC-KO;Rosa26Tfr1R654A/+ IECs.
Using publicly available data reported by Van Dyck et al. (26), we asked whether Plagl2−/− IECs also had changes suggesting EMT. Although not as striking as what we observed in Tfr1IEC-KO IECs, Plagl2−/− IECs showed a similar pattern of EMT gene expression (Fig. S5 and Table S3). Four of five EMT genes down-regulated in Tfr1IEC-KO IECs (Nox4, Bmp7, Tert, Fbp1) were also down-regulated in Plagl2−/− IECs, and the patterns of up-regulated genes were similar.
Fig. S5.
EMT gene expression in Plagl2−/− mice. The dataset described by Van Dyck et al. (26) is publically available. Considering that Tfr1IEC-KO animals showed expression of lipid-related genes that was similar to that described in Plagl2−/− mice, we asked whether expression of EMT-related genes were similarly altered. As shown in this figure, it appeared that many were, though the pattern was not as striking as seen in Tfr1IEC-KO mice.
Table S3.
Names of EMT-associated genes for Fig. S6
| Gene symbol |
| Igfbp3 |
| Nox4 |
| Bmp7 |
| Tert |
| Fbp1 |
| Notch1 |
| Reln |
| Bgn |
| Cav2 |
| Tgfb3 |
| Notch3 |
| Dclk1 |
| Meis2 |
| Msn |
| Sparc |
| Cav1 |
| Zeb2 |
| Postn |
| Fgfr1 |
| Fn1 |
| Wnt5a |
| Igfbp5 |
| Sox11 |
| St6gal1 |
| Pbx1 |
| Notch2 |
| Cald1 |
| Serpinf1 |
| Dpysf3 |
| Hoxa5 |
| Tmeff1 |
| Serpine2 |
| Cadm1 |
| Col3a1 |
| Fbn1 |
| Col5a2 |
| Vim |
| Igf1 |
| Cdh2 |
| Col1a2 |
| Ptn |
| Mmp14 |
| Cdh11 |
| Smo |
| Sox4 |
| Fzd7 |
| Acta2 |
| Igfbp4 |
| Mmp2 |
| Vcan |
| Myh11 |
| Snai2 |
| Ncam1 |
| Egfr |
| Nrp2 |
| Timp1 |
| Tgfb2 |
| Gli1 |
| Prom1 |
| Tcf4 |
| Zeb1 |
| Cd44 |
| Nrp1 |
| Jag1 |
| Col1a1 |
| Vam1 |
| Tgfbr3 |
| Tfrbr2 |
| Itgb3 |
| Foxa1 |
| Spp1 |
| Lamc2 |
| Krt19 |
| Ahnak |
| Dsg2 |
| Vdr |
| Vldr |
EMT-associated genes are listed in order corresponding to the heatmap in Fig. S4. Genes that were down-regulated in both Tfr1IEC-CKO and Plagl2−/− mice are in boldface.
Table S4.
Primers used for qRT-PCR for Fig. 5
| RT-PCR primer name | 5′-Forward primer sequence-3′ | 5′-Reverse primer sequence-3′ |
| Tfr1 | TCA AGC CAG ATC AGC AATT CTC | AGC CAG TTT CAT CTC CAC ATG |
| Cdh2 | AGC GCA GTC TTA CCG AAG G | TCG CTG CTT TCA TAC TGA ACT TT |
| Zeb1 | TGG CAA GAC AAC GTG AAA GA | AAC TGG GAA AAT GCA TCT GG |
| Zeb2 | TAG CCG GTC CAG AAG AAA TG | GGC CAT CTC TTT CCT CCA GT |
| Plagl2 | GCA GAG ACC ATA TAG CTG TCC TCA | GGG TGG CCA TGT GCC TAT AC |
| Snai2 | TGA TGC CCA GTC TAG GAA AT | AGT GAG GGC AAG AGA AAG G |
| Ptn | AAA AAT GTC GTC CCA GCA AT | GCT CCA AAC TGC TTC TTC CA |
| Vim | CGG CTG CGA GAG AAA TTG C | CCA CTT TCC GTT CAA GGT CAA G |
| Tgfb2 | TAA AAT CGA CAT GCC GTC CC | GAG ACA TCA AAG CGG ACG AT |
| Tgfb3 | CCA CAA GGG GCA CCG CTG AA | CCC AGG TCT CCA CGG CCA TG |
| Jag1 | AGA AGT CAG AGT TCA GAG GCG TCC | AGT AGA AGG CTG TCA CCA AGC AAC |
| Rpl19 | AGG CAT ATG GGC ATA GGG AAG AG | TTG ACC TTC AGG TAC AGG CTG TG |
Discussion
Tfr1 is important for iron acquisition by erythroid cells, but its roles in most other tissues have not been characterized. We showed that Tfr1 is required for IEC proliferation and homeostasis in developing and adult intestine. Animals lacking Tfr1 in IECs died early in life, with severe disruption of epithelial integrity, lipid inclusions, and impaired proliferation. Enforced iron overload did not rescue, suggesting that iron deficiency was not the cause. However, transgenic expression of a mutant allele of Tfr1 that is unable to bind iron-loaded Tf did rescue, raising the possibility that Tfr1 has a novel function in IECs that does not involve iron uptake. Three subphenotypes appeared in IECs lacking Tfr1, which could contribute to epithelial disruption and early lethality: increased expression of genes involved in EMT, interrupted lipid trafficking, and impaired proliferation associated with increased expression of stem cell markers. There is no known connection between Tfr1 and any of these subphenotypes. Interestingly, however, treatment of cultured tumor cells with iron chelators, which should increase Tfr1 expression (27), impairs EMT progression (28).
We have not yet determined how inactivation of Tfr1 causes the mutant phenotype. However, Plagl2−/− mice offer a clue. Tfr1IEC-KO and Plagl2−/− mice showed similar lipid accumulation in neonatal IECs and decreased expression of a common set of sorting and transport molecules. Plagl2 is involved in regulation of Wnt signaling and cellular proliferation (29), potentially linking this molecule to the other subphenotypes of EMT and decreased proliferation. Analysis of publicly available transcriptome data from Plagl2−/− mice (26) suggests that EMT-associated genes may be similarly regulated in that mutant, though not to the extent we observed in Tfr1IEC-KO mice. Plagl2 induces Wnt signaling to block differentiation and promote proliferation (29). A neighboring gene, Pofut1, is also down-regulated in our mice and in Plagl2−/− mice (26), and might contribute to decreased proliferation. Plagl2 and Pofut1 likely share a promoter region. Pofut1 is an O-fucosylating enzyme that modulates Notch signaling to promote proliferation of muscle stem cells (30). Elucidation of the function of Plagl2 and its relationship with Pofut1 may provide clues to the novel role of Tfr1 in IECs.
Decreased proliferation and increased stem cell markers suggest that Tfr1IEC-KO IEC stem cells may have become quiescent. Interestingly, we did not see differential regulation of Lgr5 or Bmi1, both associated with intestinal stem cells (10). Under other circumstances decreased proliferation might have been attributed to cellular iron deficiency, but our rescue experiments showed that Tfr1 served a different, as yet unknown, purpose. EMT has been associated with “stemness” in both development and cancer (31), possibly linking the phenotypes we observed, but an association between EMT and the large array of stem cell markers up-regulated in Tfr1IEC-KO IECs has not previously been reported.
We showed that Tfr1IEC-KO;Rosa26Tfr1R654A/+ mice were protected from abnormalities observed in Tfr1IEC-KO mice, indicating that iron uptake was not needed for rescue. We speculate that the essential role of Tfr1 in IECs involves signal transduction that is independent of Fe-Tf binding. Such a role has been proposed in other contexts. Tfr1 has been implicated in the formation of the immunological synapse in T cells (32) and in T-cell receptor signaling (33). Tfr1 has been proposed to be involved in NF-κB signaling (34) and in neoplastic transformation by sphingosine kinase 1 (35). Tfr1 was also identified as a cellular target of gambogic acid (GA), a natural compound that induces apoptosis (36). GA inhibits Tfr1 internalization, and its activity apparently involves signaling. Jian et al. reported that Tfr1 interacts with Src, and phosphorylation of Tfr1 residue 20Y by Src decreases apoptosis and promotes cancer cell survival (37). GA induced phosphorylation of p38, JNK, and ERK in a manner that was independent of Tf binding and iron uptake and Tfr1 mutants at 20Y were more susceptible to GA. Senyilmaz et al. reported a similar signaling activity of Tfr1, which also involved activation of JNK signaling and was modulated by stearic acid (38). JNK signaling has been linked to intestinal epithelial homeostasis and villus length (39). Taken together, these studies suggest that loss of Tfr1 might result in decreased JNK signaling, contributing to the phenotype we have observed.
In summary, we have characterized a role for Tfr1, a molecule that has been used widely as a marker for endocytic pathways, and which has an important role in iron delivery. Our results implicate Tfr1 in inhibiting EMT, a change in cell fate that is intricately linked to development, tissue repair, and cancer progression (40), and in intestinal homeostasis more broadly. We do not yet know what the iron-independent function of Tfr1 is in IECs, but its putative signaling roles provide clues for future work. We speculate that this function of Tfr1 may be important in other cell types, particularly in hematopoietic cells where it appears to be absolutely required (3).
Materials and Methods
Conditional Inactivation of Tfr1 in Mice.
We induced homologous recombination in embryonic stem (ES) cells using a construct containing 5.1 kb of DNA, including exons 1 and 2, a loxP-flanked (floxed) neo cassette inserted into intron 2, and 7.7 kb of DNA, including exons 3–11, modified by introducing a single loxP site in intron 6 (Fig. S1). A correctly targeted ES cell clone was injected into blastocysts to produce a chimeric mouse that transmitted the modified allele through the germ line. A male heterozygous for the targeted allele was bred with a female expressing a Gata1-Cre transgene (41) to ultimately produce animals that had deleted the neo cassette, retained loxP sites flanking exons 3–6, and lost the Cre transgene. They were bred to homozygosity for the targeted allele (Tfr1fl/fl) on a 129S1/Svimj (129) background. Tfr1fl/fl;villin-Cre (Tfr1IEC-KO) mice were generated by crossing Tfr1fl/fl and villin-Cre mice on a 129 background (13) to delete exons 3–6 in the intestinal epithelium. Tfr1iIEC-KO mice were generated by crossing Tfr1fl/fl mice with villin-CreERT2 mice on a C57BL/6 background (13). Resulting progeny were intercrossed to generate Tfr1flfl;villin-CreERT2 mice.
Tfr1IEC-KO;Rosa26Tfr1R654A/+ mice were generated by crossing Tfr1fl/+;villin-Cre mice with Rosa26Tfr1R654A/+mice on a 129 background (5). Resulting Tfr1fl/+;villin-Cre; Rosa26Tfr1R654A/+ and Tfr1fl/+;villin-Cre progeny were intercrossed to generate Tfr1IEC-KO;Rosa26Tfr1R654A/+ mice used in experiments. All mouse procedures were performed according to the Duke University Division of Laboratory Animal Resources and the Institutional Animal Care and Use Committee guidelines.
Histology.
Tissue was fixed in 10% (vol/vol) formalin, treated with 70% (vol/vol) ethanol, embedded in paraffin, and sectioned longitudinally. H&E staining was performed on deparaffinized and rehydrated sections. Ki67 staining was performed after antigen retrieval by boiling slides in 10 mM Na citrate pH 6.0.
IEC Isolation.
Intervillous and crypt-enriched IECs were harvested by rocking intestine and colon in 5 μM EDTA and ice-cold PBS for 30 min. IECs were detached by vigorous shaking, strained through a 70-μm filter, and pelleted in cold PBS. Pellets were washed with cold PBS three times.
Immunoblot.
Enriched IECs were lysed and sonicated in 150 mM Na chloride, 1.0% Triton X-100, and 50 mM Tris. After solubilization in Laemmli buffer for 30 min at room temperature, 20 μg of protein per sample was fractionated on 4–20% SDS/PAGE gels (Bio-Rad) and transferred to a PDVD membrane (Bio-Rad). Immunoblotting was performed using mouse anti-human Tfr1 (Life Technologies, 13-6890) diluted 1:1,000 in PBST. Blots were stripped and reprobed with anti-mouse β-actin (Sigma, A1978) diluted 1:1,000 in PBST. Anti-mouse HRP-linked IgG (GE Healthcare, NA931V) diluted 1:1,000 in PBST was used as a secondary antibody with the ECL Western Blotting Detection Kit (GE Healthcare, RPN2106).
Nonheme Iron Assay.
Duodenal sections were dissected from iron-dextran treated and untreated mice, flushed with cold PBS, and bisected longitudinally. IEC scrapings were taken using a razor blade. Nonheme iron content was quantified as previously described (42).
Microarray and Quantitative RT-PCR Analyses.
Enriched IECs from intervillous spaces and proximal colonic crypts were isolated from P0 pups. RNA was prepared using RNeasy (Qiagen). Microarray analysis was performed with Genechip Mouse Genome 430 2.0 Arrays (Affymetrix) by the Duke Microarray Shared Resource. cDNA was prepared using iScript (Bio-Rad), and quantitative RT-PCR (qRT-PCR) was performed using SYBR Green (Bio-Rad). Rpl19 was used to normalize.
Immunofluorescence and Oil-Red-O Staining.
Tissue was embedded in OCT media, snap frozen in liquid nitrogen, sectioned longitudinally, fixed with cold acetone for 15 min, and permeabilized with 0.1% Tween-20. Sections were stained with mouse anti-human Tfr1 (Invitrogen), goat anti-mouse Alexafluor 488 secondary (Life Technologies), and DAPI or with goat anti-human Ptn (R&D Systems), donkey anti-goat Alexafluor 568 (Life Technologies), and DAPI. Thin sections (5 μM) were also stained with Oil-Red-O to assess neutral lipid content.
Tamoxifen and Iron Dextran Administration.
Tamoxifen was administered to 2-mo-old mice by daily intraperitoneal injection, 75 ng/g body weight, for 5 d. Tamoxifen was dissolved in ethanol with autoclaved sunflower seed oil as the carrier. Ethanol with sunflower seed oil was injected as a vehicle control. One milligram of iron dextran (Uniferon 100) was administered by intraperitoneal injection.
Statistical Analysis.
P values were determined for RT-PCR values by Student’s t test. Error bars the represent SEM.
Acknowledgments
We thank the Duke Microarray Shared Resource for performing microarray experiments and statistical analysis; Zhengzheng Wei for developing heat maps; and the N.C.A. laboratory for helpful discussions. This work was supported by the Roche Foundation for Anemia Research and National Institutes of Health Grant R01 DK089705 (to N.C.A.).
Footnotes
The authors declare no conflict of interest.
Data deposition: The data reported in this paper have been deposited in the Gene Expression Omnibus (GEO) database, www.ncbi.nlm.nih.gov/geo (accession no. GSE68984).
This article contains supporting information online at www.pnas.org/lookup/suppl/doi:10.1073/pnas.1511701112/-/DCSupplemental.
References
- 1.Hentze MW, Muckenthaler MU, Andrews NC. Balancing acts: Molecular control of mammalian iron metabolism. Cell. 2004;117(3):285–297. doi: 10.1016/s0092-8674(04)00343-5. [DOI] [PubMed] [Google Scholar]
- 2.Levy JE, Jin O, Fujiwara Y, Kuo F, Andrews NC. Transferrin receptor is necessary for development of erythrocytes and the nervous system. Nat Genet. 1999;21(4):396–399. doi: 10.1038/7727. [DOI] [PubMed] [Google Scholar]
- 3.Ned RM, Swat W, Andrews NC. Transferrin receptor 1 is differentially required in lymphocyte development. Blood. 2003;102(10):3711–3718. doi: 10.1182/blood-2003-04-1086. [DOI] [PubMed] [Google Scholar]
- 4.Trenor CC, 3rd, Campagna DR, Sellers VM, Andrews NC, Fleming MD. The molecular defect in hypotransferrinemic mice. Blood. 2000;96(3):1113–1118. [PubMed] [Google Scholar]
- 5.Schmidt PJ, Toran PT, Giannetti AM, Bjorkman PJ, Andrews NC. The transferrin receptor modulates Hfe-dependent regulation of hepcidin expression. Cell Metab. 2008;7(3):205–214. doi: 10.1016/j.cmet.2007.11.016. [DOI] [PMC free article] [PubMed] [Google Scholar]
- 6.Matysiak-Budnik T, et al. Secretory IgA mediates retrotranscytosis of intact gliadin peptides via the transferrin receptor in celiac disease. J Exp Med. 2008;205(1):143–154. doi: 10.1084/jem.20071204. [DOI] [PMC free article] [PubMed] [Google Scholar]
- 7.Cao H, Chen J, Krueger EW, McNiven MA. SRC-mediated phosphorylation of dynamin and cortactin regulates the “constitutive” endocytosis of transferrin. Mol Cell Biol. 2010;30(3):781–792. doi: 10.1128/MCB.00330-09. [DOI] [PMC free article] [PubMed] [Google Scholar]
- 8.Collawn JF, et al. YTRF is the conserved internalization signal of the transferrin receptor, and a second YTRF signal at position 31-34 enhances endocytosis. J Biol Chem. 1993;268(29):21686–21692. [PubMed] [Google Scholar]
- 9.Ferrando IM, et al. Identification of targets of c-Src tyrosine kinase by chemical complementation and phosphoproteomics. Mol Cell Proteomics. 2012;11(8):355–369. doi: 10.1074/mcp.M111.015750. [DOI] [PMC free article] [PubMed] [Google Scholar]
- 10.Clevers H. The intestinal crypt, a prototype stem cell compartment. Cell. 2013;154(2):274–284. doi: 10.1016/j.cell.2013.07.004. [DOI] [PubMed] [Google Scholar]
- 11.Levine DS, Woods JW. Immunolocalization of transferrin and transferrin receptor in mouse small intestinal absorptive cells. J Histochem Cytochem. 1990;38(6):851–858. doi: 10.1177/38.6.2186090. [DOI] [PubMed] [Google Scholar]
- 12.Andrews NC. Disorders of iron metabolism. N Engl J Med. 1999;341(26):1986–1995. doi: 10.1056/NEJM199912233412607. [DOI] [PubMed] [Google Scholar]
- 13.el Marjou F, et al. Tissue-specific and inducible Cre-mediated recombination in the gut epithelium. Genesis. 2004;39(3):186–193. doi: 10.1002/gene.20042. [DOI] [PubMed] [Google Scholar]
- 14.McKie AT, et al. An iron-regulated ferric reductase associated with the absorption of dietary iron. Science. 2001;291(5509):1755–1759. doi: 10.1126/science.1057206. [DOI] [PubMed] [Google Scholar]
- 15.Sanchez M, et al. Iron regulation and the cell cycle: Identification of an iron-responsive element in the 3′-untranslated region of human cell division cycle 14A mRNA by a refined microarray-based screening strategy. J Biol Chem. 2006;281(32):22865–22874. doi: 10.1074/jbc.M603876200. [DOI] [PubMed] [Google Scholar]
- 16.Subramanian A, et al. Gene set enrichment analysis: A knowledge-based approach for interpreting genome-wide expression profiles. Proc Natl Acad Sci USA. 2005;102(43):15545–15550. doi: 10.1073/pnas.0506580102. [DOI] [PMC free article] [PubMed] [Google Scholar]
- 17.Mootha VK, et al. PGC-1alpha-responsive genes involved in oxidative phosphorylation are coordinately downregulated in human diabetes. Nat Genet. 2003;34(3):267–273. doi: 10.1038/ng1180. [DOI] [PubMed] [Google Scholar]
- 18.Eastman Q, Grosschedl R. Regulation of LEF-1/TCF transcription factors by Wnt and other signals. Curr Opin Cell Biol. 1999;11(2):233–240. doi: 10.1016/s0955-0674(99)80031-3. [DOI] [PubMed] [Google Scholar]
- 19.Essers MA, et al. Functional interaction between beta-catenin and FOXO in oxidative stress signaling. Science. 2005;308(5725):1181–1184. doi: 10.1126/science.1109083. [DOI] [PubMed] [Google Scholar]
- 20.Ross DA, Kadesch T. The notch intracellular domain can function as a coactivator for LEF-1. Mol Cell Biol. 2001;21(22):7537–7544. doi: 10.1128/MCB.21.22.7537-7544.2001. [DOI] [PMC free article] [PubMed] [Google Scholar]
- 21.Katoh M. Networking of WNT, FGF, Notch, BMP, and Hedgehog signaling pathways during carcinogenesis. Stem Cell Rev. 2007;3(1):30–38. doi: 10.1007/s12015-007-0006-6. [DOI] [PubMed] [Google Scholar]
- 22.Perez-Pinera P, Alcantara S, Dimitrov T, Vega JA, Deuel TF. Pleiotrophin disrupts calcium-dependent homophilic cell-cell adhesion and initiates an epithelial-mesenchymal transition. Proc Natl Acad Sci USA. 2006;103(47):17795–17800. doi: 10.1073/pnas.0607299103. [DOI] [PMC free article] [PubMed] [Google Scholar]
- 23.Cicchini C, et al. Molecular mechanisms controlling the phenotype and the EMT/MET dynamics of hepatocyte. Liver Int. 2015;35(2):302–310. doi: 10.1111/liv.12577. [DOI] [PMC free article] [PubMed] [Google Scholar]
- 24.Dong C, et al. Loss of FBP1 by Snail-mediated repression provides metabolic advantages in basal-like breast cancer. Cancer Cell. 2013;23(3):316–331. doi: 10.1016/j.ccr.2013.01.022. [DOI] [PMC free article] [PubMed] [Google Scholar]
- 25.Anastassiou D, et al. Human cancer cells express Slug-based epithelial-mesenchymal transition gene expression signature obtained in vivo. BMC Cancer. 2011;11:529. doi: 10.1186/1471-2407-11-529. [DOI] [PMC free article] [PubMed] [Google Scholar]
- 26.Van Dyck F, et al. Loss of the PlagL2 transcription factor affects lacteal uptake of chylomicrons. Cell Metab. 2007;6(5):406–413. doi: 10.1016/j.cmet.2007.09.010. [DOI] [PubMed] [Google Scholar]
- 27.Mattia E, Rao K, Shapiro DS, Sussman HH, Klausner RD. Biosynthetic regulation of the human transferrin receptor by desferrioxamine in K562 cells. J Biol Chem. 1984;259(5):2689–2692. [PubMed] [Google Scholar]
- 28.Chen Z, et al. The iron chelators Dp44mT and DFO inhibit TGF-β-induced epithelial-mesenchymal transition via up-regulation of N-Myc downstream-regulated gene 1 (NDRG1) J Biol Chem. 2012;287(21):17016–17028. doi: 10.1074/jbc.M112.350470. [DOI] [PMC free article] [PubMed] [Google Scholar]
- 29.Zheng H, et al. PLAGL2 regulates Wnt signaling to impede differentiation in neural stem cells and gliomas. Cancer Cell. 2010;17(5):497–509. doi: 10.1016/j.ccr.2010.03.020. [DOI] [PMC free article] [PubMed] [Google Scholar]
- 30.Der Vartanian A, et al. Protein O-fucosyltransferase 1 expression impacts myogenic C2C12 cell commitment via the Notch signaling pathway. Mol Cell Biol. 2015;35(2):391–405. doi: 10.1128/MCB.00890-14. [DOI] [PMC free article] [PubMed] [Google Scholar]
- 31.Lamouille S, Xu J, Derynck R. Molecular mechanisms of epithelial-mesenchymal transition. Nat Rev Mol Cell Biol. 2014;15(3):178–196. doi: 10.1038/nrm3758. [DOI] [PMC free article] [PubMed] [Google Scholar]
- 32.Batista A, Millán J, Mittelbrunn M, Sánchez-Madrid F, Alonso MA. Recruitment of transferrin receptor to immunological synapse in response to TCR engagement. J Immunol. 2004;172(11):6709–6714. doi: 10.4049/jimmunol.172.11.6709. [DOI] [PubMed] [Google Scholar]
- 33.Salmerón A, et al. Transferrin receptor induces tyrosine phosphorylation in T cells and is physically associated with the TCR zeta-chain. J Immunol. 1995;154(4):1675–1683. [PubMed] [Google Scholar]
- 34.Kenneth NS, Mudie S, Naron S, Rocha S. TfR1 interacts with the IKK complex and is involved in IKK-NF-κB signalling. Biochem J. 2013;449(1):275–284. doi: 10.1042/BJ20120625. [DOI] [PMC free article] [PubMed] [Google Scholar]
- 35.Pham DH, et al. Enhanced expression of transferrin receptor 1 contributes to oncogenic signalling by sphingosine kinase 1. Oncogene. 2014;33(48):5559–5568. doi: 10.1038/onc.2013.502. [DOI] [PubMed] [Google Scholar]
- 36.Kasibhatla S, et al. A role for transferrin receptor in triggering apoptosis when targeted with gambogic acid. Proc Natl Acad Sci USA. 2005;102(34):12095–12100. doi: 10.1073/pnas.0406731102. [DOI] [PMC free article] [PubMed] [Google Scholar]
- 37.Jian J, Yang Q, Huang X. Src regulates Tyr(20) phosphorylation of transferrin receptor-1 and potentiates breast cancer cell survival. J Biol Chem. 2011;286(41):35708–35715. doi: 10.1074/jbc.M111.271585. [DOI] [PMC free article] [PubMed] [Google Scholar]
- 38.Senyilmaz D, et al. 2015. Regulation of mitochondrial morphology and function by stearoylation of TFR1. Nature, 10.1038/nature14601.
- 39.Sancho R, et al. JNK signalling modulates intestinal homeostasis and tumourigenesis in mice. EMBO J. 2009;28(13):1843–1854. doi: 10.1038/emboj.2009.153. [DOI] [PMC free article] [PubMed] [Google Scholar]
- 40.Gonzalez DM, Medici D. Signaling mechanisms of the epithelial-mesenchymal transition. Sci Signal. 2014;7(344):re8. doi: 10.1126/scisignal.2005189. [DOI] [PMC free article] [PubMed] [Google Scholar]
- 41.McDevitt MA, Fujiwara Y, Shivdasani RA, Orkin SH. An upstream, DNase I hypersensitive region of the hematopoietic-expressed transcription factor GATA-1 gene confers developmental specificity in transgenic mice. Proc Natl Acad Sci USA. 1997;94(15):7976–7981. doi: 10.1073/pnas.94.15.7976. [DOI] [PMC free article] [PubMed] [Google Scholar]
- 42.Torrance JD, Bothwell TH. A simple technique for measuring storage iron concentrations in formalinised liver samples. S Afr J Med Sci. 1968;33(1):9–11. [PubMed] [Google Scholar]


