Significance
Here we show that angiopoietin-like protein 3 (ANGPTL3) plays a major role in the trafficking of energy substrates to either storage or oxidative tissues in response to food intake. During fasting, adipose tissue releases fatty acids into the circulation for uptake by oxidative tissues. After feeding, the flow of fatty acids is reversed and the adipose tissue is replenished. In mice lacking ANGPTL3, the uptake of fatty acids from the circulation into adipose tissue was markedly reduced after refeeding. Triglyceride stores were maintained by increasing glucose uptake and converting it to fatty acids and triglycerides. Thus, ANGPTL3 acts like a hormone that is produced by the liver to coordinate substrate trafficking to peripheral tissues in response to dietary intake.
Keywords: angiopoietin, triglyceride, lipoprotein lipase, glucose, insulin
Abstract
Angiopoietin-like protein 3 (ANGPTL3) is a circulating inhibitor of lipoprotein and endothelial lipase whose physiological function has remained obscure. Here we show that ANGPTL3 plays a major role in promoting uptake of circulating very low density lipoprotein-triglycerides (VLDL-TGs) into white adipose tissue (WAT) rather than oxidative tissues (skeletal muscle, heart brown adipose tissue) in the fed state. This conclusion emerged from studies of Angptl3−/− mice. Whereas feeding increased VLDL-TG uptake into WAT eightfold in wild-type mice, no increase occurred in fed Angptl3−/− animals. Despite the reduction in delivery to and retention of TG in WAT, fat mass was largely preserved by a compensatory increase in de novo lipogenesis in Angptl3−/− mice. Glucose uptake into WAT was increased 10-fold in KO mice, and tracer studies revealed increased conversion of glucose to fatty acids in WAT but not liver. It is likely that the increased uptake of glucose into WAT explains the increased insulin sensitivity associated with inactivation of ANGPTL3. The beneficial effects of ANGPTL3 deficiency on both glucose and lipoprotein metabolism make it an attractive therapeutic target.
Energy homeostasis is maintained by a complex regulatory network that synchronizes fuel metabolism with nutrient availability. During fasting, hormonal and neuronal signals promote trafficking of fatty acids from white adipose tissue (WAT) to oxidative tissues (1). Upon refeeding, the flux of fatty acids is reversed and the reservoirs of triglyceride (TG) in WAT are replenished, primarily from circulating lipoproteins (2). The uptake of lipoprotein TG is mediated by lipoprotein lipase (LPL), which hydrolyzes TG to fatty acids at capillary endothelial surfaces, but the mechanisms by which WAT TG flux is coordinated with diurnal variations in food intake have not been defined.
The activity of LPL in WAT and oxidative tissues is reciprocally regulated in response to nutritional cues (3), primarily by posttranscriptional mechanisms (4). In WAT, fasting induces the expression of angiopoietin-like protein (ANGPTL) 4 (5), which inhibits LPL activity (6) and promotes intracellular lipolysis (7), thereby directing circulating TG to oxidative tissues. Feeding suppresses expression of ANGPTL4, leading to increased LPL activity and consequently increased uptake of very low density lipoprotein (VLDL) TG into WAT (8–10). The finding that WAT mass is decreased by 50% in mice overexpressing ANGPTL4 (10) is consistent with this model.
The opposite pattern of LPL regulation is seen in heart, skeletal muscle, and brown adipose tissue (BAT) (3, 11). Feeding suppresses LPL activity in these tissues, thereby sparing VLDL-TG for uptake and storage by WAT (3, 9). Recently, we showed that the postprandial partitioning of TG is mediated at least in part by ANGPTL8, an atypical ANGPTL that is expressed at low levels in liver and WAT of fasted animals and is strongly induced by feeding (12–14). Mice lacking ANGPTL8 fail to increase VLDL-TG uptake into WAT after feeding and consequently accrete substantially less WAT than do their wild-type (WT) littermates (15). Accordingly, we proposed that ANGPTL8 acts as a postprandial counterpart to ANGPTL4 (15).
The N-terminal motif in ANGPTL4 and ANGPTL8 that binds and inhibits LPL is shared by ANGPTL3 (16). In contrast to ANGPTL4 and ANGPTL8, ANGPTL3 expression is restricted to the liver (17), and is only modestly affected by fasting and refeeding (15, 18). Inactivation of ANGPTL3 has well-characterized effects on circulating levels of lipoproteins (19, 20), but its physiological role remains enigmatic (8). To elucidate the role of ANGPTL3 in energy metabolism, we compared the trafficking of circulating TG and glucose to peripheral tissues in Angptl3 knockout (Angptl3-/−) mice and in their WT littermates. Here we show that ANGPTL3 plays a pivotal role in determining substrate delivery, storage, and utilization in WAT.
Results
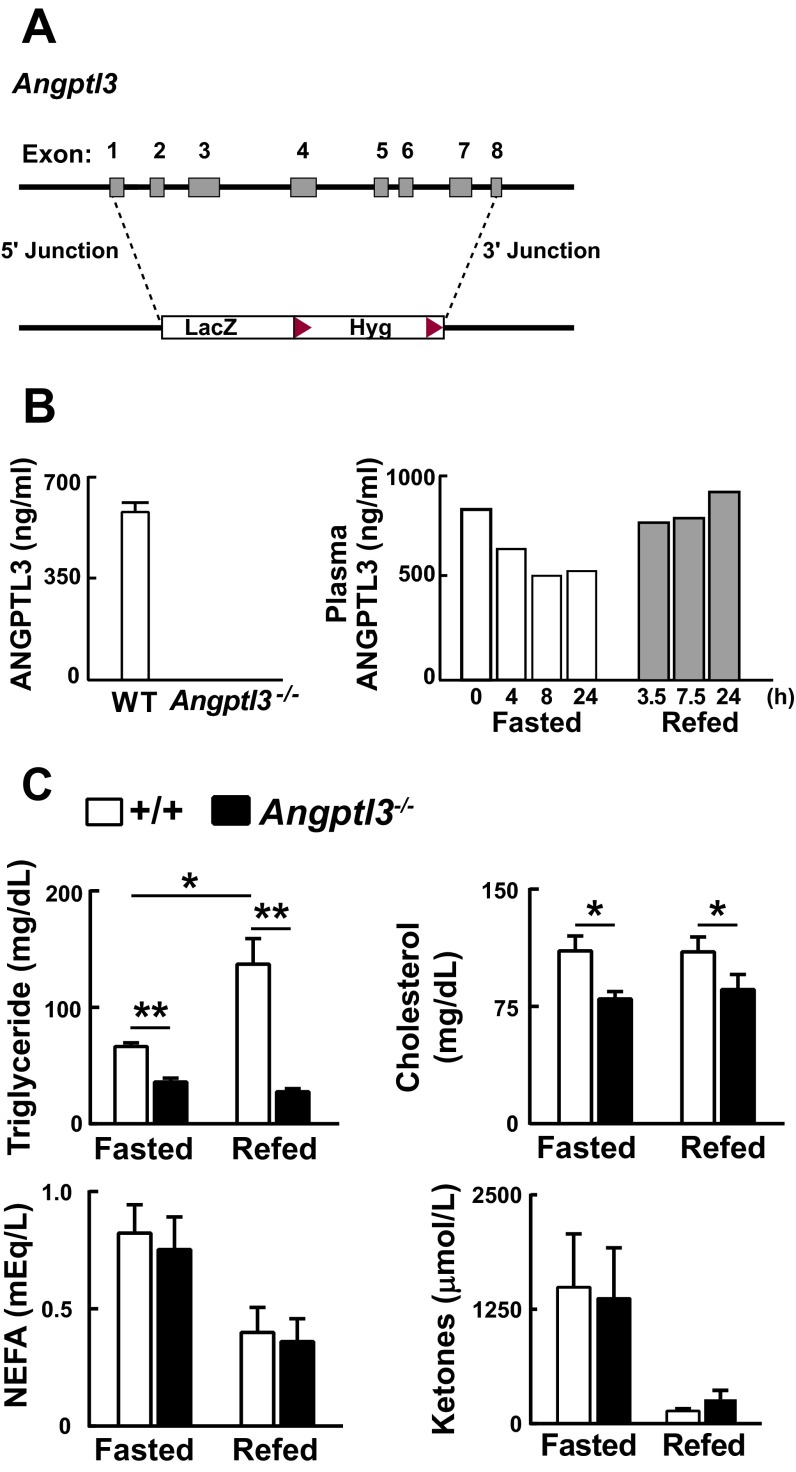
Angptl3−/− mice (Fig. S1A) were born in expected Mendelian ratios and developed normally despite an absence of circulating ANGPTL3 (Fig. S1B). Mice were entrained to a synchronized feeding regimen of 12-h fasting (day), 12-h feeding (night) for 3 d before each experiment, unless otherwise stated. Plasma TG and cholesterol levels were lower in knockout (KO) mice, as reported previously (20), whereas plasma levels of nonesterified free fatty acids (NEFAs) and ketone bodies did not differ systematically between the two strains under these conditions (Fig. S1C).
Fig. S1.
Generation and characterization of Angptl3−/− mice. (A) Angptl3−/− mice were generated by homologous recombination using VelociGene as described in SI Materials and Methods. The targeting vector replaced exons 1–8 with a LacZ-Hyg cassette. (B) Plasma concentration of ANGPTL3 in Angptl3−/− mice and WT littermates fed ad libitum (Left). Blood was collected at 7:00 AM and circulating ANGPTL3 levels were measured by ELISA. Plasma concentrations of ANGPTL3 measured by ELISA in pooled samples from male C57BL/6 WT mice (n = 5) during fasting and refeeding (Right). (C) Plasma lipid levels in Angptl3−/− mice and WT littermates during fasting and refeeding (n = 5 female mice per group, 8–9 wk). Mice were fasted for 12 h (7:00 AM to 7:00 PM) and refed for 12 h (7:00 PM to 7:00 AM). Blood was collected at the end of fasting (7:00 PM) or refeeding (7:00 AM). All experiments were repeated with similar results. Data are expressed as means ± SEM. *P < 0.05, **P < 0.01.
VLDL-TG Uptake by WAT Is Disrupted in Fed Angptl3−/− Mice.
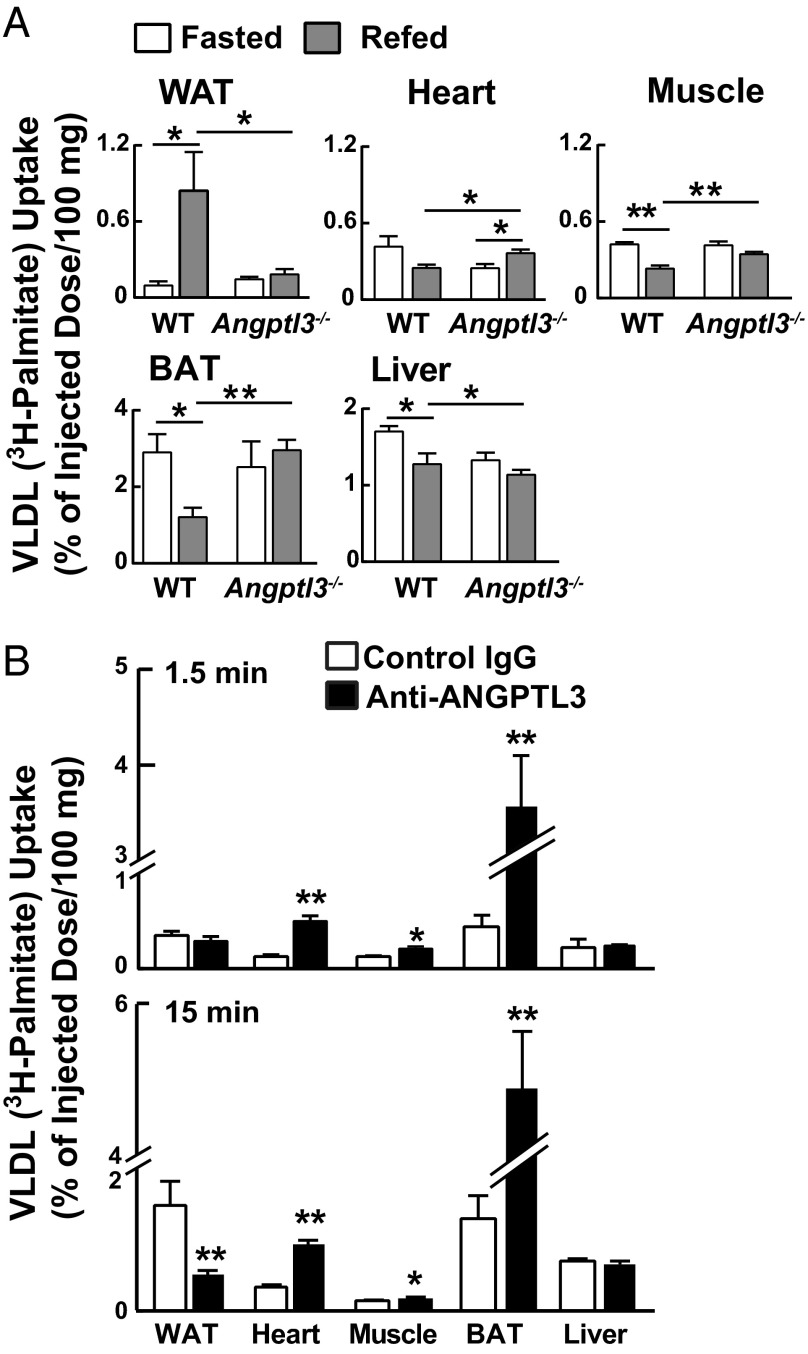
To determine whether ANGPTL3 plays a role in the trafficking of circulating VLDL-TG, we compared the uptake of i.v. administered VLDL-[3H]palmitate by tissues of WT and KO mice. In pilot experiments, both lines cleared more than 90% of the label from plasma within 15 min. Therefore, we collected tissues 15 min after VLDL-[3H]palmitate administration. After a fast, uptake of label was similar in WT and KO mice in all tissues (expressed as a percent of injected dose per 100 mg tissue) (Fig. 1A), but striking differences were elicited by refeeding. In WT mice, refeeding increased VLDL-[3H]palmitate uptake eightfold in WAT and decreased uptake by muscle and BAT by >50%. VLDL-[3H]palmitate uptake by heart also tended to be reduced by feeding in WT animals, but the decrease did not reach statistical significance. These responses were largely abolished in the KO mice. VLDL-TG uptake by WAT, muscle, and BAT was unchanged by feeding, and uptake by heart actually increased with feeding in KO animals (Fig. 1A).
Fig. 1.
Metabolism of VLDL-[3H]palmitate in WT and Angptl3−/− mice. (A) Tissue uptake of [3H]palmitate-labeled VLDL. Labeled VLDL was prepared as described in SI Materials and Methods. A total of 130 μg of [3H]palmitate-labeled VLDL (specific activity: 1.23 dpm/ng TG) was injected into the tail vein. After 15 min, tissues were collected and counted in a scintillation counter (n = 5 females per group, 8–11 wk). Experiments were repeated at least twice, and the results were similar. (B) Acute effects of anti-ANGPTL3 antibody (REGN1500) treatment on VLDL-[3H]palmitate uptake. Mice were treated with REGN1500 as described in SI Materials and Methods. After 2 h, VLDL-[3H]palmitate was injected i.v. into the mice (n = 5–6 males per group, 12 wk) and tissues were collected after 1.5 (Top) or 15 min (Bottom). All experiments were repeated twice, and the results were similar. Data are expressed as means ± SEM. *P < 0.05, **P < 0.01.
These data indicate that ANGPTL3 plays an essential role in redirecting VLDL-TG from oxidative tissues to WAT in fed animals, either by promoting VLDL-TG uptake in WAT or by inhibiting uptake by oxidative tissues, thereby sparing VLDL-TG for uptake by WAT. To distinguish between these possibilities, we acutely inactivated ANGPTL3 using an anti-ANGPTL3 antibody (REGN1500) that recapitulates the hypolipidemia seen in KO mice (21, 22). Then we administered VLDL-[3H]palmitate and determined the distribution of labeled fatty acid.
Acute Inactivation of ANGPTL3 Increases VLDL-TG Uptake by Oxidative Tissues.
If ANGPTL3 directly promotes VLDL-TG uptake by WAT, then acute inactivation of circulating ANGPTL3 should decrease VLDL-[3H]palmitate uptake by WAT, followed by increased uptake by oxidative tissues. Conversely, if ANGPTL3 inhibits VLDL-TG uptake by oxidative tissues, then increased VLDL-[3H]palmitate by oxidative tissues would precede the reduction in uptake by WAT.
Mice were treated with REGN1500 for 2 h before injecting VLDL-[3H]palmitate. Uptake of label by WAT collected 1.5 min after VLDL-[3H]palmitate injection was similar in REGN1500- and control antibody-treated mice (Fig. 1B). However, even at this early time point, uptake of label into oxidative tissues was markedly increased in the REGN1500-treated animals. Thus, the primary effect of ANGPTL3 is to suppress VLDL-TG uptake by oxidative tissues. When tissues were collected after 15 min, the pattern of uptake was similar to that seen in the KO animals except that uptake into BAT was greater in the antibody-treated animals.
Uptake of VLDL-TG by tissues requires LPL to hydrolyze the TG. To determine whether ANGPTL3 controls tissue uptake of VLDL-TG by regulating LPL activity, we measured heparin-releasable LPL activity in tissues from WT and KO mice.
Inactivation of Angptl3 Increases LPL Activity in Tissues of Fed Mice.
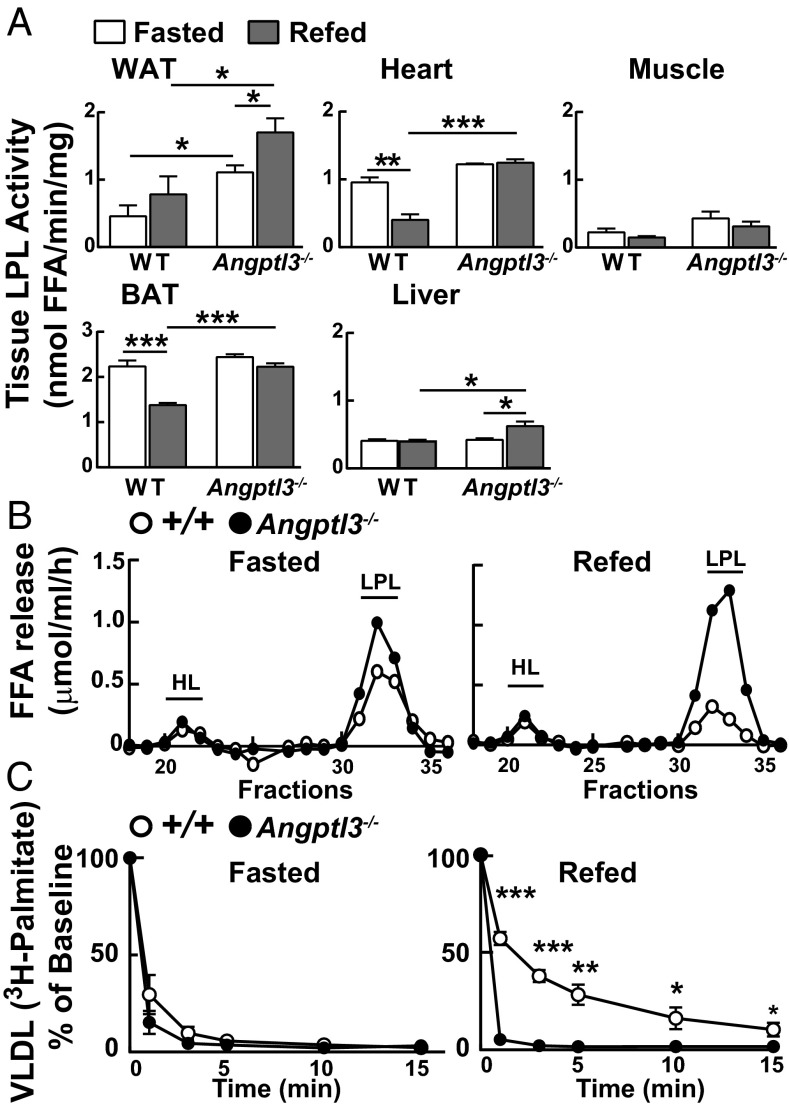
In WT mice, the most significant changes in LPL activity were in heart and BAT; in both tissues, LPL activity fell dramatically with refeeding (Fig. 2A). The postprandial reduction in LPL activity did not occur in Angptl3−/− mice. Interestingly, LPL activity increased with feeding in WAT of both KO and WT mice. Thus, the reduction in delivery of VLDL-TG to WAT after refeeding in Angptl3−/− mice (Fig. 1A) was not caused by a reduction in WAT LPL activity. These results are most consistent with the reduced delivery of postprandial lipids to WAT being caused by a failure of Angptl3−/− mice to suppress LPL activity in oxidative tissues (heart, BAT, and muscle), which have a larger aggregate mass and greater perfusion than WAT.
Fig. 2.
Lipoprotein lipase activity in WT and Angptl3−/− mice. (A) Heparin-releasable LPL activity was measured in tissues of WT and Angptl3−/− mice (n = 2 females and 2 males per group, 9–11 wk) as described in SI Materials and Methods. The experiment was repeated in males and in females, and the results were similar. FFA, free fatty acid. (B) Postheparin plasma hepatic lipase and LPL activity in fasted and refed Angptl3−/− and WT littermates (n = 4 females per group, 7–9 wk). Postheparin plasma was fractionated by heparin column, and HL and LPL activity was measured as described in SI Materials and Methods. The experiment was repeated with similar results. (C) VLDL-[3H]palmitate clearance from plasma. VLDL labeled with [3H]palmitate (25 μg VLDL-TG, specific activity: 1.9 dpm/ng TG) was prepared in donor mice as described in SI Materials and Methods and injected into fasted or refed Angptl3−/− and WT littermates (n = 5 females per group, 7–12 wk). Blood was collected at the indicated times, with time 0 set to 100%. Statistical comparisons are between KO and WT mice under the same conditions. Data are expressed as means ± SEM. *P < 0.05, **P < 0.01, ***P < 0.001.
Feeding also elicited a modest but significant increase in heparin-releasable TG lipase activity in livers of KO mice that was not apparent in WT mice. The molecular basis of this increase in TG hydrolase activity is unclear.
These findings have implications for whole-body LPL activity and VLDL-TG metabolism. Studies in adipose tissue-specific knockout mice indicate that most LPL activity is located in oxidative tissues (23). Therefore, total LPL activity should be decreased by feeding in WT animals but unchanged or increased in Angptl3−/− animals. Moreover, if ANGPTL3 acts to suppress LPL activity and decrease VLDL-TG uptake in oxidative tissues of fed animals, then the clearance of circulating VLDL-TG should be reduced by feeding in WT but not in KO animals. To test these hypotheses, we measured postheparin plasma LPL activity and VLDL-TG clearance in WT and KO mice.
Feeding Decreases LPL Activity and VLDL-TG Clearance in WT but Not KO Mice.
Postheparin plasma LPL activity fell with refeeding in WT mice but increased in KO animals (Fig. 2B). Hepatic lipase (HL) activity was not increased in KO animals. Consistent with these findings, feeding decreased the clearance of VLDL-TG in WT mice but increased clearance in KO mice (Fig. 2C, Right) such that more than 95% of the tracer was cleared from the circulation within 1 min in KO animals, whereas less than 50% of the tracer was removed from the circulation in 1 min in fed WT animals.
How does the reduced uptake of TG into WAT after refeeding affect the distribution of TG in tissues of Angptl3−/− mice?
Tissue Distribution and Accumulation of TG Are Preserved in Angptl3−/− Mice.
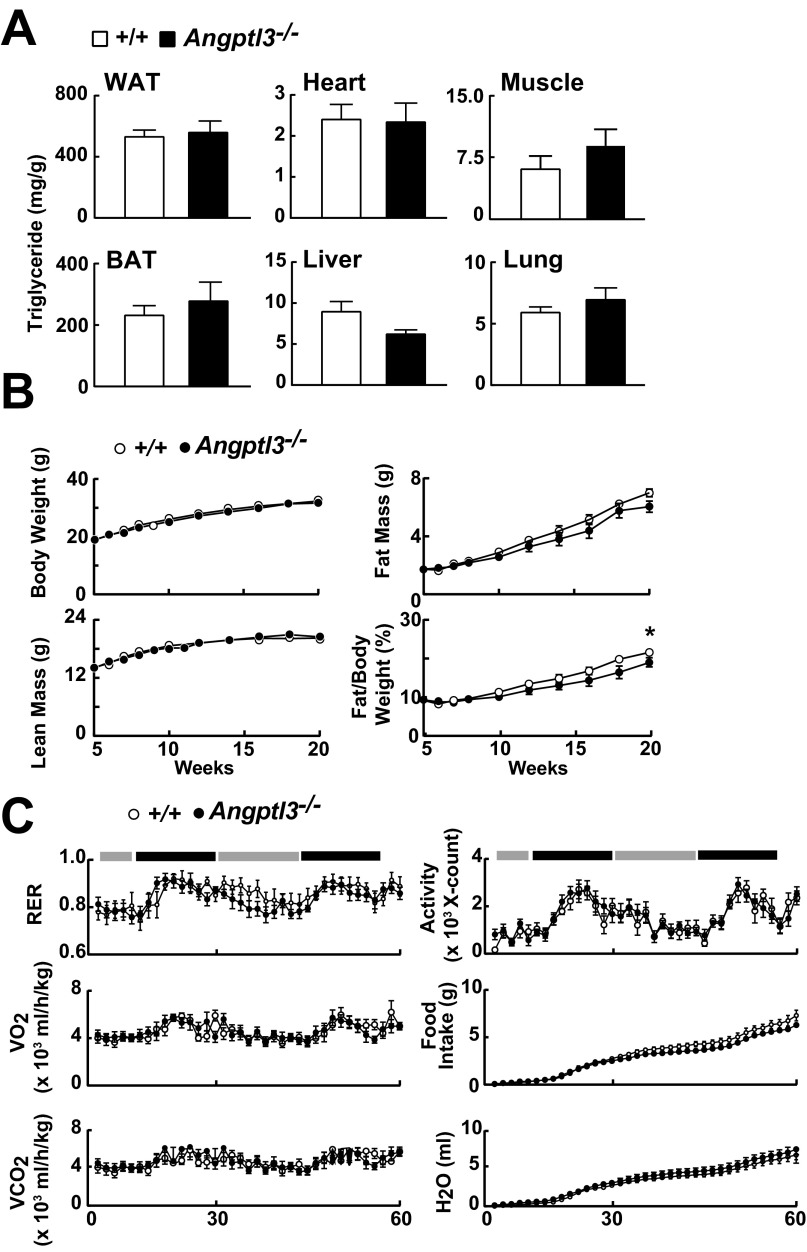
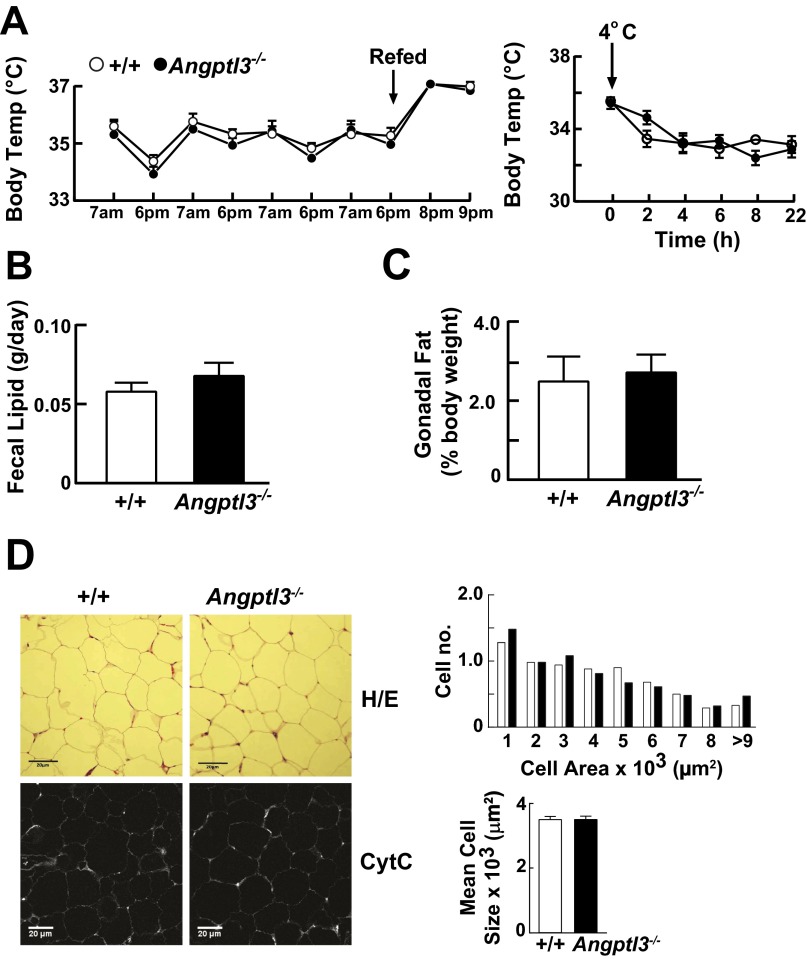
Despite marked differences in disposition of VLDL-TG among tissues in Angptl3−/− and WT mice, the TG content of tissues (Fig. S2A) and growth rates (Fig. S2B) were similar in the two groups of mice. Metabolic studies revealed no significant differences between KO and WT mice in respiratory exchange ratio (RER), oxygen uptake (VO2), CO2 production (VCO2), activity levels, food/water intake (Fig. S2C), body temperature (Fig. S3A), or fecal fat content (Fig. S3B). Moreover, the appearance and size of the gonadal adipocytes was similar in the two strains (Fig. S3 C and D). These data imply that the Angptl3−/− mice compensate for reduced postprandial delivery of TG to WAT by reducing lipolysis and/or increasing synthesis of TG. To elucidate which of these processes is responsible for maintenance of body fat, we first measured and compared the rate of lipolysis in WAT of WT and Angptl3−/− mice.
Fig. S2.
Tissue TG content, growth curves, body composition, and indirect calorimetry in Angptl3−/− mice and WT littermates. (A) Tissue TG levels in Angptl3−/− mice and WT littermates during refeeding (n = 5 per male mice group, 6–9 wk). Tissue TG was extracted and measured as described in Materials and Methods. Experiments were repeated once and the results were similar. (B) Body weight and body composition of Angptl3−/− mice and WT littermates (n = 17 N6 male mice per group). (C) Metabolic cage studies of Angptl3−/− mice and WT littermates (n = 7 female mice per group, 7–9 wk). The metabolic rate of each mouse was measured by indirect calorimetry as described in SI Materials and Methods. Data are expressed as means ± SEM. *P < 0.05.
Fig. S3.
Body temperature in Angptl3−/− mice and WT littermates. (A) Body temperatures of Angptl3−/− mice and WT littermates (n = 6–8 male N6 C57BL/6 mice per group, 10–13 wk) during fasting and refeeding (Left). One week after insertion of the probes, feeding was synchronized for 3 d (fasting: 6:00 PM to 7:00 AM; refeeding: 7:00 AM to 6:00 PM), and temperatures were recorded at the end of each fasting and refeeding period. On day 4, mice were refed at 6:00 PM and their temperatures were measured at 8:00 PM and 9:00 PM. Body temperatures were also measured after exposure to the cold (Right). One week after insertion of the probes, mice were placed in a 4 °C cold room at 9:00 AM and provided free access to food and water. Temperatures were recorded at the times indicated. (B) Fecal lipid content in Angptl3−/− mice and WT littermates. Feces were collected from WT and KO mice for 3 consecutive days. Feces were dried and extracted with chloroform:methanol (2:1, vol/vol). The lipid extracts were dried under nitrogen and weighed. (C) Epididymal fat weights of WT and KO mice. Feeding was synchronized for 3 d (5:00 PM to 7:00 AM fasting; 7:00 AM to 5:00 PM refeeding) in WT and KO male mice (n = 5 per group, 25–28 wk). On day 4, the mice were killed 4 h after refeeding. Epididymal WAT samples were collected and weighed. (D) Adipose tissue was subjected to H&E staining and immunostained for Cytochrome C (CytC) (Cell Signaling). Fluorescent images for CytC were captured using a confocal microscope (Leica) and the sizes of the adipocytes were measured with ImageJ (NIH); the means ± SE are provided. The experiments were repeated and the results were similar.
Suppression of Adipose Tissue Lipolysis Is Impaired in Fed Angptl3−/− Mice.
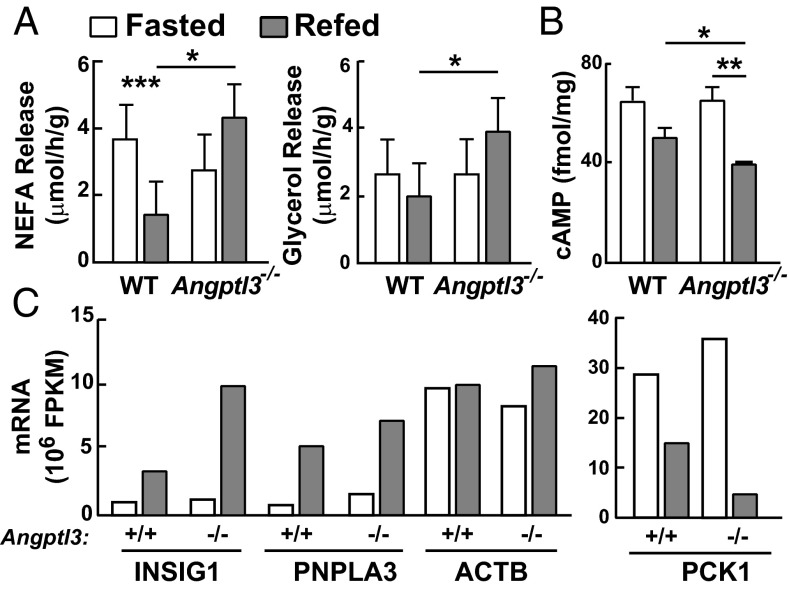
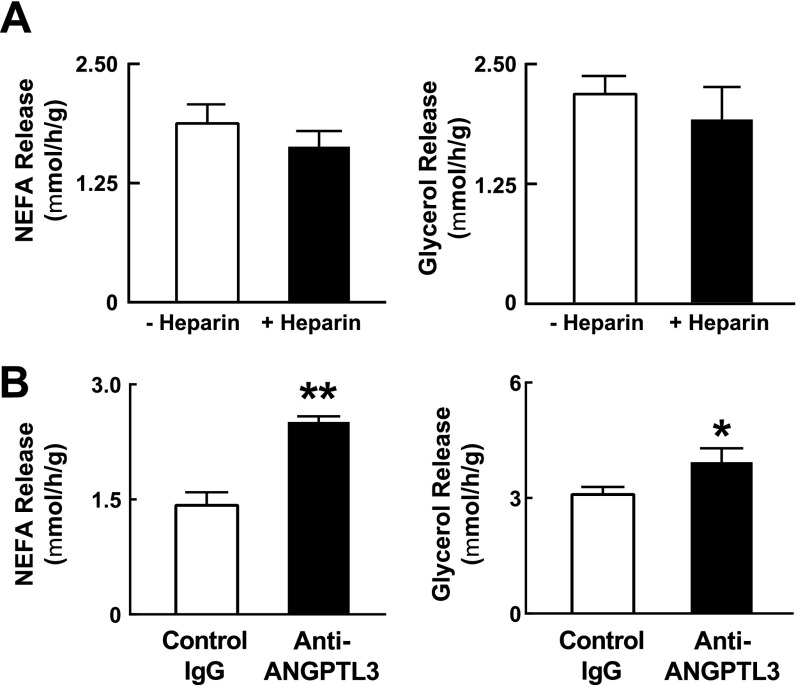
Lipolysis was assessed by measuring release of NEFA and glycerol from explants of WAT (Fig. 3A), which were similar in fasting WT and KO mice. Feeding reduced NEFA release by 60% in WT explants, but failed to suppress NEFA release in those from KO animals. Postprandial glycerol release was significantly higher in the WAT from KO mice compared with WT mice. These differences in lipolysis were not affected by i.v. infusion of heparin (Fig. S4A), and were apparent within 2 h following administration of an anti-ANGPTL3 antibody to fed WT mice (Fig. S4B). These data are not compatible with the hypothesis that Angptl3−/− mice compensate for reduced postprandial delivery of TG to WAT by reducing lipolysis.
Fig. 3.
ANGPTL3 suppresses release of FFA from WAT during refeeding. Mice were placed on a synchronized feeding regimen for 3 d before each experiment. (A) Lipolysis in WAT of Angptl3−/− mice during fasting and refeeding. On day 4, WAT was collected at the end of the fasting cycle or 4 h after refeeding (n = 5 N6 C57BL/6J female mice per group, 27–30 wk). Nonesterified free fatty acid and glycerol release were calculated as described in SI Materials and Methods. (B) cAMP levels in WAT of Angptl3−/− and WT mice. Cyclic AMP levels in WAT were measured using an ELISA kit as described in SI Materials and Methods (n = 4–5 N6 C57BL/6J females per group, 23–27 wk). (C) Messenger RNA levels in WAT of Angptl3−/− and WT littermates. WAT was collected at the end of the fasting or refeeding cycle. Samples were pooled from each group (n = 5 male mice per group, 6–9 wk), and mRNA levels were determined by RNA sequencing as described in Materials and Methods. All experiments were repeated twice with similar results. Data are expressed as means ± SEM. *P < 0.05, **P < 0.01, ***P < 0.001.
Fig. S4.
NEFA and glycerol release from WAT explants. (A) The release of NEFA and glycerol from WAT explants of fed WT mice was determined 15 min after i.p. injection of saline or saline plus heparin (1 U/g). (B) NEFA and glycerol release from WAT explants of WT mice treated with anti-ANGPTL3 antibody or control IgG as described in SI Materials and Methods. Data are expressed as means ± SEM. *P < 0.05, **P < 0.01.
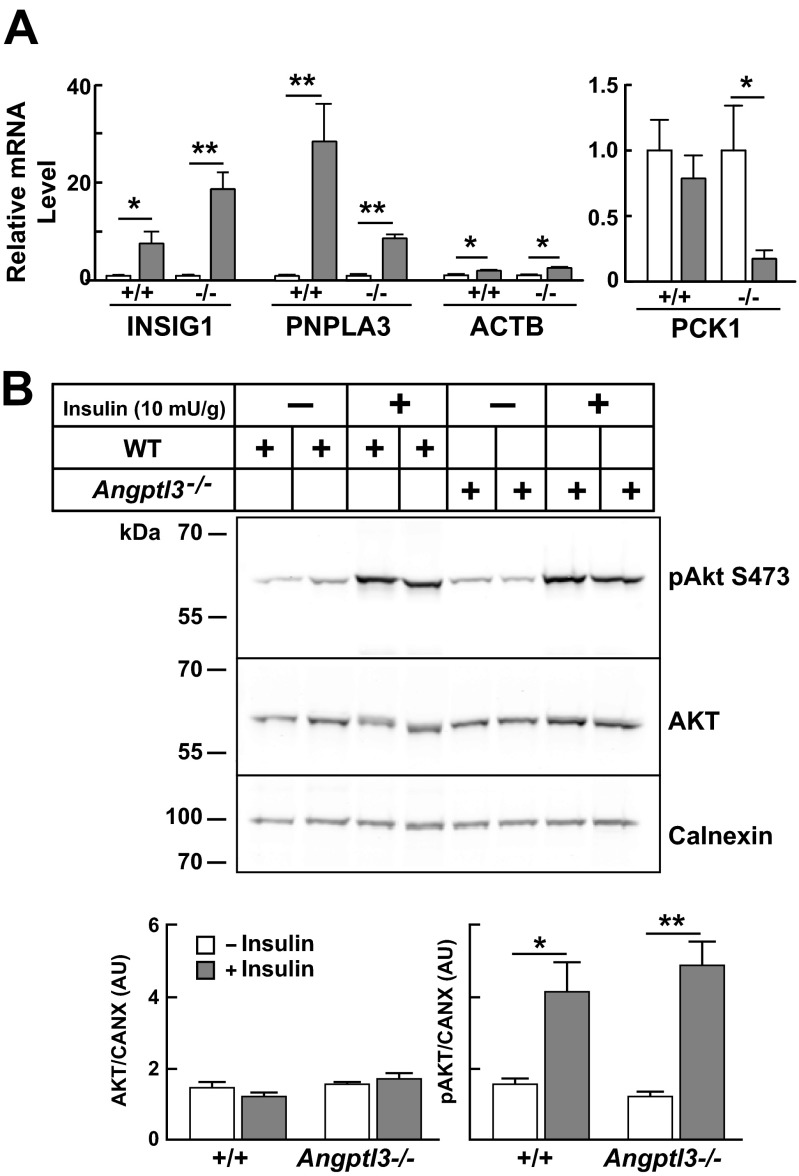
The failure to inhibit lipolysis in the WAT of Angptl3−/− mice was not caused by impaired insulin signaling. Levels of cAMP (Fig. 3B) and the mRNAs encoding three canonical insulin-responsive genes (Insig1, Pnpla3, Pck1) (24–26) were similar in WAT explants from WT and KO mice (Fig. 3C and Fig. S5A), indicating that insulin-mediated responses to feeding were preserved in the KO animals. Moreover, the level of AKT phosphorylation in response to insulin in WAT was similar in WT and KO mice (Fig. S5B). Thus, feeding-induced suppression of lipolysis was selectively impaired in the KO animals.
Fig. S5.
Insulin signaling in WAT of Angptl3−/− and WT mice. (A) Messenger RNA levels in WAT of Angptl3−/− and WT littermates (n = 5 male mice per group, aged 7–9 wk) that had their feeding synchronized for 3 d. WAT was collected at the end of the fasting or refeeding cycle, and the levels of mRNA were quantified by real-time PCR and normalized as described in Materials and Methods. The values are means ± SE. (B) Insulin-stimulated phosphorylation of AKT in WAT of WT and Angptl3−/− mice. Male WT and KO mice (n = 5 per group) were fasted for 16 h and then given insulin (10 mU/g body weight) or saline by i.p. injection. Mice were killed after 10 min and epididymal fad pads were excised and subjected to immunoblot analysis as described in SI Materials and Methods. Immunoblot analysis from two representative mice is shown (Top). Total and pAKT-S473 levels were quantified using LI-COR Odyssey Imaging System version 3.0, and data are reported as means ± SE of AKT standardized to the levels of calnexin (CANX). *P < 0.01, **P < 0.001 relative to WT mice.
Altered Fatty Acid Composition of WAT-TG in Angptl3−/− Mice.
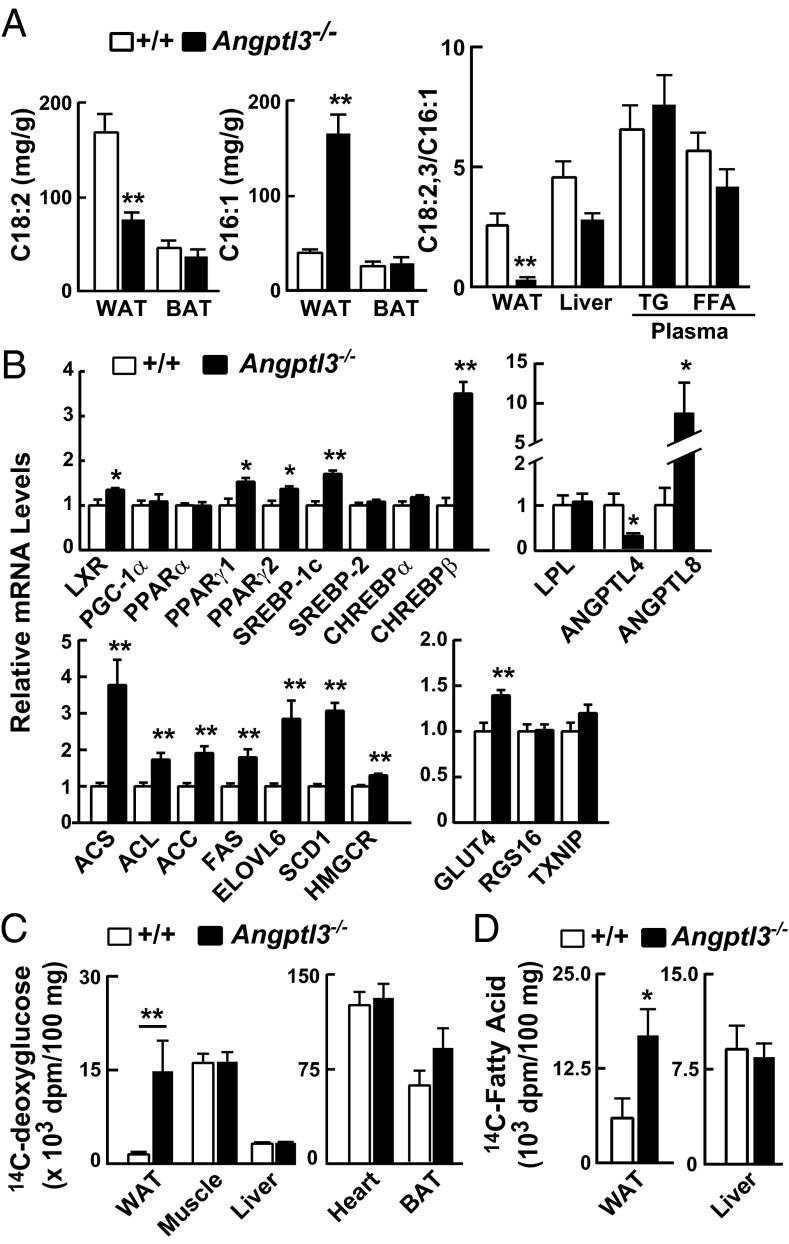
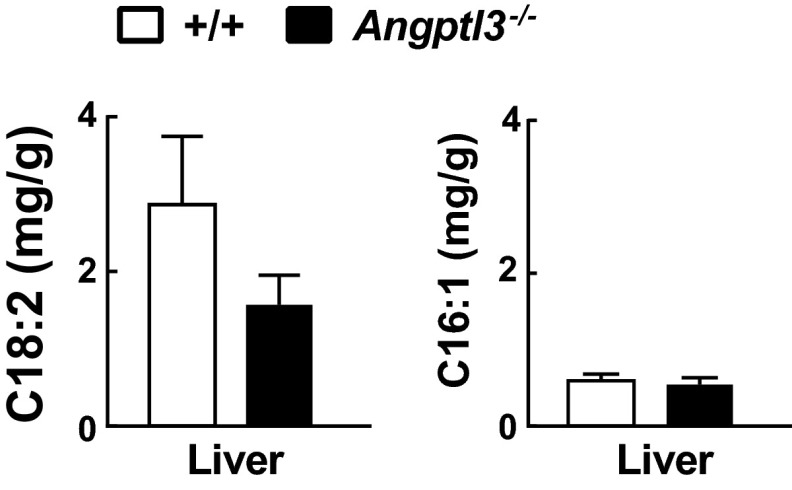
To determine whether endogenous NEFA synthesis compensates for the reduced VLDL-TG delivery to WAT, we compared the levels of linoleic acid (C18:2), which is entirely diet-derived, and palmitoleic acid (C16:1), which is obtained from endogenous synthesis, in tissue TGs of WT and KO mice. Linoleic acid was reduced by 66% and palmitoleic acid was increased 4.2-fold in WAT of KO mice (Fig. 4A). The levels of these fatty acids were not altered in BAT (Fig. 4A) or liver (Fig. S6) of KO mice, which is consistent with the finding that VLDL-[3H]palmitate uptake was preserved in these tissues (Fig. 1A). The ratio of exogenous (C18:2, C18:3) to endogenous (C16:1) fatty acids was dramatically reduced in the WAT of KO mice compared with WT mice but not in the liver, plasma, or circulating free fatty acids (Fig. 4A, Right). These data suggested that WAT mass is maintained in Angptl3−/− mice by increased endogenous synthesis of fatty acids and that the changes are not secondary to alterations in circulating lipid levels.
Fig. 4.
Fatty acid composition, mRNA levels, [14C]2-deoxy-d-glucose uptake, and fatty acid synthesis in Angptl3−/− and WT mice. Mice were placed on a synchronized feeding regimen for 3 d before each experiment. (A) Fatty acid composition in WAT and BAT (Left) and ratios of diet-derived (C18:2+C18:3) to endogenously synthesized (C16:1) fatty acids in WAT, liver, and plasma (Right) of Angptl3−/− and WT mice at refeeding (n = 5 male mice per group, 6–9 wk). Fatty acids were assayed by GC as described in SI Materials and Methods. (B) Messenger RNA levels in WAT of Angptl3−/− and WT mice at refeeding. Mice (n = 6 N6 C57BL6/6J male mice per group, 23–26 wk) were refed for 4 h, and WAT samples were collected. mRNA levels were measured using real-time PCR (Table S1). Cyclophilin was used as internal control, and mean values in control mice were set to 1. (C) [14C]Deoxyglucose uptake in Angptl3−/− and WT littermates during fasting and refeeding. A total of 2 μCi was injected into the tail vein of each mouse [n = 5 female mice matched for age and body weight (BW) per group, 7–14 wk]. Tissues were collected 1 h after injection and processed as described in SI Materials and Methods. (D) Incorporation of [14C]glucose into fatty acids in WAT and liver. Fatty acid synthesis was measured in Angptl3−/− and WT littermates using [U-14C]glucose as described in SI Materials and Methods. 14C incorporation into fatty acids was quantified and normalized to tissue weight. All experiments were repeated at least once, with similar results. Data are expressed as means ± SEM. *P < 0.05, **P < 0.01.
Fig. S6.
Fatty acid composition of the liver in Angptl3−/− mice and WT littermates. Linoleic acid (C18:2) and palmitoleic acid (C16:1) levels in livers of Angptl3−/− mice and WT littermates. Livers were collected from the same mice used in Fig. 5A, and fatty acid composition was analyzed as described in Materials and Methods. Data are expressed as means ± SEM.
Expression of Fatty Acid Biosynthetic Genes Is Increased in WAT of Angptl3−/− Mice.
To assess the mechanism and site of increased fatty acid synthesis in Angptl3−/− mice, we used RT-PCR (Table S1) to assay the levels of mRNAs encoding proteins that mediate de novo lipogenesis. Levels of mRNAs encoding key enzymes that catalyze fatty acid synthesis, and of SREBP-1c, the transcription factor that coordinates expression of these enzymes (27), were elevated in WAT from Angptl3−/− mice (Fig. 4B). Transcriptional regulation of de novo lipogenesis is also mediated by the carbohydrate-responsive transcription factor ChREBP (28), which is expressed in two forms (ChREBPα and ChREBPβ) in adipose tissue (29). Expression of ChREBPα and two of its target genes, Rgs16 and Txnip, was not increased in KO animals (Fig. 4B). Expression of ChREBPβ was increased 3.5-fold in WAT of KO animals. Messenger RNA levels of Glut4, which mediates insulin-stimulated uptake of glucose by adipose tissue and induces transcription of Chrebpβ (29), were also higher in KO animals. The increased levels of mRNAs encoding ChREBPβ and GLUT4 are consistent with an increase in GLUT4 activity and hence an increase in insulin-stimulated glucose uptake into the WAT of KO mice. This glucose could potentially furnish the carbon and energy required for de novo lipogenesis.
Table S1.
Oligonucleotides used for RT-PCR
| Gene | Forward primer, 5′-3′ | Reverse primer, 5′-3′ |
| LXR | TCTGGAGACGTCACGGAGGTA | CCCGGTTGTAACTGAAGTCCTT |
| PGC1α | AACCACACCCACAGGATCAGA | TCTTCGCTTTATTGCTCCATGA |
| PPARα | ACAAGGCCTCAGGGTACCA | GCCGAAAGAAGCCCTTACAG |
| PPARγ | CACAATGCCATCAGGTTTGG | GCTGGTCGATATCACTGGAGATC |
| SREBP-1c | GGAGCCATGGATTGCACATT | GGCCCGGGAAGTCACTGT |
| SREBP-2 | GCGTTCTGGAGACCATGGA | ACAAAGTTGCTCTGAAAACAAATCA |
| CHREBPα | CGACACTCACCCACCTCTTC | TTGTTCAGCCGGATCTTGTC |
| CHREBPβ | TCTGCAGATCGCGTGGAG | CTTGTCCCGGCATAGCAAC |
| ACC | TGGACAGACTGATCGCAGAGAAAG | TGGAGAGCCCCACACACA |
| ACS | GCTGCCGACGGGATCAG | TCCAGACACATTGAGCATGTCAT |
| ACL | GCCAGCGGGAGCACATC | CTTTGCAGGTGCCACTTCATC |
| FAS | GCTGCGGAAACTTCAGGAAAT | AGAGACGTGTCACTCCTGGACTT |
| ELOVL6 | TGTACGCTGCCTTTATCTTTGG | GCGGCTTCCGAAGTTCAA |
| SCD1 | CCGGAGACCCCTTAGATCGA | TAGCCTGTAAAAGATTTCTGCAAACC |
| HMGCR | CTTGTGGAATGCCTTGTGATTG | AGCCGAAGCAGCACATGAT |
| GLUT4 | CCGGCAGCCTCTGATCAT | CCGACTCGAAGATGCTGGTT |
| RGS16 | GGGCTCACCACATCTTTGAC | TTGGTCAGTTCTCGGGTCTC |
| TXNIP | TATGTACGCCCCTGAGTTCCA | GTTAAGGACGCACGGATCCA |
| LPL | ACTCTGTGTCTAACTGCCACTTCAA | ATACATTCCCGTTACCGTCCAT |
| ANGPTL3 | AGCAAGACAACAGCATAAGAGAACTC | TGAGCTGCTTTTCTATTTCTTTTATCTG |
| ANGPTL8 | ACATGGCTGTGCTTGCTCTCT | CAAATTCTTGGTGGGCTTGAC |
| L-FABP | GGTGACAACTTTCAAAGGCATAAA | TGTCGCCCAATGTCATGGTA |
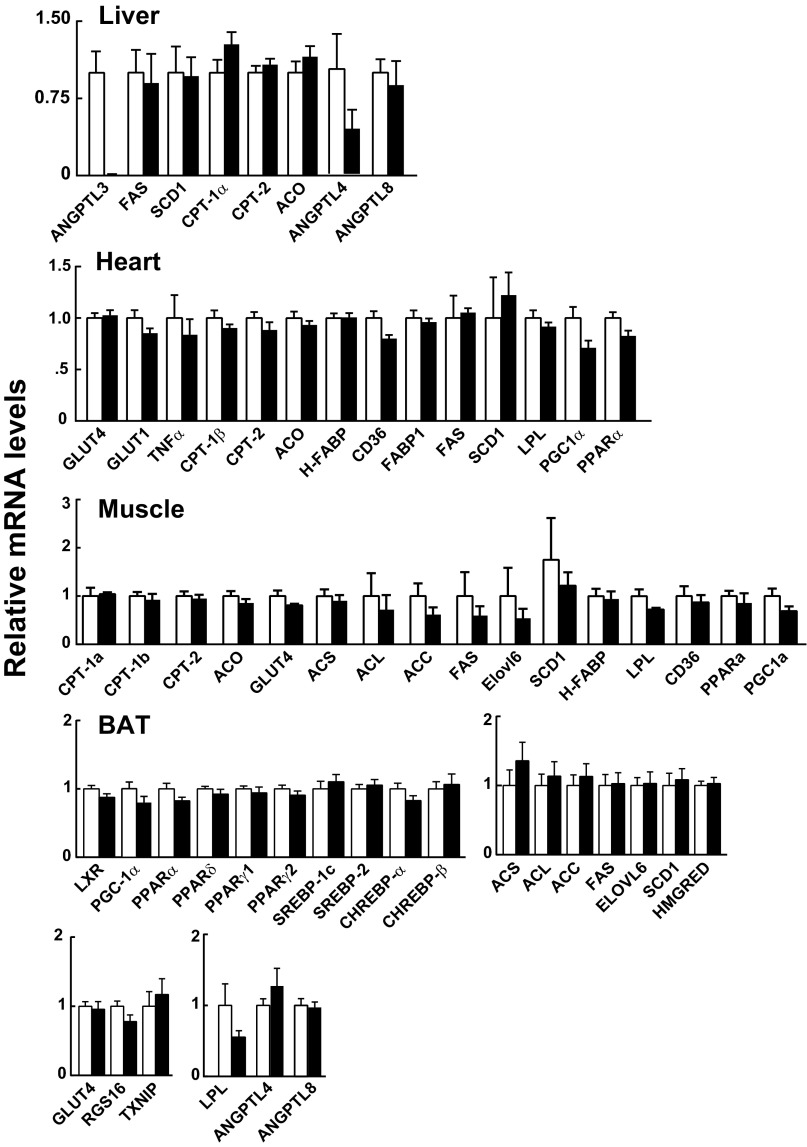
In contrast to WAT, no changes in mRNAs encoding genes involved in fatty acid metabolism were observed in the liver, heart, muscle, or BAT of Angptl3−/− mice (Fig. S7).
Fig. S7.
Messenger RNA levels in liver, heart, muscle, and BAT of Angptl3−/− mice and WT littermates during refeeding. Tissues were collected from the same mice used in Fig. 4A and analyzed by qRT-PCR as described in SI Materials and Methods. Data are expressed as means ± SEM.
Increased Uptake of Glucose and de Novo Lipogenesis in WAT of Angptl3−/− Mice.
To assess glucose uptake in Angptl3−/− mice, we used the nonmetabolizable glucose analog [14C]2-deoxy-d-glucose ([14C]deoxyglucose) (Fig. 4C). In fed mice, postprandial uptake of deoxyglucose into WAT was much greater in KO than in WT animals, whereas no differences were observed between the two strains in heart, skeletal muscle, or BAT. These data are consistent with the hypothesis that increased postprandial uptake of glucose by WAT fuels de novo lipogenesis to compensate for decreased uptake of VLDL-TG in Angptl3−/− mice.
To directly assess de novo lipogenesis from glucose, we measured incorporation of [14C]glucose into fatty acids in the WAT of WT and KO mice (30). In fed animals, lipid-soluble counts in WAT were approximately threefold higher in KO mice than in WT littermates (Fig. 4D). In contrast, incorporation of glucose into hepatic lipids did not differ between strains. These data indicate that de novo lipogenesis from glucose is specifically increased in the WAT of Angptl3−/− mice.
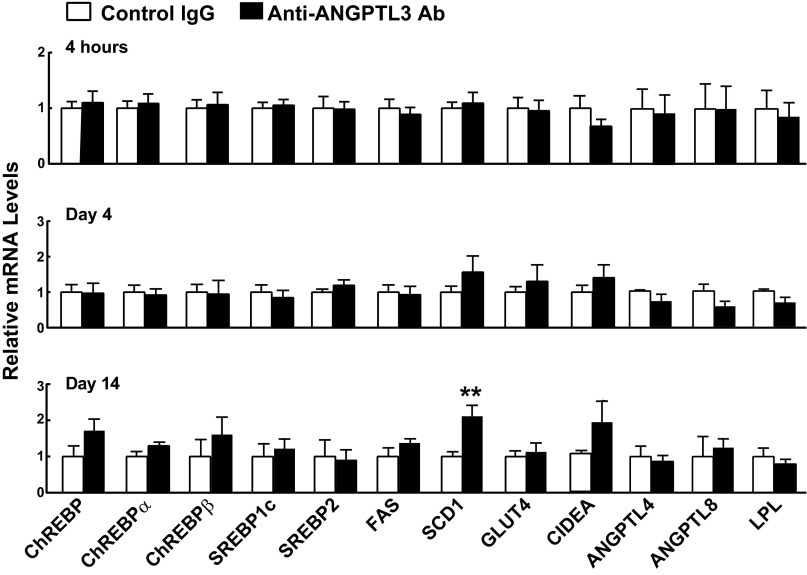
To determine whether inactivation of ANGPTL3 directly increases de novo lipogenesis, we performed a time course experiment. Although VLDL-[3H]palmitate uptake in WAT was reduced within 2 h of inactivating circulating ANGPTL3 in fed WT mice (Fig. 1B), mRNA levels of enzymes involved in fatty acid biosynthesis were unchanged until 2 wk after antibody administration, when a small increase in SCD1 was observed (Fig. S8). These data suggest that the increase in fatty acid biosynthesis in WAT is an adaptation to the chronic reduction in fatty acid uptake in Angptl3−/− mice.
Fig. S8.
Messenger RNA levels in WAT of WT mice treated with control or anti-ANGPTL3 antibodies. WT mice were treated with control IgG or anti-ANGPTL3 antibody (REGN1500) for the times indicated. Mice were entrained to a synchronized feeding regimen for 3 d before each experiment. WAT was collected and mRNA levels were analyzed by RT-PCR as described in Materials and Methods. Data are expressed as means ± SEM. **P < 0.001.
Increased Insulin Sensitivity in Angptl3−/− Mice.
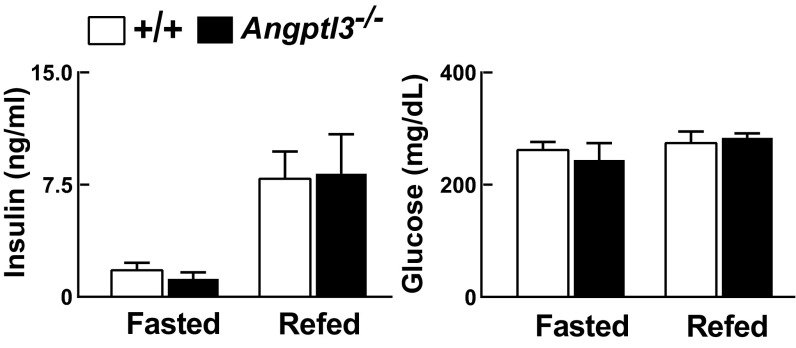
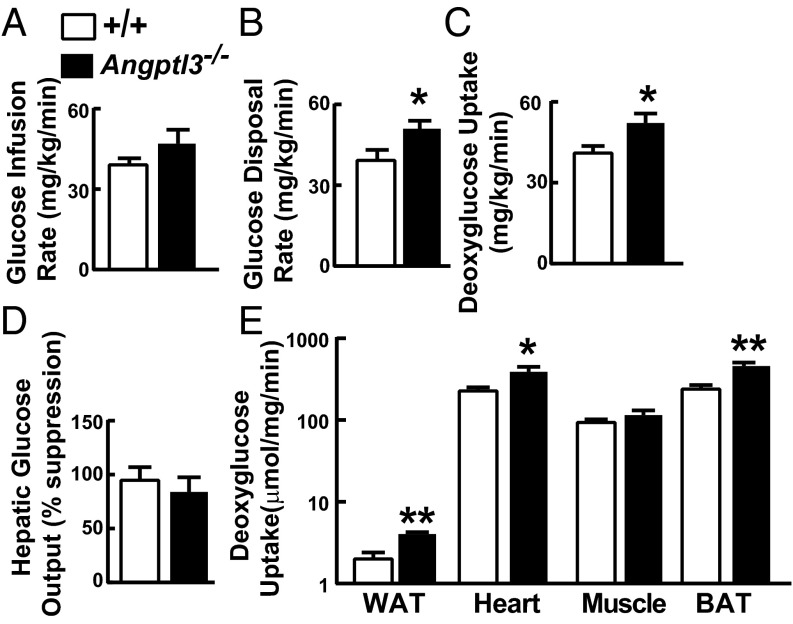
Increased de novo lipogenesis in WAT has been correlated with insulin sensitivity in rodents (31) and in humans (32, 33). To assess insulin sensitivity in Angptl3−/− mice, we performed euglycemic–hyperinsulinemic clamp studies. Plasma levels of glucose and insulin were similar in Angptl3−/− mice compared with WT animals (Fig. S9), but rates of whole-body glucose disposal (Fig. 5B) and deoxyglucose uptake (Fig. 5C) were slightly but significantly higher in KO mice. Insulin-mediated suppression of hepatic glucose output was similar in the two groups (Fig. 5D), but uptake of deoxyglucose by WAT, heart, and BAT was higher in KO animals (Fig. 5E). Thus, KO mice had increased insulin sensitivity that was specific to peripheral tissues.
Fig. S9.
Plasma insulin and glucose levels in Angptl3−/− mice and WT littermates. Mice were synchronized for 3 d. On day 4, blood was collected at the end of the fasting cycle or 4 h after refeeding (n = 5 N6 C57Bl6/J male mice per group, 22–28 wk). The experiment was repeated twice and the results were similar. Data are expressed as means ± SEM.
Fig. 5.
Euglycemic–hyperinsulinemic clamps in Angptl3−/− mice and WT littermates. Glucose infusion (A), glucose disposal (B), and whole-body deoxyglucose uptake rates (C) as well as hepatic glucose output (D) and tissue deoxyglucose uptake (E) were measured with euglycemic–hyperinsulinemic clamps as described in Materials and Methods (n = 6 male mice per group, 10–14 wk). Mean BW: WT mice, 31.9 ± 1.7 g vs. Angptl3−/− mice, 29.8 ± 1.1 g (not significant). Data are expressed as means ± SEM. *P < 0.05, **P < 0.01.
Discussion
The major finding of this study is that ANGPTL3, which is made exclusively in the liver, promotes the flux of fatty acids to WAT in fed animals to replenish TG stores that are depleted during fasting. Disruption of ANGPTL3 abolished the postprandial increase in VLDL-TG uptake by WAT and impaired the suppression of lipolysis that occurs in WAT with refeeding. Despite the failure to promote delivery and retention of TG in WAT, the mass of the tissue was almost completely preserved in the KO mice by a compensatory increase in de novo lipogenesis from glucose. Postprandial glucose uptake, expression of enzymes that catalyze fatty acid synthesis, and incorporation of 14C from glucose into lipids were markedly increased in WAT, but not liver, of Angptl3−/− mice. These data reveal that ANGPTL3 enables the liver to direct substrate trafficking and energy metabolism in peripheral tissues.
Whereas nutritional regulation of LPL activity in WAT was preserved in Angptl3−/− mice (Fig. 2A), VLDL-TG uptake into WAT was not increased by feeding in these animals (Fig. 1A). Thus, the rise in LPL activity that occurs in WAT following feeding is not mediated by ANGPTL3 and is not sufficient to redirect VLDL-TG to WAT. Rather, failure to suppress LPL activity in oxidative tissues (Fig. 2A) resulted in unabated uptake of VLDL-TG by oxidative tissues in Angptl3−/− mice (Fig. 1A), which precluded redistribution of circulating TG to WAT. These findings indicate that a major function of ANGPTL3 is to suppress LPL in oxidative tissues, and that this suppression is required to route VLDL-TG to WAT for storage in response to food intake.
How does ANGPTL3 mediate a reduction in LPL activity in oxidative tissues while sparing LPL activity in WAT? One possibility is that ANGPTL3 is only active in oxidative tissues. The observation that LPL activity in WAT was higher in Angptl3−/− mice than in WT animals in both the fasted and fed states is not consistent with this hypothesis (Fig. 2A). Thus, ANGPTL3 tonically suppresses LPL activity in WAT as well as oxidative tissues (Fig. 2B). An alternative possibility is that ANGPTL3 may act directly on adipose tissue to promote VLDL-TG uptake, but we are not aware of any data to support this notion. The finding that inactivation of ANGPTL3 did not reduce VLDL-TG uptake by WAT measured shortly (1.5 min) after VLDL administration also argues against a direct effect of ANGPTL3 on VLDL-TG uptake by this tissue (Fig. 1B). Rather, when considered together with earlier studies (9, 10, 15), our data support a model in which the relative activity of LPL in WAT and oxidative tissues reflects a balance between the systemic effects of circulating, liver-derived ANGPTL3 and ANGPTL8 and the local effects of ANGPTL4 expression in WAT (Fig. S10).
Fig. S10.
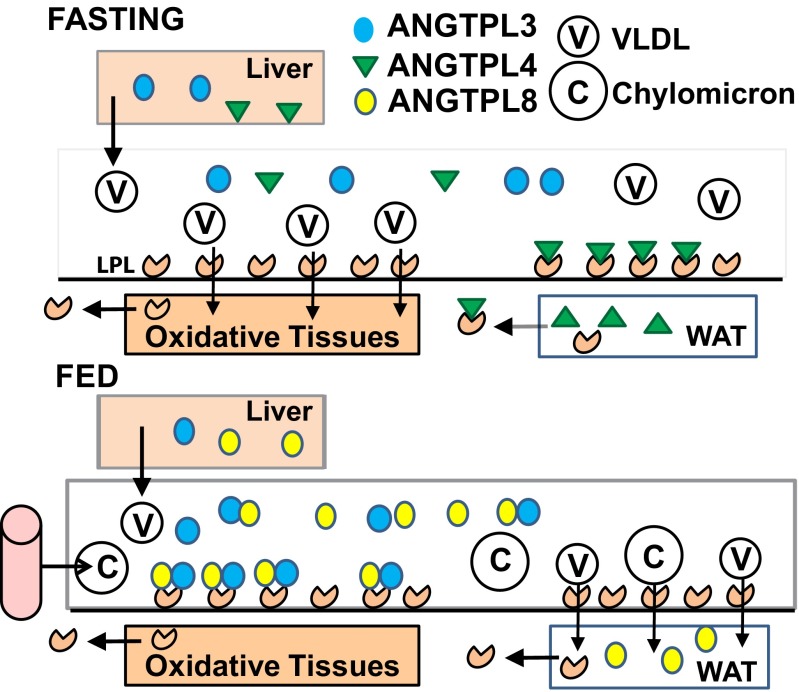
Model of ANGPTL-mediated regulation of LPL activity and TG and fatty acid metabolism in fasting and fed mice. In fasting mice, ANGPTL4 is highly expressed in WAT, where it inhibits LPL activity. ANGPTL3 is expressed in liver and secreted into the circulation, but its systemic activity is limited by the lack of ANGPTL8, which appears to be required for ANGPTL3 function. ANGPTL8 expression is virtually absent in fasting animals. The net result is that LPL activity is lower in WAT than in oxidative tissues. Consequently, circulating TGs are taken up primarily by oxidative tissues. In fed animals, ANGPTL8 expression is dramatically increased, allowing the formation of ANGPTL8–ANGPTL3 complexes that inhibit LPL activity in oxidative tissues, making VLDL-TG available for uptake by WAT. Circulating ANGPTL3 and ANGPTL8 also inhibit postprandial LPL activity in WAT, but the effect is countered by the marked decrease in ANGPTL4 expression in this tissue. Thus, the relative activity of LPL in WAT and oxidative tissues reflects a balance between the systemic effects of circulating, liver-derived ANGPTL3 and ANGPTL8 and the local effects of ANGPTL4 expression in WAT.
This model incorporates the temporal regulation and expression patterns of ANGPTL3, 4, and 8. In fasting mice, ANGPTL8, which appears to be required for ANGPTL3 function, is virtually absent (12), whereas ANGPTL4 is highly expressed in WAT, where it strongly inhibits LPL activity (34). The net result is that LPL activity is lower in WAT than in oxidative tissues. These patterns are reversed by refeeding: Circulating levels of ANGPTL3 (Fig. S1B) and ANGPTL8 (12–14) are both increased, thus reducing LPL activity in oxidative tissues. As a consequence, VLDL-TG is available for uptake by WAT. Circulating ANGPTL3 and ANGPTL8 also inhibit postprandial LPL activity in WAT, but the effect is countered by the marked decrease in ANGPTL4 expression that occurs with refeeding in this tissue (5).
The compensatory increases in glucose uptake and expression of fatty acid biosynthetic enzymes that preserve WAT mass in Angptl3−/− mice (Fig. 4) were also observed in mice in which VLDL-TGs were diverted away from WAT by overexpressing LPL in skeletal muscle (35) or by extinguishing expression of SCAP in the liver (36). These findings imply a robust homeostat that calibrates fatty acid uptake, synthesis, and release in WAT to maintain a specific TG content. The signal(s) that prompts increased glucose uptake and fatty acid synthesis in WAT in response to decreased availability of VLDL-TG–derived fatty acids is not known. Messenger RNA levels of SREBP-1c were increased in WAT from Angptl3−/− mice (Fig. 4B), but whether this increase is due to increased insulin action or to other factors, such as the reduced uptake of polyunsaturated fatty acids, which suppress SREBP-1c expression (37), is not known. ChREBPβ, an isoform of ChREBP that is highly regulated in adipose tissue in response to carbohydrates (29), also was increased in the fat of Angptl3−/− mice, but mRNA levels of the putative ChREBP-specific target genes Rgs16 and Txnip (29) were not elevated. Therefore, the role of ChREBPβ in the maintenance of WAT TG stores remains to be determined.
The preservation of WAT in Angptl3−/− mice indicates that animals with adequate caloric intake are remarkably robust to chronic disruption of the normal partitioning of glucose and fatty acids between adipose and oxidative tissues. Whereas the WAT in KO mice compensates for reduced fatty acid uptake by increasing glucose uptake and de novo lipogenesis, we do not know how the oxidative tissues accommodate to the increased influx of fatty acids from VLDL-TG. Presumably the excess fatty acids are oxidized, because TG did not accumulate in these tissues, but further studies will be required to elucidate the mechanisms by which energy balance is maintained in Angptl3−/− mice.
De novo lipogenesis in WAT has been correlated with insulin sensitivity in rodents (31). Therefore, increased de novo lipogenesis in WAT may contribute to the improved insulin sensitivity associated with ANGPTL3 deficiency (38). The favorable metabolic effects associated with ANGPTL3 deficiency in mice are also observed in humans: Loss-of-function mutations in ANGPTL3 are associated with reductions in TG (39) and LDL-C (40) and improved insulin sensitivity (38), with no apparent adverse sequelae. These findings indicate that inactivation of ANGPTL3 is associated with favorable effects on glucose and lipid metabolism, and make ANGPTL3 an attractive therapeutic target for inactivation in humans.
Materials and Methods
Reagents and Mice.
Angptl3−/− mice were generated by homologous recombination (SI Materials and Methods) and backcrossed with C57BL/6J mice to produce N6 mice. Experiments in which these mice were used are indicated in the figure legends. All protocols were approved by the Institutional Animal Care and Use Committee (IACUC) of the University of Texas Southwestern Medical Center. Reagents were obtained from Sigma unless otherwise stated.
Clearance and Uptake of Tritiated Palmitate-VLDL.
[3H]Palmitate-labeled VLDL was generated in donor mice and injected into the tail veins of WT and KO mice as described in SI Materials and Methods.
In Vitro LPL Assay in Postheparin Plasma and Tissues.
Postheparin plasma and tissue heparin-releasable LPL activity was measured as described in SI Materials and Methods. All data for WAT in this paper were obtained from gonadal fat.
Cyclic Adenosine Monophosphate Assay.
cAMP levels were measured using a commercial ELISA kit (Enzo Life Sciences) as described by the manufacturer.
Whole-Transcriptome Sequencing.
Liver or WAT total RNA was prepared and subjected to RNA sequencing exactly as described (15). Transcript levels were expressed as fragments per kilobase per million fragments mapped (FPKMs).
Triglyceride-FA Analysis.
Lipids were extracted (41) and separated by TLC (40:10:1 hexane:diethyl ether:acetic acid). Fatty acids from the TG fraction were methyl-esterified and separated by gas/liquid chromatography (GLC) using a Hewlett Packard 6890 Series GC system as described in SI Materials and Methods.
[14C]Deoxyglucose Uptake.
Mouse food intake was synchronized for 3 d, and 2 μCi of 2-[1-14C]deoxy-d-glucose (PerkinElmer) was injected via the tail vein. Sixty minutes after injection, mice were killed and perfused with 10 mL of cold saline before tissue collection. Tissues were solubilized with SOLVABLE solution (PerkinElmer) and subjected to scintillation counting (42).
Euglycemic–Hyperinsulinemic Clamps.
Euglycemic–hyperinsulinemic clamps were performed on conscious unrestrained mice as described previously (43). Hyperinsulinemia was initiated by a primed continuous infusion of insulin (3 mU⋅kg−1⋅min−1), and euglycemia was maintained by variable infusion of 50% dextrose (wt/vol). Briefly, [3H]glucose kinetics were evaluated via a primed (1-μCi) continuous infusion (0.05 μCi/min) of glucose 90 min before initiating hyperinsulinemia and maintained throughout the clamp. Following 2-h clamps, [14C]2-deoxyglucose uptake (13 μCi bolus, i.v.) was evaluated in the clamped state.
Statistics.
Data are expressed as means ± SEM. Mean values were compared using unpaired t tests implemented in GraphPad Prism.
SI Materials and Methods
Reagents and Mice.
Angptl3−/− mice were generated by homologous recombination using VelociGene (ID VG1425) as described (12). The targeting vector replaced exons 1–8 with a LacZ-Hyg cassette (Fig. S1). Genotypes were assayed using PCR. The WT allele was amplified with the following primers: sense 5′-GCCATTGATCTAACTCAACATG-3′ and antisense 5′-TTGATTTCATTGGTTCGAAGTG-3′. The KO allele was detected using the same sense primer and an antisense primer recognizing LacZ: 5′-GTCTGTCCTAGCTTCCTCACTG-3′. All mice were on a mixed background (25% 129/Sv and 75% C57BL/6J). F1 heterozygous mice were bred together to generate WT and KO mice, which were used for all experiments unless otherwise indicated. The KO mice were also backcrossed with C57BL/6J mice to produce N6 mice. Experiments in which these mice were used are indicated in the figure legends. All research protocols involving mice were reviewed and approved by the IACUC of the University of Texas Southwestern Medical Center. All mice were housed in a controlled environment (12-h light/12-h dark daily cycle, 23 ± 1 °C, 60–70% humidity), and fed ad libitum with standard chow diet (Harlan Teklad).
For fasting and refeeding experiments, Angptl3−/− mice were synchronized for 3 d. The mice were fasted during the day (7:00 AM to 7:00 PM) and fed during the dark cycle at night (7:00 PM to 7:00 AM), unless otherwise indicated. At the end of 3 d of training, experiments were performed at either 7:00 PM (fasted group) or 7:00 AM (refed group). In some experiments, the mice were killed 4 h after refeeding.
Blood Lipid and Ketone Assays.
Blood was collected in EDTA tubes and plasma was obtained by centrifugation at 2,000 × g for 10 min at 4 °C. Plasma levels of TG and cholesterol were measured using the Vitros 250 System (GMI). NEFA levels were measured using the HR Series NEFA-HR Kit (Wako), and ANGPTL3 protein levels were measured using a commercial ELISA kit (Adipogen; AG-45A-0015), as described. Ketones were assayed by an enzymatic method (Wako Autokit Total Ketone Bodies).
Clearance and Uptake of Tritiated Palmitate-VLDL.
Mice were placed on a synchronized feeding regimen for 3 d before the experiments. The [3H]palmitate-labeled VLDL was generated in donor mice 1 d before the experiments. Donor mice were injected with [3H]palmitate (0.1 mCi) via the tail vein and exsanguinated 25 min later. The [3H]palmitate-labeled VLDL was isolated from the plasma by ultracentrifugation (ρ = 1.006, 200,000 × g for 12 h) and injected into the tail veins of recipient mice at the end of fasting (7:00 PM) or refeeding (7:00 AM). Blood was drawn at the indicated times. After 15 min, the animals were killed and tissues were collected and weighed. Radioactivity in the samples was quantified by scintillation counting.
REGN1500, a fully human monoclonal antibody, was derived using Regeneron’s VelocImmune technology platform (21). An isotype-matched antibody with irrelevant specificity was used as control. For antibody treatment, mice were synchronized for 3 d with nighttime fasting (5:00 PM to 7:00 AM) and daytime refeeding (7:00 AM to 5:00 PM). On day 4, mice were refed at 7:00 AM and injected with either REGN1500 or control antibody (10 mg/kg) at 9:00 AM, and VLDL uptake, blood lipid level, and tissue LPL activity assays were performed at 11:00 AM as described above. For VLDL uptake experiments, tissues were collected 15 or 1.5 min after VLDL injection and subjected to scintillation counting.
In Vitro LPL Assay in Postheparin Plasma and Tissues.
Mice were entrained for 3 d and then injected with heparin (1 U/g) intraperitoneally. Blood was collected 15 min after the injection. Plasma was isolated and snap-frozen in liquid nitrogen. A total of 500 μL of pooled plasma from each group of mice was fractionated on a heparin column (1 mL) (GE Healthcare) to separate HL and LPL. Triglyceride lipase activity in each fraction was analyzed using a glycerol-stabilized emulsion composed of 9,10-[3H]triolein, triolein, and phosphatidylcholine. LPL activity was measured in fresh tissues collected from fasted and refed mice after food intake was synchronized for 3 d. A total of 50 mg of tissue was minced in 1 mL of cold Opti-MEM (no phenol) with fatty acid-free BSA (2%) and heparin (2 U/mL). The tissues were rotated at 37 °C for 30 min and then centrifuged at 14,000 × g for 5 min. Tissue lysates were collected and frozen in liquid nitrogen. A total of 50 μL of tissue lysate was used to measure TG lipase activity in a volume of 200 μL as described above. Whole-tissue LPL activity was calculated by multiplying measured LPL activity per mg tissue by percent tissue mass in 25 g C57BL/6 mice: WAT (10%), heart (0.5%), muscle (40%), BAT (5%), and liver (5%) of total body weight.
Indirect Calorimetry and Body Composition Measurement.
For measurements of energy homeostasis, mice were acclimated in metabolic cages (LabMaster System; TSE Systems) for 5 d before data collection. Indirect calorimetry (O2 consumption and CO2 production), food intake, water intake, and physical activity were monitored for 1 min every 30 min for 5 consecutive days. In some experiments, lean mass and total fat mass were determined by NMR (Bruker).
Body temperature was measured with an implantable Programmable Temperature Transponder System (IPT-300; Bio Medic Data Systems). One week before recording, a temperature transponder was implanted s.c. on the back of each mouse. To assess cold tolerance, mice were place at 4 °C at 9:00 AM and provided free access to food and water. Temperatures were recorded every 2 h for a total of 8 h and again the next morning at 7:00 AM.
Triglyceride FA Analysis in Tissue.
Food intake was synchronized for 3 d and tissues were collected at the end of the feeding cycle. Lipids were extracted using the Folch et al. method (41). The levels of TG were measured using enzymatic assays (Infinity; Thermo Electron) and normalized to wet tissue weight. An internal standard (C15:0 TG) was added to the extracts, and the lipids were separated by TLC (40:10:1 hexane:diethyl ether:acetic acid). Fatty acids from the TG fraction were derivatized to form methyl esters and separated by gas/liquid chromatography using a Hewlett Packard 6890 Series GC system. The identity of the fatty acid methyl esters was determined by comparing the retention times with fatty acid standards (GLC-744; NU-Chek Prep). The abundance of each fatty acid was calculated based on the peak intensity and the internal standard.
Adipose Tissue Lipolysis Assay.
Mice were synchronized for 3 d prior to tissue collection (fasting: 5:00 PM to 7:00 AM; feeding: 7:00 AM to 5:00 PM). On day 4, mice were killed and perfused with 10 mL cold saline. Visceral (epididymal) WAT was collected at the end of the fasting cycle or 4 h after refeeding and minced in a fivefold volume of Opti-MEM containing fatty acid-free BSA (2%). Tissue lysates were rotated at 37 °C for 1 h. Fatty acids and free glycerol released into the medium were measured using the HR Series NEFA-HR Kit (Wako) and a free glycerol kit (FG0100; Sigma).
Cyclic Adenosine Monophosphate Assay.
cAMP levels were measured using a commercial ELISA kit from Enzo Life Sciences (ADI-900-163). Mice were entrained for 3 d to a synchronized regimen of daytime feeding (7:00 AM to 5:00 PM) and nighttime fasting (5:00 PM to 7:00 AM). On day 4, mice were euthanized at the end of the fasting cycle or 4 h after refeeding, and a portion of the epididymal fat pad was removed and immediately frozen in liquid nitrogen. Frozen fat pads were weighed and then homogenized with a hand-held electric homogenizer in a fivefold volume of 0.1 M HCl. Homogenates were centrifuged for 10 min at 1,000 × g and the aqueous portion was removed and spun a second time for 10 min at 15,000 × g. cAMP was assayed in duplicate in 100 μL homogenate using an ELISA kit according to the manufacturer’s instructions.
Glucose and Insulin Tolerance Testing.
Mice were fasted overnight (16 h) followed by oral gavage of glucose at 2 g/kg body weight. Blood glucose level was evaluated at 0, 30, 60, and 120 min postinjection from the tail tip using an Accu-Chek glucometer (Roche). For the insulin tolerance test, mice were fasted for 4 h followed by i.p. injection of 0.75 U/kg of human insulin (Eli Lilly). Blood glucose level was evaluated at 0, 30, 60, and 120 min postinjection from the tail tip using an Accu-Chek glucometer.
Immunoblot Analysis of AKT.
Total AKT, phosphorylated AKT (at residue S473; pAKT S473), and calnexin were assayed in epididymal WAT from fasted and refed mice by quantitative immunoblotting. Male WT and KO mice matched for age (13–20 wk) were fasted overnight for 16 h. In the morning, they were given insulin (10 mU/g body weight) or saline (n = 5 per group) by i.p. injection. After 10 min, the mice were killed and epididymal fad pads were excised. A 50-mg portion of each fat pad was homogenized in HNTG buffer (50 mM Hepes, 150 mM NaCl, 1% Triton X-100, 10% glycerol, pH 7.5), vortexed for 30 min at 4 °C, and centrifuged (12,000 × g) for 20 min at 4 °C. The fat layer was removed and the centrifugation was repeated. The infranatant was recovered and the protein concentration was measured using a Bradford protein assay kit (Bio-Rad). Samples (40 μg total protein) were mixed with 5× sample loading buffer (60 mM Tris⋅Cl, pH 6.8, 2% SDS, 10% glycerol, 5% β-mercaptoethanol, 0.01% bromophenol blue) and size-fractionated by polyacrylamide gel electrophoresis on 8% gels and probed with antibodies to AKT and pAKT S473 (Cell Signaling). Immunoreactive bands were quantified using LI-COR Odyssey Imaging System version 3.0, and data are reported as means ± SE of AKT standardized to calnexin.
Real-Time PCR.
Feeding was synchronized for 3 d (fasting: 5:00 PM to 7:00 AM; refeeding: 7:00 AM to 5:00 PM). On day 4, the mice were killed 4 h after refeeding, and visceral WAT samples were collected and frozen in liquid nitrogen. Total RNA was isolated from each tissue using a commercial reagent (RNeasy Plus Universal; Qiagen). cDNA was synthesized from 2 μg of total RNA using TaqMan (Applied Biosystems) in a volume of 100 μL with random hexamer primers and then amplified by PCR in 2× SYBR Master Mix (Applied Biosystems) in duplicate reactions containing 10 μL 2× SYBR Master Mix, 1.33 μL 2.5 μM primers, 7.7 μL diethyl dicarbonate⋅H2O, and 1 μL cDNA. The specific oligonucleotides for each transcript are listed in Table S1. The levels of each target mRNA were normalized to the level of cyclophilin (liver, WAT, BAT) or GAPDH (heart). For each transcript, the mean level of the WT animals was set to 1.
Adipose tissue mRNA was extracted from ∼100 mg tissue using a commercial kit (RNeasy Plus Universal; Qiagen) according to the manufacturer’s instructions with the following modifications. Samples were centrifuged at 6,000 × g for 15 min at 4 °C after homogenization in QIAzol Lysis Reagent. The top layer of fat was removed and the aqueous phase was transferred to a new tube. An equal volume of chloroform was added to the sample, which was then vortexed for 15 s before rotating at 4 °C for 1 h. cDNA was synthesized from 1 μg of RNA using TaqMan (Applied Biosystems) in a volume of 150 μL with random hexamer primers and then amplified by PCR in 2× SYBR Master Mix (Applied Biosystems) as described above.
Glucose and Insulin Measurement.
Mice were synchronized for 3 d (fasting: 5:00 PM to 7:00 AM; refeeding: 7:00 AM to 5:00 PM). On day 4, blood was collected in EDTA tubes at the end of the fasting cycle or 4 h after refeeding. Plasma was isolated and glucose was measured using the Vitros 250 System (GMI). Insulin levels were assayed using an ELISA kit (Ultra Sensitive Mouse Insulin ELISA Kit; Crystal Chem).
Fatty Acid Synthesis from Glucose.
Fatty acid synthesis from glucose was measured as described previously (30). Mice were entrained for 3 d to a synchronized regimen of daytime feeding (7:00 AM to 5:00 PM) and nighttime fasting (5:00 PM to 7:00 AM). On day 4, fatty acid synthesis was measured 4 h after refeeding. For each mouse, 10 μCi [U-14C]glucose (American Radiolabeled Chemicals) was injected by tail vein in 200 μL of saline. Sixty minutes after the injection, the mice were killed and tissues were perfused with 10 mL of cold saline before collection. About 100 mg of liver and WAT was saponified in 2 mL ethanolic KOH (6.7% KOH) for 2–3 h at 65 °C. Then, 2 mL of distilled water and 6 mL of petroleum ether (PE) were added sequentially. The phases were separated by centrifugation at 500 × g for 5 min at room temperature. The upper phase (PE fraction) was removed, and 0.2 HCl was added to the bottom fraction. After addition of 6 mL of hexane, the tubes were vortexed and centrifuged again. The upper phase (hexane fraction) was transferred to a scintillation vial. The lower phase was extracted again with 6 mL of hexane. The upper phase was transferred to the same vial and dried under N2. The scintillation vials were further dried at 80 °C, 15 mmHg for 45 min and then allowed to cool. Lipids were resolubilized in 1 mL of methanol, and 15 mL of scintillation fluid (Research Products) was added. 14C was determined by scintillation counting.
Acknowledgments
We thank Guosheng Liang and Philipp Scherer for helpful discussions, and Christina Zhao, Fang Xu, Zifen Wang, and Stephanie Blankenship for technical assistance. This work was supported by the National Institutes of Health (P01 HL20948).
Footnotes
The authors declare no conflict of interest.
This article contains supporting information online at www.pnas.org/lookup/suppl/doi:10.1073/pnas.1515374112/-/DCSupplemental.
References
- 1.Young SG, Zechner R. Biochemistry and pathophysiology of intravascular and intracellular lipolysis. Genes Dev. 2013;27(5):459–484. doi: 10.1101/gad.209296.112. [DOI] [PMC free article] [PubMed] [Google Scholar]
- 2.Hollenberg CH. The origin and glyceride distribution of fatty acids in rat adipose tissue. J Clin Invest. 1966;45(2):205–216. doi: 10.1172/JCI105333. [DOI] [PMC free article] [PubMed] [Google Scholar]
- 3.Kuwajima M, Foster DW, McGarry JD. Regulation of lipoprotein lipase in different rat tissues. Metabolism. 1988;37(6):597–601. doi: 10.1016/0026-0495(88)90178-3. [DOI] [PubMed] [Google Scholar]
- 4.Bergö M, Wu G, Ruge T, Olivecrona T. Down-regulation of adipose tissue lipoprotein lipase during fasting requires that a gene, separate from the lipase gene, is switched on. J Biol Chem. 2002;277(14):11927–11932. doi: 10.1074/jbc.M200325200. [DOI] [PubMed] [Google Scholar]
- 5.Kersten S, et al. Characterization of the fasting-induced adipose factor FIAF, a novel peroxisome proliferator-activated receptor target gene. J Biol Chem. 2000;275(37):28488–28493. doi: 10.1074/jbc.M004029200. [DOI] [PubMed] [Google Scholar]
- 6.Yoshida K, Shimizugawa T, Ono M, Furukawa H. Angiopoietin-like protein 4 is a potent hyperlipidemia-inducing factor in mice and inhibitor of lipoprotein lipase. J Lipid Res. 2002;43(11):1770–1772. doi: 10.1194/jlr.c200010-jlr200. [DOI] [PubMed] [Google Scholar]
- 7.Gray NE, et al. Angiopoietin-like 4 (Angptl4) protein is a physiological mediator of intracellular lipolysis in murine adipocytes. J Biol Chem. 2012;287(11):8444–8456. doi: 10.1074/jbc.M111.294124. [DOI] [PMC free article] [PubMed] [Google Scholar]
- 8.Kersten S. Physiological regulation of lipoprotein lipase. Biochim Biophys Acta. 2014;1841(7):919–933. doi: 10.1016/j.bbalip.2014.03.013. [DOI] [PubMed] [Google Scholar]
- 9.Kroupa O, et al. Linking nutritional regulation of Angptl4, Gpihbp1, and Lmf1 to lipoprotein lipase activity in rodent adipose tissue. BMC Physiol. 2012;12:13. doi: 10.1186/1472-6793-12-13. [DOI] [PMC free article] [PubMed] [Google Scholar]
- 10.Mandard S, et al. The fasting-induced adipose factor/angiopoietin-like protein 4 is physically associated with lipoproteins and governs plasma lipid levels and adiposity. J Biol Chem. 2006;281(2):934–944. doi: 10.1074/jbc.M506519200. [DOI] [PubMed] [Google Scholar]
- 11.Smolin LA, Surh DM, Brasel JA, Glick Z. Meal-induced changes in lipoprotein lipase activity in brown fat and other tissues of rats. J Nutr. 1986;116(3):429–434. doi: 10.1093/jn/116.3.429. [DOI] [PubMed] [Google Scholar]
- 12.Quagliarini F, et al. Atypical angiopoietin-like protein that regulates ANGPTL3. Proc Natl Acad Sci USA. 2012;109(48):19751–19756. doi: 10.1073/pnas.1217552109. [DOI] [PMC free article] [PubMed] [Google Scholar]
- 13.Zhang R. Lipasin, a novel nutritionally-regulated liver-enriched factor that regulates serum triglyceride levels. Biochem Biophys Res Commun. 2012;424(4):786–792. doi: 10.1016/j.bbrc.2012.07.038. [DOI] [PubMed] [Google Scholar]
- 14.Ren G, Kim JY, Smas CM. Identification of RIFL, a novel adipocyte-enriched insulin target gene with a role in lipid metabolism. Am J Physiol Endocrinol Metab. 2012;303(3):E334–E351. doi: 10.1152/ajpendo.00084.2012. [DOI] [PMC free article] [PubMed] [Google Scholar]
- 15.Wang Y, et al. Mice lacking ANGPTL8 (Betatrophin) manifest disrupted triglyceride metabolism without impaired glucose homeostasis. Proc Natl Acad Sci USA. 2013;110(40):16109–16114. doi: 10.1073/pnas.1315292110. [DOI] [PMC free article] [PubMed] [Google Scholar]
- 16.Lee EC, et al. Identification of a new functional domain in angiopoietin-like 3 (ANGPTL3) and angiopoietin-like 4 (ANGPTL4) involved in binding and inhibition of lipoprotein lipase (LPL) J Biol Chem. 2009;284(20):13735–13745. doi: 10.1074/jbc.M807899200. [DOI] [PMC free article] [PubMed] [Google Scholar]
- 17.Conklin D, et al. Identification of a mammalian angiopoietin-related protein expressed specifically in liver. Genomics. 1999;62(3):477–482. doi: 10.1006/geno.1999.6041. [DOI] [PubMed] [Google Scholar]
- 18.Ge H, et al. Differential regulation and properties of angiopoietin-like proteins 3 and 4. J Lipid Res. 2005;46(7):1484–1490. doi: 10.1194/jlr.M500005-JLR200. [DOI] [PubMed] [Google Scholar]
- 19.Koishi R, et al. Angptl3 regulates lipid metabolism in mice. Nat Genet. 2002;30(2):151–157. doi: 10.1038/ng814. [DOI] [PubMed] [Google Scholar]
- 20.Köster A, et al. Transgenic angiopoietin-like (angptl)4 overexpression and targeted disruption of angptl4 and angptl3: Regulation of triglyceride metabolism. Endocrinology. 2005;146(11):4943–4950. doi: 10.1210/en.2005-0476. [DOI] [PubMed] [Google Scholar]
- 21.Gusarova V, et al. ANGPTL3 blockade with a human monoclonal antibody reduces plasma lipids in dyslipidemic mice and monkeys. J Lipid Res. 2015;56(7):1308–1317. doi: 10.1194/jlr.M054890. [DOI] [PMC free article] [PubMed] [Google Scholar]
- 22.Wang Y, et al. Inactivation of ANGPTL3 reduces hepatic VLDL-triglyceride secretion. J Lipid Res. 2015;56(7):1296–1307. doi: 10.1194/jlr.M054882. [DOI] [PMC free article] [PubMed] [Google Scholar]
- 23.Garcia-Arcos I, et al. Adipose-specific lipoprotein lipase deficiency more profoundly affects brown than white fat biology. J Biol Chem. 2013;288(20):14046–14058. doi: 10.1074/jbc.M113.469270. [DOI] [PMC free article] [PubMed] [Google Scholar]
- 24.Peng Y, et al. Cloning, human chromosomal assignment, and adipose and hepatic expression of the CL-6/INSIG1 gene. Genomics. 1997;43(3):278–284. doi: 10.1006/geno.1997.4821. [DOI] [PubMed] [Google Scholar]
- 25.Baulande S, Lasnier F, Lucas M, Pairault J. Adiponutrin, a transmembrane protein corresponding to a novel dietary- and obesity-linked mRNA specifically expressed in the adipose lineage. J Biol Chem. 2001;276(36):33336–33344. doi: 10.1074/jbc.M105193200. [DOI] [PubMed] [Google Scholar]
- 26.Hopgood MF, Ballard FJ. Synthesis and degradation of phosphoenolpyruvate carboxylase in rat liver and adipose tissue. Changes during a starvation-re-feeding cycle. Biochem J. 1973;134(2):445–453. doi: 10.1042/bj1340445. [DOI] [PMC free article] [PubMed] [Google Scholar]
- 27.Horton JD, Goldstein JL, Brown MS. SREBPs: Transcriptional mediators of lipid homeostasis. Cold Spring Harb Symp Quant Biol. 2002;67:491–498. doi: 10.1101/sqb.2002.67.491. [DOI] [PubMed] [Google Scholar]
- 28.Iizuka K, Bruick RK, Liang G, Horton JD, Uyeda K. Deficiency of carbohydrate response element-binding protein (ChREBP) reduces lipogenesis as well as glycolysis. Proc Natl Acad Sci USA. 2004;101(19):7281–7286. doi: 10.1073/pnas.0401516101. [DOI] [PMC free article] [PubMed] [Google Scholar]
- 29.Herman MA, et al. A novel ChREBP isoform in adipose tissue regulates systemic glucose metabolism. Nature. 2012;484(7394):333–338. doi: 10.1038/nature10986. [DOI] [PMC free article] [PubMed] [Google Scholar]
- 30.Baker N, Learn DB, Bruckdorfer KR. Re-evaluation of lipogenesis from dietary glucose carbon in liver and carcass of mice. J Lipid Res. 1978;19(7):879–893. [PubMed] [Google Scholar]
- 31.Richardson DK, Czech MP. Primary role of decreased fatty acid synthesis in insulin resistance of large rat adipocytes. Am J Physiol. 1978;234(2):E182–E189. doi: 10.1152/ajpendo.1978.234.2.E182. [DOI] [PubMed] [Google Scholar]
- 32.Eissing L, et al. De novo lipogenesis in human fat and liver is linked to ChREBP-β and metabolic health. Nat Commun. 2013;4:1528. doi: 10.1038/ncomms2537. [DOI] [PMC free article] [PubMed] [Google Scholar]
- 33.Roberts R, et al. Markers of de novo lipogenesis in adipose tissue: Associations with small adipocytes and insulin sensitivity in humans. Diabetologia. 2009;52(5):882–890. doi: 10.1007/s00125-009-1300-4. [DOI] [PubMed] [Google Scholar]
- 34.Mandard S, et al. The direct peroxisome proliferator-activated receptor target fasting-induced adipose factor (FIAF/PGAR/ANGPTL4) is present in blood plasma as a truncated protein that is increased by fenofibrate treatment. J Biol Chem. 2004;279(33):34411–34420. doi: 10.1074/jbc.M403058200. [DOI] [PubMed] [Google Scholar]
- 35.Weinstock PH, et al. Lipoprotein lipase controls fatty acid entry into adipose tissue, but fat mass is preserved by endogenous synthesis in mice deficient in adipose tissue lipoprotein lipase. Proc Natl Acad Sci USA. 1997;94(19):10261–10266. doi: 10.1073/pnas.94.19.10261. [DOI] [PMC free article] [PubMed] [Google Scholar]
- 36.Kuriyama H, et al. Compensatory increase in fatty acid synthesis in adipose tissue of mice with conditional deficiency of SCAP in liver. Cell Metab. 2005;1(1):41–51. doi: 10.1016/j.cmet.2004.11.004. [DOI] [PubMed] [Google Scholar]
- 37.Hannah VC, Ou J, Luong A, Goldstein JL, Brown MS. Unsaturated fatty acids down-regulate srebp isoforms 1a and 1c by two mechanisms in HEK-293 cells. J Biol Chem. 2001;276(6):4365–4372. doi: 10.1074/jbc.M007273200. [DOI] [PubMed] [Google Scholar]
- 38.Robciuc MR, et al. Angptl3 deficiency is associated with increased insulin sensitivity, lipoprotein lipase activity, and decreased serum free fatty acids. Arterioscler Thromb Vasc Biol. 2013;33(7):1706–1713. doi: 10.1161/ATVBAHA.113.301397. [DOI] [PubMed] [Google Scholar]
- 39.Romeo S, et al. Rare loss-of-function mutations in ANGPTL family members contribute to plasma triglyceride levels in humans. J Clin Invest. 2009;119(1):70–79. doi: 10.1172/JCI37118. [DOI] [PMC free article] [PubMed] [Google Scholar]
- 40.Musunuru K, et al. Exome sequencing, ANGPTL3 mutations, and familial combined hypolipidemia. N Engl J Med. 2010;363(23):2220–2227. doi: 10.1056/NEJMoa1002926. [DOI] [PMC free article] [PubMed] [Google Scholar]
- 41.Folch J, Lees M, Sloane Stanley GH. A simple method for the isolation and purification of total lipides from animal tissues. J Biol Chem. 1957;226(1):497–509. [PubMed] [Google Scholar]
- 42.Bartelt A, et al. Brown adipose tissue activity controls triglyceride clearance. Nat Med. 2011;17(2):200–205. doi: 10.1038/nm.2297. [DOI] [PubMed] [Google Scholar]
- 43.Holland WL, et al. An FGF21-adiponectin-ceramide axis controls energy expenditure and insulin action in mice. Cell Metab. 2013;17(5):790–797. doi: 10.1016/j.cmet.2013.03.019. [DOI] [PMC free article] [PubMed] [Google Scholar]


