

Significance
Aberrant promoter methylation of tumor suppressor genes (TSGs) has been found in a large number of human cancers, including Epstein–Barr virus (EBV)-associated cancers. However, how epigenetic modification controls TSG expression in primary B lymphocytes in response to EBV infection has not been fully investigated. In vitro EBV readily transforms quiescent B-cells into lymphoblastoid cell lines, providing a working model for understanding the underlying molecular mechanisms of B-cell lymphoma development. To our knowledge, our work represents the first report to demonstrate that EBV-infection of naïve B lymphocytes resulted in global transcriptional repression of TSGs through recruitment of hypermethylation activities at CpG islands. These results can be further used as potential prognostic-markers and for current therapeutic enhancements against acute-infection and EBV-associated B-cell lymphomas.
Keywords: EBV, B-cell lymphoma, lymphoblastoid cell lines, promoter methylation, tumor suppressor genes
Abstract
DNA-methylation at CpG islands is one of the prevalent epigenetic alterations regulating gene-expression patterns in mammalian cells. Hypo- or hypermethylation-mediated oncogene activation, or tumor suppressor gene (TSG) silencing mechanisms, widely contribute to the development of multiple human cancers. Furthermore, oncogenic viruses, including Epstein–Barr virus (EBV)-associated human cancers, were also shown to be influenced by epigenetic modifications on the viral and cellular genomes in the infected cells. We investigated EBV infection of resting B lymphocytes, which leads to continuously proliferating lymphoblastoid cell lines through examination of the expression pattern of a comprehensive panel of TSGs and the epigenetic modifications, particularly methylation of their regulatory sequences. EBV infection of primary B lymphocytes resulted in global transcriptional repression of TSGs through engagement of hypermethylation. Therefore, CpG methylation profiles of TSGs may be used as a prognostic marker as well as development of potential therapeutic strategies for controlling acute infection and EBV-associated B-cell lymphomas.
DNA-methylation status represents one of the most frequent epigenetic modifications controlling gene-expression patterns in normal cells (1). Therefore, it should be noted that hypomethylation-mediated oncogene activation, and conversely hypermethylation-mediated tumor suppressor gene (TSG) silencing, would provide an important platform for understanding development of cancer (1, 2). DNA-methylation is catalyzed by DNA methyltransferase (DNMT) enzymes, identified as DNMT1, DNMT3A, and DNMT3B (2). DNMT1 has been shown to be involved in maintaining overall methylation density in cells, whereas DNMT3A and DNMT3B function as de novo methyltransferase enzymes (2). A fourth DNMT enzyme, DNMT2, lacks proper DNA-methylating catalytic activity (2, 3). Although elevated expression of one or all DNMTs has been reported in a number of cancer cell types (1), the degree to which they are precisely involved in tumor growth remains somewhat unclear.
Human tumor virus infections can result in modulation of expression of DNMTs; however, there is no particular trend (4, 5). For example, the hepatitis B virus-encoded X protein elevates expressions of DNMT1 and DNMT3A, and represses DNMT3B (6). In contrast, hepatitis C virus-encoded core protein up-regulates both DNMT1 and DNMT3B (6). However, the human papillomavirus-encoded E6 protein up-regulates only DNMT1 (7). Furthermore, the Kaposi’s sarcoma-associated herpesvirus-encoded LANA protein up-regulates only DNMT3A (8). In contrast, one of the essential Epstein–Barr virus (EBV) -encoded latent proteins, LMP1, was shown to up-regulate all three DNMTs in nasopharyngeal carcinoma (NPC) cell lines (9, 10), but down-regulates DNMT1 in germinal center B-cell–derived malignancies, such as Hodgkin’s lymphoma (4). LMP1 can also induce methylation of the TSGs, RARB and CDH13, thereby blocking their transcription in NPC-lines (10). Another EBV-encoded latent nuclear membrane protein, LMP2A, was also shown to induce DNMT1 expression, and subsequently increase the methylation of the phosphatase and tensin homolog deleted on chromosome 10 (PTEN) TSG, in gastric cancer (GC) cell lines (11). The precise role of other EBV latent antigens in the epigenetic deregulation of the cellular genome, including expression of TSGs, remains largely unexplored.
Evidence to date has demonstrated that expression of TSGs is strongly associated with promoter hypermethylation in EBV-associated GC (12). However, modulation of DNMT expression on EBV infection, and subsequently expression of TSGs in primary B lymphocytes, has not yet been fully explored. Importantly, in vitro EBV infection of resting B-cells leads to continuously proliferating lymphoblastoid cell lines (LCLs), which serve as an attractive surrogate model for investigating the underlying molecular mechanisms in developing several EBV-associated B-cell proliferative disorders, including immunoblastic lymphoma and posttransplant lymphoproliferative disorder in immune-competent as well as immune-suppressed individuals.
In this report, we investigated the acquisition of DNA-methylation changes in the regulatory regions of TSGs during EBV-induced primary B-cell transformation leading to continuously proliferating LCLs. Our results now suggest a model where in vitro EBV infection leads to overall transcriptional repression of TSGs through enhanced methylation at their CpG islands. Further in depth analysis of other epigenetic alterations, including histone modifications associated with EBV-induced B-cell transformation, may result in a more comprehensive understanding of B-cell lymphoma development to facilitate current therapeutic interventions.
Results
EBV Infection of Human Primary B Cells Leads to Aberrant Methylation of Cellular Genes.
Studies have shown that EBV hijacks the cellular methylating machinery to regulate the gene-expression program, which is important for driving transformation of infected cells (13). This includes promoter regions of hypomethylated oncogenes as well as hypermethylated TSGs (12, 14). However, the underlying mechanism by which EBV triggers primary resting B lymphocytes toward uncontrolled cell proliferation is not fully understood.
To explore the overall changes in cellular DNA-methylation associated with EBV-induced B-cell transformation, fresh peripheral blood mononuclear cells (PBMCs) from healthy individuals were infected with GFP-tagged EBV generated from a stably infected BACmid HEK293T cell line (15) for a period of 15 d. To monitor EBV infection, GFP fluorescence of infected PBMCs was assessed using fluorescence microscopy (Fig. S1). Because genetic variants may also be associated with the disparity of gene expressions, PBMCs were collected from three independent donors. Total genomic DNA was isolated from infected PBMCs at different times of postinfection (0, 2, 7, and 15 d) and subjected to methylation profiling (Fig. 1). A total of 96 gene-promoter sequences from three independent samples were evaluated (Table S1). We used the “Tumor Suppressor Genes DNA Methylation PCR Array” gene set from SABiosciences. The categories of these 96 genes are shown in Table S2. As expected, our results demonstrated that EBV infection led to an overall change in cellular methylation status of CpG islands (Fig. 1). An analogous pattern was observed in results from all three respective donors (Table S3), as shown in the representative dataset from donor 1 (Fig. 1). Data analysis was carried out using an algorithm provided by SABiosciences, which included the quality check to include or exclude real-time PCR data points for individual genes. The relative change in the percent methylation is represented with respect to the day 0 control sample. Change in the methylation status is displayed as a heat map normalized separately for individual gene promoters (Fig. 1). The results showed that by 15-d postinfection the regions were highly methylated, suggesting a role for EBV antigens in inducing methylation of the represented cellular genes.
Fig. S1.
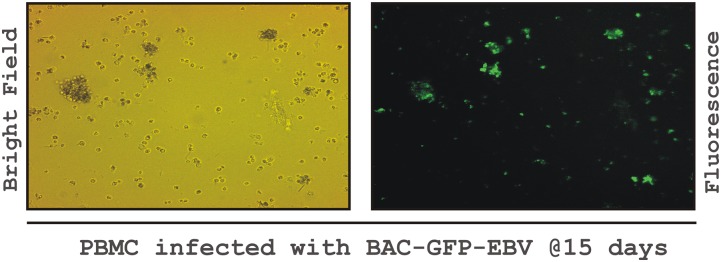
In vitro infection of PBMCs with BAC-GFP-EBV. Approximately 10 million PBMCs from healthy donors were mixed with virus supernatant in 1 mL of RPMI 1640 with 10% FBS for 4 h at 37 °C. Cells were centrifuged for 5 min at 500 × g, and the supernatant discarded. Pelleted cells were resuspended in 2 mL of complete RPMI medium 1640 in six-well plates. EBV-GFP expression was visualized by fluorescence microscopy (20× magnification) and used to quantify infection.
Fig. 1.

Methyl-array profiling of human TSGs in response to EBV infection in resting PBMCs. (A) Approximately 10 million PBMCs were infected with GFP-tagged BAC-EBV. Genomic DNA was isolated on days 0-, 2-, 7-, and 15-d postinfection. DNA was quantified and subjected to overnight digestion with combinations of methylation-sensitive and -dependent enzymes, as suggested in the manual provided by the manufacturer [SABioscience-Methyl-Profiler DNA Methylation PCR Array System (335211)]. Data analysis (algorithm provided by the manufacturer) also included the quality check to include or exclude the real-time PCR data points for individual genes. Relative change in the percent methylation is represented with respect to the day 0 control sample. Changes in the methylation status are displayed as a heat map normalized separately for individual gene promoter. (B) The results are depicted as four significantly different categories which represented the methylation patterns: (i) gain of methylation, (ii) loss of methylation, (iii) distinct methylation status, and (iv) fluctuating methylation status. The similar experiments were carried out for three independent donors and a representative figure is shown from donor 1. The red-marked gene promoters were chosen for subsequent real-time PCR experiments.
Table S1.
List of genes in methyl profiling
| Serial no. | RefSeq | Symbol | Description |
| 1 | NM_000927 | ABCB1 | ATP-binding cassette, sub-family B |
| 2 | NM_007313 | ABL1 | C-abl oncogene 1, nonreceptor tyrosine kinase |
| 3 | NM_005163 | AKT1 | V-akt murine thymoma viral oncogene homolog 1 |
| 4 | NM_000038 | APC | Adenomatous polyposis coli |
| 5 | NM_000051 | ATM | Ataxia telangiectasia mutated |
| 6 | NM_000633 | BCL2 | B-cell CLL/lymphoma 2 |
| 7 | NM_004327 | BCR | Breakpoint cluster region |
| 8 | NM_001168 | BIRC5 | Baculoviral IAP repeat containing 5 |
| 9 | NM_004333 | BRAF | V-raf murine sarcoma viral oncogene homolog B1 |
| 10 | NM_007294 | BRCA1 | Breast cancer 1, early onset |
| 11 | NM_000059 | BRCA2 | Breast cancer 2, early onset |
| 12 | NM_014333 | CADM1 | Cell adhesion molecule 1 |
| 13 | NM_001753 | CAV1 | Caveolin 1, caveolae protein, 22 kDa |
| 14 | NM_053056 | CCND1 | Cyclin D1 |
| 15 | NM_001759 | CCND2 | Cyclin D2 |
| 16 | NM_000610 | CD44 | CD44 molecule (Indian blood group) |
| 17 | NM_004360 | CDH1 | Cadherin 1, type 1, E-cadherin (epithelial) |
| 18 | NM_001257 | CDH13 | Cadherin 13, H-cadherin (heart) |
| 19 | NM_000389 | CDKN1A | Cyclin-dependent kinase inhibitor 1A (p21, Cip1) |
| 20 | NM_004064 | CDKN1B | Cyclin-dependent kinase inhibitor 1B (p27, Kip1) |
| 21 | NM_000076 | CDKN1C | Cyclin-dependent kinase inhibitor 1C (p57, Kip2) |
| 22 | NM_000077 | CDKN2A | Cyclin-dependent kinase inhibitor 2A (melanoma, p16, inhibits CDK4) |
| 23 | NM_004936 | CDKN2B | Cyclin-dependent kinase inhibitor 2B (p15, inhibits CDK4) |
| 24 | NM_005192 | CDKN3 | Cyclin-dependent kinase inhibitor 3 |
| 25 | NM_001265 | CDX2 | Caudal type homeobox 2 |
| 26 | NM_018223 | CHFR | Checkpoint with forkhead and ring finger domains |
| 27 | NM_001904 | CTNNB1 | Catenin (cadherin-associated protein), β-1, 88 kDa |
| 28 | NM_138709 | DAB2IP | DAB2 Interacting Protein |
| 29 | NM_004938 | DAPK1 | Death-associated protein kinase 1 |
| 30 | NM_004675 | DIRAS3 | DIRAS family, GTP-binding RAS-like 3 |
| 31 | NM_015881 | DKK3 | Dickkopf homolog 3 (Xenopus laevis) |
| 32 | NM_006094 | DLC1 | Deleted in liver cancer 1 |
| 33 | NM_005225 | E2F1 | E2F transcription factor 1 |
| 34 | NM_005228 | EGFR | Epidermal growth factor receptor |
| 35 | NM_001005862 | ERBB2 | V-erb-b2 erythroblastic leukemia viral oncogene homolog 2, neuro/glioblastoma derived oncogene homolog (avian) |
| 36 | NM_000125 | ESR1 | Estrogen receptor 1 |
| 37 | NM_000043 | FAS | Fas (TNF receptor superfamily, member 6) |
| 38 | NM_002012 | FHIT | Fragile histidine triad gene |
| 39 | NM_005252 | FOS | FBJ murine osteosarcoma viral oncogene homolog |
| 40 | NM_000852 | GSTP1 | GST pi 1 |
| 41 | NM_006497 | HIC1 | Hypermethylated in cancer 1 |
| 42 | NM_005522 | HOXA1 | Homeobox A1 |
| 43 | NM_005343 | HRAS | V-Ha-ras Harvey rat sarcoma viral oncogene homolog |
| 44 | NM_031511 | IGF2 | Insulin-Like Growth Factor 2 (Somatomedin A) |
| 45 | NM_000876 | IGF2R | Insulin-like growth factor 2 receptor |
| 46 | NM_005537 | ING1 | Inhibitor of growth family, member 1 |
| 47 | NM_002228 | JUN | Jun proto-oncogene |
| 48 | NM_002317 | LOX | Lysyl oxidase |
| 49 | NM_002392 | MDM2 | Mdm2 p53 binding protein homolog (mouse) |
| 50 | NM_002412 | MGMT | O-6-methylguanine-DNA methyltransferase |
| 51 | NM_000249 | MLH1 | MutL homolog 1, colon cancer, nonpolyposis type 2 (Escherichia coli) |
| 52 | NM_002467 | MYC | V-myc myelocytomatosis viral oncogene homolog (avian) |
| 53 | NM_005378 | MYCN | V-myc myelocytomatosis viral related oncogene, neuroblastoma derived (avian) |
| 54 | NM_006161 | NEUROG1 | Neurogenin 1 |
| 55 | NM_000267 | NF1 | Neurofibromin 1 |
| 56 | NM_000268 | NF2 | Neurofibromin 2 (merlin) |
| 57 | NM_003998 | NFKB1 | Nuclear factor of κ light polypeptide gene enhancer in B-cells 1 |
| 58 | NM_000269 | NME1 | Nonmetastatic cells 1, protein (NM23A) expressed in |
| 59 | NM_002545 | OPCML | Opioid binding protein/cell adhesion molecule-like |
| 60 | NM_003687 | PDLIM4 | PDZ and LIM domain 4 |
| 61 | NM_015866 | PRDM2 | PR domain containing 2, with ZNF domain |
| 62 | NM_000264 | PTCH1 | Patched 1 |
| 63 | NM_000314 | PTEN | Phosphatase and tensin homolog |
| 64 | NM_000963 | PTGS2 | Prostaglandin-endoperoxide synthase 2 (prostaglandin G/H synthase and cyclooxygenase) |
| 65 | NM_013258 | PYCARD | PYD and CARD domain containing |
| 66 | NM_000965 | RARB | Retinoic acid receptor, β |
| 67 | NM_007182 | RASSF1 | Ras association (RalGDS/AF-6) domain family member 1 |
| 68 | NM_000321 | RB1 | Retinoblastoma 1 |
| 69 | NM_020630 | RET | Ret proto-oncogene |
| 70 | NM_004350 | RUNX3 | Runt-related transcription factor 3 |
| 71 | NM_052863 | SCGB3A1 | Secretoglobin, family 3A, member 1 |
| 72 | NM_006142 | SFN | Stratifin |
| 73 | NM_003012 | SFRP1 | Secreted frizzled-related protein 1 |
| 74 | NM_003013 | SFRP2 | Secreted frizzled-related protein 2 |
| 75 | NM_014631 | SH3PXD2A | SH3 and PX domains 2A |
| 76 | NM_145913 | SLC5A8 | Solute carrier family 5 (iodide transporter), member 8 |
| 77 | NM_005359 | SMAD4 | SMAD family member 4 |
| 78 | NM_003073 | SMARCB1 | SWI/SNF related, matrix associated, actin dependent regulator of chromatin, subfamily b, member 1 |
| 79 | NM_003745 | SOCS1 | Suppressor of cytokine signaling 1 |
| 80 | NM_003118 | SPARC | Secreted protein, acidic, cysteine-rich (osteonectin) |
| 81 | NM_198253 | TERT | Telomerase reverse transcriptase |
| 82 | NM_000660 | TGFB1 | Transforming growth factor, β-1 |
| 83 | NM_003242 | TGFBR2 | Transforming growth factor, β-receptor II (70/80 kDa) |
| 84 | NM_003246 | THBS1 | Thrombospondin 1 |
| 85 | NM_000362 | TIMP3 | TIMP metallopeptidase inhibitor 3 |
| 86 | NM_000546 | TP53 | Tumor protein p53 |
| 87 | NM_005427 | TP73 | Tumor protein p73 |
| 88 | NM_000368 | TSC1 | Tuberous sclerosis 1 |
| 89 | NM_000548 | TSC2 | Tuberous sclerosis 2 |
| 90 | NM_003376 | VEGFA | Vascular endothelial growth factor A |
| 91 | NM_000551 | VHL | Von Hippel-Lindau tumor suppressor |
| 92 | NM_007191 | WIF1 | WNT inhibitory factor 1 |
| 93 | NM_000378 | WT1 | Wilms tumor 1 |
| 94 | NM_016373 | WWOX | WW domain containing oxidoreductase |
| 95 | NM_006297 | XRCC1 | X-ray repair complementing defective repair in Chinese hamster cells 1 |
| 96 | NM_015896 | ZMYND10 | Zinc finger, MYND-type containing 10 |
Table S2.
List of categories of genes in methyl profiling
| Serial no. | Category | Genes* |
| 1 | Angiogenesis | AKT1, CAV1, CDH13, CDX2, CTNNB1, ERBB2, LOX, NF1, PTEN, VEGFA |
| 2 | Apoptosis | AKT1, BCL2, BIRC5, BRAF, BRCA1, CADM1, CDKN1A, CDKN1B, CDKN2A, DAPK1, DLC1, E2F1, FAS, GSTP1, MDM2, MEN1, MGMT, NF1, NFKB1, NME1, PTEN, PYCARD, RUNX3, SFN, SFRP1, SLC5A8, TGFB1, TIMP3, TP53, TP73, VEGFA, VHL |
| 3 | Cell adhesion and ECM | ABL1, APC, CADM1, CD44, CDH1, CDH13, CDKN2A, CTNNB1, EGFR, ERBB2, NF1, NF2, OPCML, RET, SPARC, THBS1, VEGFA |
| 4 | Cell cycle | ABL1, APC, ATM, BIRC5, BRCA1, BRCA2, CADM1, CCND1, CCND2, CDKN1A, CDKN1B, CDKN1C, CDKN2A, CDKN2B, CDKN3, CHFR, DIRAS3, E2F1, EGFR, FHIT, HIC1, ING1, MDM2, MEN1, MLH1, MYC, NEUROG1, NF1, NF2, NME1, PTCH1, PTEN, PYCARD, RASSF1, RB1, RUNX3, SFN, SLC5A8, SMARCB1, SPARC, TERT, TGFB1, TP53, TP73, TSC1, TSC2, VHL, WT1, WWOX |
| 5 | Chemotaxis, cell Migration and motility | CDH13, CDKN1B, DLC1, EGFR, HRAS, NF1, NF2, PTEN, PTGS2, TSC2, VEGFA |
| 6 | Cytoskeleton | ABL1, APC, BIRC5, BRCA2, CDH13, CDKN1B, DLC1, EGFR, NF1, NF2, PTEN, TSC1 |
| 7 | DNA damage and repair | ABL1, APC, ATM, BRCA1, BRCA2, CDKN1A, MGMT, MLH1, SFN, TERT, TP53, TP73, XRCC1 |
| 8 | Epigenetics | BRCA2, DIRAS3, FOS, MGMT, RB1, SMARCB1 |
| 9 | Epithelial-to-mesenchymal transition | BRCA2, CAV1, CDKN1B, CDKN1C, CDKN2B, CTNNB1, EGFR, ERBB2, NME1, RUNX3, TGFB1 |
| 10 | Oxidative stress | LOX, PTGS2, WWOX |
| 11 | AKT/PI3K signaling | AKT1, ERBB2, NF1, PTEN, SH3PXD2A, TSC2 |
| 12 | EGF signaling | EGFR, ERBB2 |
| 13 | Estrogen signaling | BRCA1, BRCA2, ESR1 |
| 14 | Hedgehog signaling | PTCH1 |
| 15 | Insulin signaling | AKT1, IGF2, IGF2R, SOCS1, TSC2 |
| 16 | JAK/STAT signaling | SOCS1 |
| 17 | PDGF signaling | PTEN, VEGFA |
| 18 | Small GTPase signaling | BCR, BRAF, CDH13, DAB2IP, DIRAS3, DLC1, HRAS, NF1, RASSF1, TSC1, TSC2 |
| 19 | TGFb/BMP signaling | SMAD4, TGFB1, TGFBR2 |
| 20 | TNF signaling | PYCARD |
| 21 | VEGF signaling | AKT1, VEGFA |
| 22 | WNT signaling | APC, CTNNB1, DKK3, SFRP1, SFRP2, WIF1 |
| 23 | Transcription factors | BRCA1, BRCA2, CDH1, CDX2, CTNNB1, E2F1, ESR1, FOS, HIC1, HOXA1, JUN, MYC, MYCN, NEUROG1, NFKB1, PRDM2, RARB, RB1, RUNX3, SMAD4, TGFB1, TP53, TP73, VHL, WT1 |
| 24 | Others | ABCB1, PDLIM4, SCGB3A1, ZMYND10 |
Table S3.
Percentage methylation of candidate gene promoters in response to EBV infection in PBMC
| Gene symbols | Donor 1 | Donor 2 | Donor 3 | ||||||
| 2 d | 7 d | 15 d | 2 d | 7 d | 15 d | 2 d | 7 d | 15 d | |
| ABCB1 | 0.99 | 2.29 | 2.85 | 6440.06 | 0.26 | 0.27 | 3.45 | 0.17 | 0.08 |
| ABL1 | 0.25 | 0.65 | 1.35 | 0.80 | 1.12 | 0.83 | 1.04 | 17.24 | 16.25 |
| AKT1 | 1.67 | 3.95 | 4.01 | 1.68 | 0.69 | 1.03 | 1.27 | 75.05 | 67.97 |
| APC | 0.95 | 0.71 | 0.00 | 94.98 | 187.30 | 142.35 | 671.24 | 38.32 | 143.12 |
| ATM | 7.11 | 63.49 | 43.91 | 23.35 | 27.82 | 26.90 | 18.66 | 74.49 | 67.10 |
| BCL2 | 0.89 | 0.82 | 3.45 | 3.13 | 6.25 | 4.83 | 0.53 | 33.86 | 22.65 |
| BCR | 0.34 | 3.64 | 0.66 | 1.38 | 4.95 | 3.66 | 2.04 | 48.45 | 43.11 |
| BIRC5 | 0.84 | 0.75 | 1.45 | 0.19 | 0.53 | 0.48 | 0.87 | 27.03 | 28.12 |
| BRAF | 2.21 | 10.16 | 18.52 | 0.37 | 2.84 | 7.00 | 0.37 | 6.18 | 4.46 |
| BRCA1 | 57.38 | 10.89 | 68.08 | 90.09 | 282.66 | 124.73 | 2.99 | 2.73 | 2.15 |
| BRCA2 | 1.63 | 5.21 | 0.76 | 1.77 | 3.32 | 2.57 | 3.02 | 7.27 | 7.01 |
| CADM1 | 1.79 | 1.64 | 2.05 | 0.12 | 1.06 | 1.01 | 1.32 | 6.24 | 4.81 |
| CAV1 | 3.23 | 3.11 | 0.44 | 2194.48 | 2794.99 | 1322.80 | 2.09 | 3.21 | 2.12 |
| CCND1 | 0.00 | 0.01 | 1.80 | 1.18 | 0.88 | 1.53 | 12.49 | 18.86 | 12.85 |
| CCND2 | 2.32 | 1.95 | 0.66 | 1687.17 | 3272.35 | 1959.78 | 1.17 | 1.09 | 0.81 |
| CD44 | 0.71 | 6.55 | 0.76 | 8.58 | 8.28 | 1.79 | 1.67 | 17.22 | 15.06 |
| CDH1 | 0.96 | 0.86 | 1.39 | 3.88 | 1.80 | 1.68 | 0.87 | 2.81 | 3.42 |
| CDH13 | 0.55 | 1.14 | 0.83 | 0.55 | 0.44 | 0.44 | 25.83 | 142.09 | 191.67 |
| CDKN1A | 1.12 | 2.78 | 4.92 | 0.14 | 0.10 | 0.04 | 0.39 | 19.95 | 19.18 |
| CDKN1B | 3.73 | 14.71 | 12.23 | 11.93 | 15.07 | 23.88 | 1.43 | 4.64 | 5.64 |
| CDKN1C | 3.25 | 1.16 | 5.93 | 0.15 | 3.57 | 2.64 | 0.01 | 1.81 | 2.10 |
| CDKN2A | 3.60 | 9.13 | 11.06 | 0.05 | 0.46 | 0.74 | 2.45 | 86.69 | 73.63 |
| CDKN2B | 0.06 | 0.40 | 5.04 | 0.86 | 0.27 | 0.04 | 0.39 | 25.63 | 20.06 |
| CDKN3 | 0.71 | 3.45 | 0.56 | 4.56 | 3.89 | 6.66 | 1.01 | 17.12 | 23.51 |
| CDX2 | 1.53 | 0.95 | 1.26 | 6.74 | 2.80 | 2.58 | 1.63 | 5.78 | 5.00 |
| CHFR | 18.70 | 118.33 | 25.49 | 8.72 | 0.02 | 0.01 | 4.28 | 3.63 | 6.27 |
| CTNNB1 | 0.17 | 3.83 | 3.87 | 0.08 | 0.85 | 0.86 | 1.19 | 40.25 | 20.37 |
| DAB2IP | 0.29 | 7.39 | 1.21 | 0.19 | 0.25 | 0.15 | 0.66 | 59.20 | 49.11 |
| DAPK1 | 0.00 | 1.53 | 106.13 | 0.02 | 4.04 | 7.98 | 1.18 | 10.34 | 5.56 |
| DIRAS3 | 1.06 | 1.10 | 1.17 | 0.99 | 0.66 | 0.68 | 1.05 | 0.94 | 1.01 |
| DKK3 | 2.20 | 1.34 | 1.23 | 0.72 | 1.12 | 0.44 | 1.44 | 8.53 | 7.01 |
| DLC1 | 0.00 | 1.26 | 0.92 | 0.85 | 0.00 | 0.00 | 7.66 | 99.61 | 112.60 |
| E2F1 | 0.27 | 5.45 | 5.12 | 0.17 | 0.05 | 0.23 | 0.35 | 36.45 | 31.53 |
| EGFR | 4.80 | 9.03 | 6.43 | 2.12 | 3.76 | 1.72 | 3.20 | 60.92 | 62.87 |
| ERBB2 | 0.11 | 261.15 | 1217.09 | 43.85 | 81.00 | 37.18 | 4.41 | 2.58 | 1.80 |
| ESR1 | 0.19 | 2.62 | 0.06 | 0.68 | 4.02 | 1.50 | 0.59 | 3.21 | 2.61 |
| FAS | 1.76 | 6991.10 | 1.60 | 1989.74 | 950.87 | 760.96 | 2.33 | 4.05 | 4.12 |
| FHIT | 0.38 | 5508.63 | 3124.61 | 363.48 | 92.82 | 71.53 | 3.95 | 4.05 | 4.23 |
| FOS | 0.49 | 15.59 | 0.73 | 2.01 | 3.24 | 0.87 | 0.37 | 15.50 | 8.84 |
| GSTP1 | 0.00 | 1.35 | 1.66 | 0.03 | 0.03 | 26.87 | 2.90 | 8.80 | 8.09 |
| HIC1 | 1.38 | 14.27 | 23.17 | 0.75 | 0.24 | 0.48 | 0.34 | 59.30 | 57.97 |
| HOXA1 | 1.32 | 2.19 | 0.09 | 0.21 | 0.47 | 0.37 | 0.66 | 19.94 | 17.39 |
| HRAS | 0.77 | 4.21 | 3.24 | 0.76 | 1.12 | 0.33 | 0.47 | 87.92 | 39.22 |
| IGF2 | 0.45 | 1.58 | 2.16 | 0.17 | 0.15 | 0.07 | 0.95 | 12.00 | 11.70 |
| IGF2R | 0.13 | 0.21 | 0.54 | 1.98 | 0.19 | 0.05 | 2.14 | 18.12 | 14.44 |
| ING1 | 0.64 | 6.94 | 5.32 | 0.36 | 0.47 | 0.31 | 0.50 | 31.44 | 32.27 |
| JUN | 5316.44 | 26919.04 | 51.12 | 0.54 | 3753.93 | 1989.86 | 845.47 | 128.65 | 54.72 |
| LOX | 3.05 | 0.53 | 4.13 | 505.04 | 140.64 | 5.93 | 1.93 | 0.31 | 0.71 |
| MDM2 | 0.71 | 35.07 | 24.20 | 0.84 | 2.32 | 2.44 | 0.67 | 1.43 | 45.85 |
| MGMT | 6.34 | 19.58 | 28.81 | 1.22 | 2.73 | 0.47 | 0.55 | 14.52 | 16.07 |
| MLH1 | 1256.04 | 9496.33 | 5260.45 | 205.37 | 5.20 | 881.63 | 2.89 | 1.32 | 0.91 |
| MYC | 1.45 | 0.00 | 0.76 | 0.45 | 2023.24 | 746.74 | 1.48 | 0.30 | 0.03 |
| MYCN | 1.29 | 108.01 | 64.28 | 0.07 | 0.02 | 1.71 | 5.20 | 28.29 | 23.87 |
| NEUROG1 | 2.46 | 0.98 | 2.34 | 0.54 | 0.10 | 0.20 | 0.45 | 15.89 | 10.95 |
| NF1 | 1.26 | 2.40 | 9.92 | 42.96 | 79.01 | 0.01 | 51.03 | 62.06 | 88.05 |
| NF2 | 0.76 | 5.45 | 2.91 | 0.34 | 0.10 | 0.32 | 0.90 | 51.78 | 33.09 |
| NFKB1 | 81.26 | 6.58 | 356.75 | 0.12 | 1.57 | 0.07 | 0.90 | 7.17 | 8.30 |
| NME1 | 0.22 | 1.28 | 101.81 | 0.30 | 31.26 | 0.03 | 0.84 | 3.92 | 4.07 |
| OPCML | 14.20 | 8.54 | 16.76 | 1.11 | 0.96 | 1.31 | 1.59 | 18.64 | 26.51 |
| PDLIM4 | 0.64 | 0.93 | 0.53 | 1.47 | 1.58 | 0.82 | 1.72 | 1.86 | 2.33 |
| PRDM2 | 0.00 | 0.03 | 3.16 | 0.23 | 0.32 | 0.00 | 10.24 | 3.50 | 1.51 |
| PTCH1 | 56.05 | 442.50 | 156.48 | 0.39 | 18.09 | 26.51 | 0.04 | 15.14 | 7.51 |
| PTEN | 0.03 | 0.58 | 1.85 | 11.97 | 0.63 | 26.16 | 1.44 | 8.07 | 6.41 |
| PTGS2 | 0.00 | 1.87 | 1.14 | 0.92 | 0.87 | 0.00 | 5.37 | 85.92 | 84.77 |
| PYCARD | 0.25 | 5.01 | 1.09 | 0.14 | 0.11 | 0.03 | 0.59 | 51.27 | 51.83 |
| RARB | 0.52 | 0.29 | 1.15 | 1.21 | 1.35 | 2.06 | 1.77 | 2.11 | 1.91 |
| RASSF1 | 18.27 | 1.46 | 0.45 | 0.07 | 0.10 | 0.83 | 1.25 | 4.25 | 9.02 |
| RB1 | 320.29 | 1869.84 | 1446.38 | 0.50 | 1251.18 | 0.32 | 0.53 | 0.16 | 0.55 |
| RET | 1.12 | 2.57 | 3.66 | 0.05 | 1.32 | 0.04 | 0.40 | 21.52 | 15.68 |
| RUNX3 | 1.00 | 1.00 | 1.00 | 1.19 | 1.20 | 0.60 | 0.97 | 1.01 | 1.01 |
| SCGB3A1 | 0.69 | 1.74 | 2.87 | 0.23 | 0.03 | 0.09 | 0.65 | 6.18 | 7.96 |
| SFN | 1.01 | 1.00 | 0.99 | 1.00 | 1.01 | 1.01 | 1.01 | 0.99 | 1.00 |
| SFRP1 | 2.51 | 2.61 | 0.24 | 1.23 | 0.79 | 0.41 | 0.63 | 65.43 | 55.00 |
| SFRP2 | 0.88 | 2.71 | 1.71 | 1.09 | 0.92 | 0.58 | 3.23 | 34.95 | 35.53 |
| SH3PXD2A | 0.71 | 1.53 | 104.72 | 0.93 | 1.75 | 0.04 | 2.59 | 47.78 | 46.85 |
| SLC5A8 | 1.36 | 0.94 | 2.57 | 1.86 | 0.93 | 2.45 | 1.19 | 0.00 | 0.00 |
| SMAD4 | 0.76 | 127.07 | 8.74 | 0.43 | 6.41 | 0.16 | 10.61 | 235.61 | 218.71 |
| SMARCB1 | 0.24 | 1277.57 | 583.50 | 11.80 | 124.16 | 3.01 | 0.88 | 33.11 | 30.62 |
| SOCS1 | 0.47 | 0.28 | 0.24 | 0.30 | 0.85 | 0.29 | 0.63 | 35.94 | 37.64 |
| MEN1 | 0.00 | 2.11 | 1.40 | 0.02 | 0.02 | 0.20 | 0.24 | 81.65 | 51.71 |
| TERT | 0.69 | 1.13 | 1.35 | 0.14 | 0.65 | 0.85 | 0.69 | 107.25 | 98.54 |
| TGFB1 | 0.27 | 1.57 | 28.66 | 0.97 | 2.82 | 0.02 | 2.46 | 173.76 | 153.70 |
| TGFBR2 | 0.91 | 3.96 | 4.37 | 2.52 | 1.19 | 0.72 | 0.58 | 89.94 | 48.94 |
| THBS1 | 1.05 | 3.27 | 9.07 | 0.34 | 0.70 | 0.34 | 1.60 | 81.37 | 67.16 |
| TIMP3 | 0.23 | 1.24 | 2.06 | 0.33 | 0.32 | 0.32 | 0.74 | 45.87 | 36.39 |
| TP53 | 19.81 | 15.03 | 51.04 | 0.01 | 9.79 | 7.14 | 1.28 | 40.40 | 33.97 |
| TP73 | 1.18 | 2.90 | 2.91 | 3.38 | 1.25 | 2.20 | 2.33 | 1.18 | 1.50 |
| TSC1 | 0.35 | 0.91 | 2.87 | 0.13 | 0.50 | 0.26 | 0.55 | 22.08 | 22.08 |
| TSC2 | 0.76 | 2.38 | 1.86 | 0.10 | 1.96 | 0.56 | 0.58 | 19.21 | 15.16 |
| VEGFA | 1.14 | 0.15 | 2.99 | 4.88 | 3.80 | 0.11 | 0.87 | 20.59 | 24.02 |
| VHL | 758.05 | 521.60 | 1.61 | 48.43 | 0.03 | 0.02 | 0.00 | 4.64 | 4.67 |
| WIF1 | 0.86 | 26.73 | 1.85 | 1.40 | 0.73 | 0.45 | 1.40 | 86.15 | 49.67 |
| WT1 | 0.49 | 0.26 | 0.22 | 0.91 | 0.56 | 0.22 | 1.65 | 50.66 | 32.65 |
| WWOX | 0.01 | 2.32 | 1.65 | 0.05 | 1.05 | 1.03 | 3.71 | 16.75 | 15.30 |
| XRCC1 | 0.72 | 6.64 | 1.91 | 0.00 | 0.35 | 0.31 | 1.07 | 36.70 | 43.30 |
| ZMYND10 | 0.42 | 2.49 | 1.44 | 1.71 | 2.69 | 1.77 | 1.26 | 2.58 | 1.93 |
In Vitro EBV Infection Causes Global Transcriptional Repression of TSGs.
To assess the distribution of methylation values in uninfected resting PBMCs and in vitro virally infected PBMCs, we calculated the percent methylation value for each promoter and subsequently plotted using an excel sheet to generate the heat map (Fig. 1). The results are depicted as four significantly different categories that represented the methylation patterns: (i) gain of methylation, (ii) loss of methylation, (iii) distinct methylation status, and (iv) fluctuating methylation status. The third category is distinct in such a way that the methylation status of many promoters in this category was significantly up-regulated by 2-d infection followed by down-regulation and vice versa. This might be because of EBV hyperproliferation, as demonstrated earlier by Nikitin et al. (16). The third category included 25 genes: ABL1, CAV1, CCND2, CDH13, CDX2, DKK3, DLC1, E2F1, GSTP1, IGF2, IGF2R, NFKB1, PTEN, PTGS2, RASSF1, SFN, SLC5A8, MEN1, TERT, TIMP3, TSC1, TSC2, VHL, WWOX, and ZMYND10 (Fig. 1). Genes with increasing methylation status included 40 genes: ABCB1, AKT1, ATM, BCL2, BRAF, CADM1, CDKN1A, CDKN1B, CDKN2A, CDKN2B, CTNNB1, DAPK1, DIRAS3, EGFR, ERBB2, HIC1, HRAS, ING1, MDM2, MGMT, MLH1, MYCN, NF1, NF2, NME1, OPCML, PRDM2, PTCH1, RB1, RET, RUNX3, SCGB3A1, SFRP2, SH3PXD2A, SMARCB1, TGFB1, TGFBR2, THBS1, TP53, and TP73 (Fig. 1). Only six candidate genes showed methylation status with decreasing trend: APC, HOXA1, MYC, SFRP1, SOCS1, and WT1 (Fig. 1). The fourth category included 25 genes that showed a fluctuating methylation profile over the 15-d postinfection. These are: BCR, BIRC5, BRCA1, BRCA2, CCND1, CD44, CDH1, CDKN1C, CDKN3, CHFR, DAB2IP, ESR1, FAS, FHIT, FOS, JUN, LOX, NEUROG1, PDLIM4, PYCARD, RARB, SMAD4, VEGFA, WIFI, and XRCC1 (Fig. 1).
To corroborate the methylation profile into transcriptional profile, we further selected a total of 29 genes covering all four categories, which were subsequently subjected to real-time PCR analyses using a similar experimental setting (Fig. 1, red). The primers for quantitative PCR of the selected genes are listed in Table S4. The selected genes were categorized into three groups, which included cell-cycle (20 genes), apoptosis (14 genes), and DNA-damage repair (10 genes) (Fig. 2 A–C). In addition, a total of five viral transcripts—including BZLF1, EBNA1, EBNA2, EBNA3C, and LMP1—were also analyzed to confirm EBV infection of the primary B lymphocytes (Fig. 2D), as previously described (15). As expected, BZLF1 expression at 2-d postinfection indicated a lytic mode of infection followed by a latent period as seen by a loss of signal by 15-d postinfection (Fig. 2D). The establishment of latency was also demonstrated by steady expression levels of EBNA1, EBNA2, EBNA3C, and LMP1 throughout 15 d of postinfection (Fig. 2D, yellow to green). As described above, the real-time PCR data from resting (0 d) along with different time points (2, 7, 15 d) of EBV-infected PBMCs were analyzed and presented as a heat map (Fig. 2 A–C). The results demonstrated that the transcription profiles of the selected genes were inversely proportional to that of methylation-profiles (compare Figs. 1 and 2). This finding indicated that in vitro EBV infection of resting B lymphocytes can globally repress TSGs expression through regulation of their CpG methylation status.
Table S4.
List of primers used in this study for transcript analyses
| Serial no. | Gene name | Primers for transcript analyses* |
| 1 | MYC | Rp: 5′-CACCGAGTCGTAGTCGAGGT-3′ |
| Lp: 5′-GCTGCTTAGACGCTGGATTT-3′ | ||
| 2 | ING1 | Rp: 5′-GCACTCGTCTAGCTCCTTCA-3′ |
| Lp: 5′-CCAAACTGAGTACCGGGAGA-3′ | ||
| 3 | CDN1C | Rp: 5′-TTCTCAGGCGCTGATCTCTT-3′ |
| Lp: 5′-AGCTGCACTCGGGGATTT-3′ | ||
| 4 | CDKN1B | Rp: 5′-CATTCCATGAAGTCAGCGAT-3′ |
| Lp: 5′-CGTCAAACGTAAACAGCTCG-3′ | ||
| 5 | VHL | Rp: 5′-GTGTGTCCCTGCATCTCTGA-3′ |
| Lp: 5′-CCGTATGGCTCAACTTCGAC-3′ | ||
| 6 | RASSF1 | Rp: 5′-AGGTGTCTCCCACTCCACAG-3′ |
| Lp: 5′-GCTACTGCAGCCAAGAGGAC-3′ | ||
| 7 | TP73 | Rp: 5′-CCCCATCAGGGGAGGTG-3′ |
| Lp: 5′-AGGGGACGCAGCGAAAC-3′ | ||
| 8 | TP53 | Rp: 5′-GCTCGACGCTAGGATCTGAC-3′ |
| Lp: 5′-GCTTTCCACGACGGTGAC-3′ | ||
| 9 | MDM2 | Rp: 5′-CTGATCCAACCAATCACCTG-3′ |
| Lp: 5′-AAGCCTGGCTCTGTGTGTAA-3′ | ||
| 10 | CDKN2A | Rp: 5′-GTGAGAGTGGCGGGGTC-3′ |
| Lp: 5′-GTTACGGTCGGAGGCCG-3′ | ||
| 11 | CDKN1A | Rp: 5′-CATGGGTTCTGACGGACAT-3′ |
| Lp: 5′-AGTCAGTTCCTTGTGGAGCC-3′ | ||
| 12 | RB1 | Rp: 5′-CCTTCTCGGTCCTTTGATTG-3′ |
| Lp: 5′-CAGAAGGCAACTTGACAAGAGA-3′ | ||
| 13 | E2F1 | Rp: 5′-TCTCGGCCAGGTACTGATG-3′ |
| Lp: 5′-ACCCTGACCTGCTGCTCTT-3′ | ||
| 14 | CCND1 | Rp: 5′-AGTTGTTGGGGCTCCTCAG-3′ |
| Lp: 5′-AGACCTTCGTTGCCCTCTGT-3′ | ||
| 15 | CCND2 | Rp: 5′-ACGGTACTGCTGCAGGCTAT-3′ |
| Lp: 5′-AGCTGCTGGCTAAGATCACC-3′ | ||
| 16 | GAPD | Rp: 5′-TTGAGGTCAATGAAGGGGTC-3′ |
| Lp: 5′-GAAGGTGAAGGTCGGAGTCA-3′ | ||
| 17 | NFKB1 | Rp: 5′-TTGCTGGTCCCACATAGTTG-3′ |
| Lp: 5′-ATGTATGTGAAGGCCCATCC-3′ | ||
| 18 | PTEN | Rp: 5′-CGGTGTCATAATGTCTTTCAGC-3′ |
| Lp: 5′-TGAAGGCGTATACAGGAACAAT-3′ | ||
| 19 | TGFB1 | Rp: 5′-GCAGAAGTTGGCATGGTAGC-3′ |
| Lp: 5′-CCCTGGACACCAACTATTGC-3′ | ||
| 20 | XRCC1 | Rp: 5′-CCATCATTCCCAATGTCCA-3′ |
| Lp: 5′-GACACTTACCGAAAATGGCG-3′ | ||
| 21 | APC | Rp: 5′-TCTTCAGTGCCTCAACTTGC-3′ |
| Lp: 5′-GGAGACAGAATGGAGGTGCT-3′ | ||
| 22 | MGMT | Rp: 5′-GAAATAGGCATTCAGCCAGG-3′ |
| Lp: 5′-GGGTCTGCACGAAATAAAGC-3′ | ||
| 23 | THBS1 | Rp: 5′-TTGCCACAGCTCGTAGAACA-3′ |
| Lp: 5′-CAATGCCACAGTTCCTGATG-3′ | ||
| 24 | ABCB1 | Rp: 5′-ATTCCTCGAGAAACTGCGAA-3′ |
| Lp: 5′-TCACTTCAGGAAGCAACCAG-3′ | ||
| 25 | ERBB2 | Rp: 5′-AGCATGTCCAGGTGGGTCT-3′ |
| Lp: 5′-CTCCTCCTCGCCCTCTTG-3′ | ||
| 26 | GSTP1 | Rp: 5′-CTCAAAAGGCTTCAGTTGCC-3′ |
| Lp: 5′-ACCTCCGCTGCAAATACATC-3′ | ||
| 27 | SMAD4 | Rp: 5′-AACAGCTAACGTTGCAAGGAA-3′ |
| Lp: 5′-CGGTAACGGAGCGGTTT-3′ | ||
| 28 | HRAS | Rp: 5′-CCAGCTTATATTCCGTCATCG-3′ |
| Lp: 5′-CAGTCGCGCCTGTGAAC-3′ | ||
| 29 | SOCS1 | Rp: 5′-CACATGGTTCCAGGCAAGTA-3′ |
| Lp: 5′-CTACCTGAGCTCCTTCCCCT-3′ | ||
| 30 | DNMT1 | Rp: 5′-TTCTGTTAAGCTGTCTCTTTCCA-3′ |
| Lp: 5′-TGCTGAAGCCTCCGAGAT-3′ | ||
| 31 | DNMT2 | Rp: 5′-TCATTAGCGACAGTGTTGACATC-3′ |
| Lp: 5′-GTGCTGGAGCTATACAGCGG-3′ | ||
| 32 | DNMT3A | Rp: 5′-ATTCCTTCTCACAACCCGC-3′ |
| Lp: 5′-TACTTCCAGAGCTTCAGGGC-3′ | ||
| 33 | DNMT3B | Rp: 5′-TCTCCATTGAGATGCCTGGT-3′ |
| Lp: 5′-GAGATTCGCGAGCCCAG-3′ | ||
| 34 | DNMT3L | Rp: 5′-GCCGTACACAAGATCGAAGG-3′ |
| Lp: 5′-GTTCTGACCCGGGACAACT-3′ | ||
| 35 | MBD1 | Rp: 5′-TCGAGTCAGCTCAACTTTGC-3′ |
| Lp: 5′-AAGTCTTTCGCAAGTCAGGG-3′ | ||
| 36 | MBD2 | Rp: 5′-CCTTTGGGTAGTTCCATGGTT-3′ |
| Lp: 5′-CAACGAATGAATGAACAGCC-3′ | ||
| 37 | MBD3 | Rp: 5′-GAAGTCGAAGGTGCTCAGGT-3′ |
| Lp: 5′-GGCCACAGGGATGTCTTTTA-3′ | ||
| 38 | MBD4 | Rp: 5′-TCTGTGTTCGTGGGATGGTA-3′ |
| Lp: 5′-AACGTGGCTCTGAAATGGAC-3′ | ||
| 39 | MECP2 | Rp: 5′-TTGAGGGGTTTGTCCTTGAG-3′ |
| Lp: 5′-CAGCTCCAACAGGATTCCAT-3′ | ||
| 40 | HDAC1 | Rp: 5′-CATCTCCTCAGCATTGGCTT-3′ |
| Lp: 5′-CGAATCCGCATGACTCATAA-3′ | ||
| 41 | HDAC2 | Rp: 5′-ATGAGGCTTCATGGGATGAC-3′ |
| Lp: 5′-ATGGCGTACAGTCAAGGAGG-3′ | ||
| 42 | HDAC3 | Rp: 5′-CTGTGTAACGCGAGCAGAAC-3′ |
| Lp: 5′-GCAAGGCTTCACCAAGAGTC-3′ | ||
| 43 | HDAC4 | Rp: 5′-CTGGTCTCGGCCAGAAAGT-3′ |
| Lp: 5′-CGTGGAAATTTTGAGCCATT-3′ | ||
| 44 | HDAC5 | Rp: 5′-GAACTGGGCATGGCTCTTG-3′ |
| Lp: 5′-GGGAACCATCCTTGGAAATC-3′ | ||
| 45 | HDAC6 | Rp: 5′-GCGGTGGATGGAGAAATAGA-3′ |
| Lp: 5′-CCGGAGGGTCCTTATCGTAG-3′ | ||
| 46 | HDAC7A | Rp: 5′-CCTGCTGTTGTCACCGC-3′ |
| Lp: 5′-TCCTCTCCAGCTCAGAGACC-3′ | ||
| 47 | HDAC8 | Rp: 5′-GCGTGATTTCCAGCACATAA-3′ |
| Lp: 5′-ATACTTGACCGGGGTCATCC-3′ | ||
| 48 | HDAC9 | Rp: 5′-GCCCACAGGAACTTCTGACT-3′ |
| Lp: 5′-GAACTCTAAGCCAGATGGGG-3′ | ||
| 49 | HDAC10 | Rp: 5′-GAACAGCCACATCCAGGG-3′ |
| Lp: 5′-CCTCTTAGATGGGATGCTGG-3′ | ||
| 50 | HDAC11 | Rp: 5′-AAGGAAGTTGGGGAGGAAGA-3′ |
| Lp: 5′-GCACACGAGGCGCTATCTTA-3′ |
Primers were designed using primerdepot.nci.nih.gov/.
Fig. 2.

Gene-expression analyses of selected TSGs and viral transcripts in response to EBV infection of resting PBMCs. In a similar experimental set-up as described in Fig. 1, total RNA was isolated at indicated days (0-, 2-, 7-, and 15-d postinfection) from resting PBMCs infected with BAC-GFP-EBV, converted to cDNA, and subjected to real-time PCR for the indicated cellular (A–C) and viral transcripts (D) using SYBR green PCR master mix as per the manufacturer’s protocol. Similar experiments were carried out for three independent donors and a representative figure is shown from donor 2. Relative transcriptional changes are represented with respect to the day 0 uninfected sample, and displayed as a heat map normalized separately for individual gene expressions.
In Vitro EBV Infection Is Associated with Deregulation of Chromatin-Modifying and -Remodeling Factors.
Chromatin-modifying enzymes and chromatin-remodeling factors are differentially expressed in tumor cells compared with normal cells. This finding suggests a critical role for these genes in driving the oncogenic process, including development of EBV-associated B-cell lymphoma (17, 18). Similar to studies described above, the total cDNA was generated from uninfected and infected B cells at the indicated time points and subjected to PCR-array analyses for epigenetic chromatin-modification enzymes and human epigenetic chromatin-remodeling factors (Fig. 3 A and B, respectively).
Fig. 3.

PCR array analysis for chromatin-modification enzymes and chromatin-remodeling factors in response to EBV infection in resting PBMCs. In a similar experimental set-up as described in Figs. 1 and 2, total RNA was isolated from ∼10 million PBMCs infected with BAC-GFP-EBV at different time points (days 0, 2, 7, and 15 postinfection), cDNA was made and subjected to PCR array analyses using (A) “Epigenetic Chromatin Modification Enzymes PCR Array” and (B) “Human Epigenetic Chromatin Remodeling Factors PCR Array” from SABiosciences, according to the manufacturer’s instructions for two independent donors. The relative changes in transcripts using the 2−ΔΔCt method were represented as a heat map in comparison with the day 0 uninfected sample control for donor 1. The red marked transcripts—particularly HDACs, DNA methyl transferases, and methyl binding proteins—were chosen for further analyses.
The results demonstrated a global transcriptional alteration of these genes in both the chromatin-modifying and chromatin-remodeling categories in response to EBV infection of resting B lymphocytes (Fig. 3 A and B, respectively). The results showed that the transcript levels of de novo DNA methyltransferase enzymes DNMT3A and DNMT3B, but not DNMT1, gradually increased in response to EBV infection of resting B cells (Fig. 3A). Interestingly, the transcript levels of DNA CpG-methyl binding domain (MBD) genes MBD1, MBD3, MBD4, and MeCP2, except MBD2 were significantly down-regulated (Fig. 3B). In addition, the histone deacetylase enzymes (HDACs 1–11) were in general, notably up-regulated by 2-d postinfection and maintained the level throughout the course of infection (Fig. 3A).
The exclusion of acetyl groups by HDACs facilitates chromatin compaction and thus causes transcriptional inhibition (19). To corroborate the data above we further selected these genes (Fig. 3, red) and performed real-time PCR analyses using a similar in vitro infection set-up as well as compared transcripts from established LCLs with resting B cells (Fig. 4 A and B, Upper and Lower, respectively). The results further showed that EBV infection specifically elevated DNMT3B expression along with DNMT3L during the course of infection, but not DNMT1 or DNMT2 (Fig. 4A). We chose DNMT2 in this category because of its sequence homology to other DNMTs (20). However, the specific catalytic domain for DNA methylation has not been identified; rather, DNMT2 has been found to methylate RNA instead of DNA (20). In contrast, having sequence homology to both DNMT3A and DNMT3B, and with no catalytic domain, DNMT3L was found to enhance their de novo DNMT activities by increasing their ability to bind to the methyl group donor, S-adenosyl-l-methionine (20). In both experimental set-ups DNMT3A was expressed at a lower level compared with DNMT3B and DNMT3L, suggesting that EBV infection of primary B lymphocytes specifically recruited a complex of DNMT3B/3L to regulate cellular gene expression (Fig. 4A). Interestingly, we could not find any specific differences in HDAC expression level but rather a full-blown induction of all 11 HDACs in response to EBV infection of primary B cells (Fig. 4B).
Fig. 4.

Real-time PCR validation of selected DNMTs, MBDs, and HDACs in response to EBV infection. (A and B) Total RNA was isolated from either PBMCs infected with BAC-GFP-EBV at different postinfection time points (0, 2, 7, and 15 d) or EBV-induced in vitro transformed LCLs. cDNA was made and subsequently subjected to real-time PCR analyses for the selected genes. The difference of individual gene expressions compared with uninfected PBMC samples is represented as a heat map. Similar experiments were carried out for two independent donors and a representative figure is shown for donor 1. (C) The cartoon diagram represents the working model of global repression of TSGs through epigenetic modification.
Expression patterns of MBDs, DNMTs, and HDACs were also extended using EBV− (BJAB and BL41) and EBV+ (Jijoye and BL41-B95.8) Burkitt’s lymphoma (BL) cells (Fig. S2). The results demonstrated that the expression pattern of both MBDs, except MeCP2, and HDACs, closely resembled that of primary B-lymphocyte infection. Interestingly, MeCP2 was shown to be up-regulated in EBV+ BL cells in comparison with negative lines (Fig. S2). However, in contrast, the expression pattern of DNMTs in EBV+ BL lines showed a rather stochastic pattern (Fig. S2). This result might be because of differences that exist in the genetic background of the different BL cells compared with primary infection using PBMCs isolated from healthy individuals. Overall, these results provide additional clues that chromatin-modifying and -remodeling factors may function in collaboration with methylation activities to regulate TSG expression during EBV infection of primary B cells. Elucidating the underlying mechanisms would increase our understanding of EBV-associated B-cell lymphomagenesis (Fig. 4C, model).
Fig. S2.

Expression analyses of DNMTs, MBDs, and HDACs in EBV− and EBV+ B cells. Total RNA was isolated from freshly cultured 10 million of both EBV− BJAB and BL41 cells and EBV+ Jijoyee and BL41-B95.8. cDNA was made and subsequently subjected to real-time PCR analyses for the indicated genes. The difference of individual gene expressions in EBV+ cells compared with EBV− cells is represented as a heat map. The results shown are representative of three independent experiments.
Inhibition of DNMT Activity Accelerates Gene Transcription in Infected B Cells.
To further validate this model, transcription analyses were performed on a comprehensive list of TSGs in the presence and absence of the DNMT inhibitor, 5′-azacytidine (Aza) using in vitro EBV-transformed LCLs (LCL1, LCL2, and GFP-LCLs) in addition to EBV-infected PBMCs at 7-d postinfection (Fig. 5A). Aza is a potent DNMT inhibitor (14, 20), and is associated with lytic cycle activation in EBV-transformed B cells through demethylation of BZLF1 and BRLF1 viral gene promoter sequences (21). As expected, association of methyl groups with the CpG elements of selected promoters appeared to be significantly deactivated (P < 0.001) in the presence of the methyltransferase inhibitor, which as a result demonstrated an increase in transcription in each experiment (yellow to green, Fig. 5A, Upper). However, Aza treatment did not cause any transcriptional alteration of DNMT1 (green to green, Fig. 5A, Upper), suggesting that either DNMT1 itself is not regulated by methylation or that its expression levels were already at maximum. Interestingly, Aza treatment caused an overall transcriptional activation of all of the selected viral genes, including both lytic gene BZLF1 to four different latent genes, EBNA1, EBNA2, EBNA3C, and LMP1 (Fig. 5A, Lower). The results implied that DNA methylation plays an important role not only in regulating cellular gene expression but also to critically participate in temporal expression of viral genes. To corroborate the impact of deregulated TSGs and viral gene-expression profiles in response to Aza on EBV-infected lymphoblastoid cell growth, we further performed cell proliferation and cell viability assays using three different LCLs, as indicated (Fig. 5B). The results demonstrated that Aza treatment caused a drastic reduction of both cell growth and cell viability in comparison with DMSO controls (Fig. 5B, Left and Right, respectively).
Fig. 5.

Real-time PCR analyses of the selected genes in the presence and absence of 5′-azacytidine treatment. (A) Total RNA was isolated from either DMSO or 50 μM Aza-treated 10 million PBMCs infected with BAC-GFP-EBV at 7-d postinfection, and three different LCL clones (GFP-LCL10, LCL1, and LCL2) for 12 h. Subsequently, cDNA was generated and subjected to real-time PCR analyses for the selected genes as described in Materials and Methods. The difference in individual gene expression (fold-change) compared with the DMSO control is represented as a heat map. (B) Approximately 0.3 × 10⁵ LCL clones were plated into each well of the six-well plates, exposed to either 1 µM Aza or DMSO vehicle control treatment for 3 d at 37 °C humidified CO2 chamber. Cell viability was determined through the Trypan blue exclusion method and only viable cells were counted every 24 h using an automated cell counter. Experiments were performed in duplicate and repeated two times.
Taken together, these data provide, to our knowledge, the first evidence of the importance of specific DNA methylating enzymes in regulating transcription of TSGs during EBV infection of primary B lymphocytes. This finding offers insight into the hierarchy of the cellular machinery required to establish latent viral infection followed by development of B-cell lymphoma.
Discussion
Epigenetic mechanisms including C5-methylation at CpG dinucleotides, and the covalent histone modification through the attachment of acetyl-, methyl-, or phosphate groups, which leads to either transcriptional repression or activation, play an indispensable role in development of human cancers. Tumor viruses contribute to ∼20% of all human cancers (22, 23). Epstein–Barr virus, one of the prominent human oncogenic viruses associated with a number of epithelial and lymphoid cancers (23, 24), is an excellent model system to investigate the epigenetic reprogramming events that occur during in vitro B-cell transformation important for development of LCLs.
Earlier studies primarily focused on delineating the epigenetic mechanisms that orchestrate silencing of EBV latency gene expression during establishment of latency programs within B lymphocytes and subsequent reactivation of lytic genes (4, 14, 25). However, there were no studies demonstrating how EBV reprograms the cellular gene-expression profiles during primary B-cell infection, which eventually leads to B-cell lymphomagenesis. In this study, we investigated the acquisition of DNA-methylation in CpG islands of TSGs during EBV infection of primary B-cell transformation. As seen in most human cancers, including EBV-associated cancers (14), our results also showed deregulation of tumor suppressors and cell-cycle checkpoints at both G1/S and G2/M transitions, namely Rb1/E2F1 and TP53/MDM2 arms, through alteration of CpG methylation. We and others have previously shown that EBV infection and expression of a number of viral latent proteins can specifically target these two important tumor-suppressor arms through multiple mechanisms (24, 26–28). We now provide further clues that demonstrate additional molecular mechanisms, which regulate TSG expression and therefore contribute to subsequent B-cell transformation.
Although the overall degree of DNA methylation decreases with tumor progression, the methylation frequency at CpG islands and histone modifications is increased (29). Methylation patterns at CpG islands are now considered a hallmark of cancer development (29). Furthermore, epigenetic imbalance of both oncogenes and TSGs are associated with a number of EBV-associated cancers, including BL, Hodgkin’s lymphoma (HL), NPC, and GC (11–14). Indeed, TSGs in general were found to often be inactivated through CpG-methylation compared with overall mutations (29). CpG methylation of TSGs thus could be used as prognostic markers as well as development of potential therapeutic avenues in EBV-associated cancers. In agreement with this, our results depicted a similar outcome and suggested a model where in vitro EBV infection of primary B lymphocytes led to significant changes in the methylation profile of TSGs, which ultimately contributes to development of B-cell lymphoma.
A number of genome-wide differential screens for methylated genes were previously performed in response to methyltransferase inhibitor (Aza) -treated EBV+ GC lines compared with nontreated cells, along with various EBV-linked GC tissue samples (12, 30). The results demonstrated that several TSGs had an elevated methylation pattern in the primary GC samples (30). For example, elevated methylation of CDKN2A, GSTP1, TP73, and HOXA10 was shown to be associated with EBV-associated GC tissue samples (30), suggesting that EBV induces global epigenetic disruption of the cellular genome in development of GC. Interestingly, our results reflected a similar elevated methylation pattern of these genes on EBV infection of PBMCs. Likewise, differential gene expression and microarray analyses on various EBV+ NPC tissue samples, along with other established cell lines, demonstrated a number of TSGs with a high frequency of methylation (31). These include CDH1 (E-cadherin), OPCML, the metalloproteases ADAMTS9 and ADAMTS18, Lactotransferrin (LTF), IRF8 (IFN regulatory factor 8), EDNRB (endothelin receptor type B), RASAL (Ras GTPase-activating-like protein), CMTM5 (CKLF-like MARVEL transmembrane domain containing member 5), RASSF1A, RARβ2 (retinoic acid receptor ß2), cellular retinol binding proteins CRBP1 and CRBP4, and RARRES/TIG1 (retinoic acid receptor responder/tazarotene induced gene 1) (14, 32–34). Interestingly, the OPCML gene (opioid binding protein/cell adhesion molecule-like) was earlier shown to be highly methylated in NPC, BL, and HL (35). Our results show a similar trend in OPCML CpG methylation on EBV infection of PBMCs, indicating that inactivation of OPCML transcription is highly associated with development of EBV-associated cancers from epithelial as well as lymphoid origin. In contrast, methylation of RARB and RASSF1 did not show any specific pattern. Compared with these endothelial carcinomas, a similar approach was conducted in the EBV-associated B-cell lymphomas BL and HL, using microarray technologies (36, 37). Broad-spectrum TSGs and genes involved in cell-cycle control, apoptosis, intracellular signaling, proliferation, and surface adhesion were frequently methylated in BL tumors, such as CCND2, CDKN1C (p57/kinase inhibitor protein 2), GADD45G (growth arrest and DNA damage inducible 45G), PLK2 (Polo-like serine-threonine kinase 2), FHIT (fragile histidine triad), MAPK10/JNK3 (mitogen activated protein kinase 10/jun N-terminal kinase 3), PTPN13/FAP1 (protein tyrosine phosphatase), Wnt-signaling inhibitor WNT5A, proto-cadherin 10 (PCDH10), DLC1 (deleted in liver cancer 1) (14, 37). Interestingly, the methylation pattern of CCND2, CDKN1C, FHIT, and DLC1 showed a similar trend as demonstrated in this study. Similarly, a tissue microarray analysis on multiple HL biopsies showed that Hodgkin and Reed–Sternberg tumor cells harbor multiple alterations of major tumor-suppressor pathways and cell-cycle checkpoints (36). In contrast to BL, DAPK (death associated protein kinase) was found to be methylated at a low frequency in HL tissues (38), as well as in our studies at a much later stage during infection.
Several lines of evidence have earlier shown that the NF-κB signaling pathway plays a major role in EBV induced B-cell proliferation (39). However, in contrast, the precise role of NF-κB signaling during the early stages of EBV-infection of naïve B lymphocytes has not been studied extensively. Recently it has been shown that NF-κB targeted gene expression was attenuated during the early stages of infection (39). In agreement with this, our data also demonstrated a significant elevation of NF-κB promoter methylation by 15-d postinfection, which resulted in its delayed expression. Therefore, NF-κB signaling is important in maintenance of B-cell outgrowth and primary B-cell immortalization.
We now provide evidence for EBV-mediated differential recruitment of DNMT activities to regulate TSGs expression during B-cell transformation. A large number of TSGs involved in regulating a number of cellular signaling pathways were analyzed to determine their methylation status in response to EBV infection of naïve B lymphocytes. As discussed above, the methylation pattern of these TSGs were congruent with other EBV-associated tumors, demonstrating the differential methylation patterns of a large number of novel TSGs. Further analysis of the overall epigenetic reprogramming events and delineation of the specific roles of EBV latent antigens in epigenetic deregulation of the cellular genome will provide a more comprehensive understanding of the molecular mechanisms linked to viral pathogenesis, foremost during the period of early infection. Importantly, this work provides avenues for subsequent prognostic and therapeutic strategies targeting EBV-associated malignancies.
Materials and Methods
Ethics Statement.
The University of Pennsylvania School of Medicine Center for AIDS Research Immunology core provided human PBMCs from unidentified donors, with written consent. This is approved by the University of Pennsylvania Internal Review Board based on the Helsinki recommendations.
Cell Lines.
BJAB and BL41 are EBV− and BL41-B95.8 and Jijoye are EBV+ BL cell lines. BL41-B95.8 is the positive variant of BL41 using B95.8 virus. LCL clones #1 and #2 are human peripheral B cells transformed with B95.8 virus (27). The GFP-LCL clone #10 is also human peripheral B cells transformed with BAC-GFP-EBV, as previously described (15).
Infection of PBMCs with BAC-GFP-EBV.
PBMCs from healthy donors were obtained from University of Pennsylvania Immunology Core as previously described (15). Please refer to SI Materials and Methods for detailed descriptions of experimental procedures.
Methylprofiler.
For identification of promoter methylation pattern of TSGs, PBMCs were infected with wild-type GFP-tagged BAC-EBV and analyzed using Methyl-Profiler DNA Methylation PCR Array Systems (“SAbioscience-Methyl-Profiler™ DNA Methylation PCR Array System”, 335211, 384-well set-up; SABiosciences, Qiagen). Details are provided in SI Materials and Methods.
Real-Time Quantitative PCR.
Real-time quantitative PCR was carried out as previously described (27) using StepOne Plus Real-Time PCR System (Applied Biosystems). Details are provided in SI Materials and Methods.
Cell Proliferation and Cell Viability Assay.
Assays were performed based on standard Trypan blue exclusion method in duplicate and repeated two times using a BIO-RAD TC10 automated cell counter. Details are provided in SI Materials and Methods.
SI Materials and Methods
Infection of PBMCs with BAC-GFP-EBV.
PBMCs from healthy donors were obtained from the University of Pennsylvania Immunology Core. As described previously (15), ∼10 million PBMCs were mixed with virus supernatant in 1 mL of RPMI 1640 with 10% (vol/vol) FBS for 4 h at 37 °C. Cells were centrifuged for 5 min at 500 × g, and the supernatant discarded. Pelleted cells were resuspended in 2 mL of complete RPMI medium 1640 in six-well plates. EBV-GFP expression was visualized by fluorescence microscopy and used to quantify infection. The mRNA level of the infected cells was determined after different days (2-, 7-, 15-d postinfecton) in comparison with control cells (0-d postinfection).
Methylprofiler.
For identification of the promoter methylation pattern of TSGs, PBMCs were infected with wild-type GFP-tagged BAC-EBV and analyzed using Methyl-Profiler DNA Methylation PCR Array Systems (“SAbioscience-Methyl-Profiler™ DNA Methylation PCR Array System”, 335211, 384-well set-up, SABiosciences, Qiagen), which enables fast and accurate detection of DNA methylation status at CpG islands of cellular genes listed in Table S1. The assay was performed according to the manufacturer’s instructions. In brief, following digestion of DNA from ∼20 million PBMCs at different time points (0, 2, 7, and 15 d) with methylation-sensitive and -dependent restriction enzyme, the remaining input DNA was quantified with real-time PCR in each individual enzyme reaction using primer that flank the promoter region of interest. Data analysis is based on the 2−ΔΔCt method with normalization of the raw data to the uninfectecd sample. Data analysis was carried out using an algorithm provided by the manufacturer. This algorithm also includes the quality check to include or exclude the real-time PCR data points for individual genes. Relative change in the methylation status with respect to the day 0 control sample is displayed as a heat map normalized separately for individual gene promoters. As the number of CpG sites methylated in a targeted region can vary within the fraction of methylated input DNA, similar experiments were carried out for three independent donors.
Real-Time Quantitative PCR.
Total RNA was isolated using TRIzol reagent according to the manufacturer’s instructions (Invitrogen). cDNA was made by using a SuperScript II reverse-transcriptase kit (Invitrogen) according to the manufacturer’s instructions. The primers for indicated genes are described in Table S3. Quantitative real-time PCR analysis was done using StepOne Plus Real-Time PCR System (Applied Biosystems) in triplicate as previously described (27), using a 2−ΔΔCT method to quantify relative expression compared with housekeeping gene control (GAPDH).
Cell Proliferation and Cell Viability Assay.
Approximately 0.3 × 10⁵ LCLs (GFP-LCL10, LCL1, and LCL2) were plated into each well of the six-well plates, exposed to either 1 µM Aza (Sigma) or DMSO vehicle control treatment for 3 d at 37 °C in a humidified CO2 chamber. Viable cells from each well were counted by Trypan blue exclusion method every 24 h using a Bio-Rad TC10 Automated cell counter. Experiments were performed in duplicate and repeated two times.
Acknowledgments
This work was supported by National Cancer Institute at the National Institutes of Health public health service Grants CA137894, CA171979, CA174439, CA177423, P30-DK-050306, and P01-CA-174439 (to E.S.R.). A.S. is a Wellcome Trust/DBT India Alliance Intermediate fellow (IA/I/14/2/501537).
Footnotes
The authors declare no conflict of interest.
This article is a PNAS Direct Submission.
This article contains supporting information online at www.pnas.org/lookup/suppl/doi:10.1073/pnas.1503806112/-/DCSupplemental.
References
- 1.Luczak MW, Jagodziński PP. The role of DNA methylation in cancer development. Folia Histochem Cytobiol. 2006;44(3):143–154. [PubMed] [Google Scholar]
- 2.Robertson KD. DNA methylation, methyltransferases, and cancer. Oncogene. 2001;20(24):3139–3155. doi: 10.1038/sj.onc.1204341. [DOI] [PubMed] [Google Scholar]
- 3.Raddatz G, et al. Dnmt2-dependent methylomes lack defined DNA methylation patterns. Proc Natl Acad Sci USA. 2013;110(21):8627–8631. doi: 10.1073/pnas.1306723110. [DOI] [PMC free article] [PubMed] [Google Scholar]
- 4.Leonard S, et al. Epigenetic and transcriptional changes which follow Epstein-Barr virus infection of germinal center B cells and their relevance to the pathogenesis of Hodgkin’s lymphoma. J Virol. 2011;85(18):9568–9577. doi: 10.1128/JVI.00468-11. [DOI] [PMC free article] [PubMed] [Google Scholar]
- 5.Burgers WA, et al. Viral oncoproteins target the DNA methyltransferases. Oncogene. 2007;26(11):1650–1655. doi: 10.1038/sj.onc.1209950. [DOI] [PMC free article] [PubMed] [Google Scholar]
- 6.Arora P, Kim EO, Jung JK, Jang KL. Hepatitis C virus core protein downregulates E-cadherin expression via activation of DNA methyltransferase 1 and 3b. Cancer Lett. 2008;261(2):244–252. doi: 10.1016/j.canlet.2007.11.033. [DOI] [PubMed] [Google Scholar]
- 7.Au Yeung CL, et al. HPV-16 E6 upregulation of DNMT1 through repression of tumor suppressor p53. Oncol Rep. 2010;24(6):1599–1604. doi: 10.3892/or_00001023. [DOI] [PubMed] [Google Scholar]
- 8.Shamay M, Krithivas A, Zhang J, Hayward SD. Recruitment of the de novo DNA methyltransferase Dnmt3a by Kaposi’s sarcoma-associated herpesvirus LANA. Proc Natl Acad Sci USA. 2006;103(39):14554–14559. doi: 10.1073/pnas.0604469103. [DOI] [PMC free article] [PubMed] [Google Scholar]
- 9.Seo SY, Kim EO, Jang KL. Epstein-Barr virus latent membrane protein 1 suppresses the growth-inhibitory effect of retinoic acid by inhibiting retinoic acid receptor-beta2 expression via DNA methylation. Cancer Lett. 2008;270(1):66–76. doi: 10.1016/j.canlet.2008.04.043. [DOI] [PubMed] [Google Scholar]
- 10.Tsai CN, Tsai CL, Tse KP, Chang HY, Chang YS. The Epstein-Barr virus oncogene product, latent membrane protein 1, induces the downregulation of E-cadherin gene expression via activation of DNA methyltransferases. Proc Natl Acad Sci USA. 2002;99(15):10084–10089. doi: 10.1073/pnas.152059399. [DOI] [PMC free article] [PubMed] [Google Scholar]
- 11.Hino R, et al. Activation of DNA methyltransferase 1 by EBV latent membrane protein 2A leads to promoter hypermethylation of PTEN gene in gastric carcinoma. Cancer Res. 2009;69(7):2766–2774. doi: 10.1158/0008-5472.CAN-08-3070. [DOI] [PubMed] [Google Scholar]
- 12.Cancer Genome Atlas Research Network Comprehensive molecular characterization of gastric adenocarcinoma. Nature. 2014;513(7517):202–209. doi: 10.1038/nature13480. [DOI] [PMC free article] [PubMed] [Google Scholar]
- 13.Kaneda A, Matsusaka K, Aburatani H, Fukayama M. Epstein-Barr virus infection as an epigenetic driver of tumorigenesis. Cancer Res. 2012;72(14):3445–3450. doi: 10.1158/0008-5472.CAN-11-3919. [DOI] [PubMed] [Google Scholar]
- 14.Niller HH, Wolf H, Minarovits J. Epigenetic dysregulation of the host cell genome in Epstein-Barr virus-associated neoplasia. Semin Cancer Biol. 2009;19(3):158–164. doi: 10.1016/j.semcancer.2009.02.012. [DOI] [PubMed] [Google Scholar]
- 15.Halder S, et al. Early events associated with infection of Epstein-Barr virus infection of primary B-cells. PLoS One. 2009;4(9):e7214. doi: 10.1371/journal.pone.0007214. [DOI] [PMC free article] [PubMed] [Google Scholar]
- 16.Nikitin PA, et al. An ATM/Chk2-mediated DNA damage-responsive signaling pathway suppresses Epstein-Barr virus transformation of primary human B cells. Cell Host Microbe. 2010;8(6):510–522. doi: 10.1016/j.chom.2010.11.004. [DOI] [PMC free article] [PubMed] [Google Scholar]
- 17.Knipe DM, et al. Snapshots: Chromatin control of viral infection. Virology. 2013;435(1):141–156. doi: 10.1016/j.virol.2012.09.023. [DOI] [PMC free article] [PubMed] [Google Scholar]
- 18.Lieberman PM. Chromatin regulation of virus infection. Trends Microbiol. 2006;14(3):132–140. doi: 10.1016/j.tim.2006.01.001. [DOI] [PubMed] [Google Scholar]
- 19.Ropero S, Esteller M. The role of histone deacetylases (HDACs) in human cancer. Mol Oncol. 2007;1(1):19–25. doi: 10.1016/j.molonc.2007.01.001. [DOI] [PMC free article] [PubMed] [Google Scholar]
- 20.Jin B, Li Y, Robertson KD. DNA methylation: Superior or subordinate in the epigenetic hierarchy? Genes Cancer. 2011;2(6):607–617. doi: 10.1177/1947601910393957. [DOI] [PMC free article] [PubMed] [Google Scholar]
- 21.Feng WH, Hong G, Delecluse HJ, Kenney SC. Lytic induction therapy for Epstein-Barr virus-positive B-cell lymphomas. J Virol. 2004;78(4):1893–1902. doi: 10.1128/JVI.78.4.1893-1902.2004. [DOI] [PMC free article] [PubMed] [Google Scholar]
- 22.McLaughlin-Drubin ME, Munger K. Viruses associated with human cancer. Biochim Biophys Acta. 2008;1782(3):127–150. doi: 10.1016/j.bbadis.2007.12.005. [DOI] [PMC free article] [PubMed] [Google Scholar]
- 23.Saha A, Kaul R, Murakami M, Robertson ES. Tumor viruses and cancer biology: Modulating signaling pathways for therapeutic intervention. Cancer Biol Ther. 2010;10(10):961–978. doi: 10.4161/cbt.10.10.13923. [DOI] [PMC free article] [PubMed] [Google Scholar]
- 24.Saha A, Robertson ES. Epstein-Barr virus-associated B-cell lymphomas: Pathogenesis and clinical outcomes. Clin Cancer Res. 2011;17(10):3056–3063. doi: 10.1158/1078-0432.CCR-10-2578. [DOI] [PMC free article] [PubMed] [Google Scholar]
- 25.Gray KS, Forrest JC, Speck SH. The de novo methyltransferases DNMT3a and DNMT3b target the murine gammaherpesvirus immediate-early gene 50 promoter during establishment of latency. J Virol. 2010;84(10):4946–4959. doi: 10.1128/JVI.00060-10. [DOI] [PMC free article] [PubMed] [Google Scholar]
- 26.Saha A, Robertson ES. Impact of EBV essential nuclear protein EBNA-3C on B-cell proliferation and apoptosis. Future Microbiol. 2013;8(3):323–352. doi: 10.2217/fmb.12.147. [DOI] [PMC free article] [PubMed] [Google Scholar]
- 27.Saha A, et al. E2F1 mediated apoptosis induced by the DNA damage response is blocked by EBV nuclear antigen 3C in lymphoblastoid cells. PLoS Pathog. 2012;8(3):e1002573. doi: 10.1371/journal.ppat.1002573. [DOI] [PMC free article] [PubMed] [Google Scholar]
- 28.Maruo S, et al. Epstein-Barr virus nuclear antigens 3C and 3A maintain lymphoblastoid cell growth by repressing p16INK4A and p14ARF expression. Proc Natl Acad Sci USA. 2011;108(5):1919–1924. doi: 10.1073/pnas.1019599108. [DOI] [PMC free article] [PubMed] [Google Scholar]
- 29.Esteller M. Epigenetics in cancer. N Engl J Med. 2008;358(11):1148–1159. doi: 10.1056/NEJMra072067. [DOI] [PubMed] [Google Scholar]
- 30.Zhao J, et al. Genome-wide identification of Epstein-Barr virus-driven promoter methylation profiles of human genes in gastric cancer cells. Cancer. 2013;119(2):304–312. doi: 10.1002/cncr.27724. [DOI] [PubMed] [Google Scholar]
- 31.Kwong J, et al. Promoter hypermethylation of multiple genes in nasopharyngeal carcinoma. Clin Cancer Res. 2002;8(1):131–137. [PubMed] [Google Scholar]
- 32.Tsao SW, et al. The association of E-cadherin expression and the methylation status of the E-cadherin gene in nasopharyngeal carcinoma cells. Eur J Cancer. 2003;39(4):524–531. doi: 10.1016/s0959-8049(02)00494-x. [DOI] [PubMed] [Google Scholar]
- 33.Zhou L, et al. Frequent hypermethylation of RASSF1A and TSLC1, and high viral load of Epstein-Barr Virus DNA in nasopharyngeal carcinoma and matched tumor-adjacent tissues. Neoplasia. 2005;7(9):809–815. doi: 10.1593/neo.05217. [DOI] [PMC free article] [PubMed] [Google Scholar]
- 34.Lee KY, et al. Epigenetic disruption of interferon-gamma response through silencing the tumor suppressor interferon regulatory factor 8 in nasopharyngeal, esophageal and multiple other carcinomas. Oncogene. 2008;27(39):5267–5276. doi: 10.1038/onc.2008.147. [DOI] [PubMed] [Google Scholar]
- 35.Cui Y, et al. OPCML is a broad tumor suppressor for multiple carcinomas and lymphomas with frequently epigenetic inactivation. PLoS One. 2008;3(8):e2990. doi: 10.1371/journal.pone.0002990. [DOI] [PMC free article] [PubMed] [Google Scholar]
- 36.García JF, et al. Spanish Hodgkin Lymphoma Study Group Hodgkin and Reed-Sternberg cells harbor alterations in the major tumor suppressor pathways and cell-cycle checkpoints: Analyses using tissue microarrays. Blood. 2003;101(2):681–689. doi: 10.1182/blood-2002-04-1128. [DOI] [PubMed] [Google Scholar]
- 37.Rossi D, et al. Aberrant promoter methylation of multiple genes throughout the clinico-pathologic spectrum of B-cell neoplasia. Haematologica. 2004;89(2):154–164. [PubMed] [Google Scholar]
- 38.Shiramizu B, Mick P. Epigenetic changes in the DAP-kinase CpG island in pediatric lymphoma. Med Pediatr Oncol. 2003;41(6):527–531. doi: 10.1002/mpo.10326. [DOI] [PubMed] [Google Scholar]
- 39.Price AM, et al. Analysis of Epstein-Barr virus-regulated host gene expression changes through primary B-cell outgrowth reveals delayed kinetics of latent membrane protein 1-mediated NF-κB activation. J Virol. 2012;86(20):11096–11106. doi: 10.1128/JVI.01069-12. [DOI] [PMC free article] [PubMed] [Google Scholar]