

Significance
When oxygen availability becomes limited, organs and cells activate the hypoxic response to generate energy. This response releases a large amount of lactate into the circulation as a result of anaerobic glycolysis. However, we found that activating the hypoxic response in the liver by inhibiting the oxygen sensor prolyl hydroxylase domain-containing protein 2 (PHD2) enhances the uptake of lactate for gluconeogenesis, also known as the Cori cycle, and ameliorates lactic acidosis. Our findings suggest that PHD2 serves as a viable drug target for the treatment of life-threatening lactic acidosis, which is frequent complication of severe infectious and ischemic diseases, as well as of biguanide treatment in patients with diabetes with renal failure.
Keywords: hypoxic response, PHD inhibitor, hyperlactatemia, gluconeogenesis, sepsis
Abstract
Loss of prolyl hydroxylase 2 (PHD2) activates the hypoxia-inducible factor-dependent hypoxic response, including anaerobic glycolysis, which causes large amounts of lactate to be released from cells into the circulation. We found that Phd2-null mouse embryonic fibroblasts (MEFs) produced more lactate than wild-type MEFs, as expected, whereas systemic inactivation of PHD2 in mice did not cause hyperlacticacidemia. This unexpected observation led us to hypothesize that the hypoxic response activated in the liver enhances the Cori cycle, a lactate–glucose carbon recycling system between muscle and liver, and thereby decreases circulating lactate. Consistent with this hypothesis, blood lactate levels measured after a treadmill or lactate tolerance test were significantly lower in Phd2-liver-specific knockout (Phd2-LKO) mice than in control mice. An in vivo 13C-labeled lactate incorporation assay revealed that the livers of Phd2-LKO mice produce significantly more glucose derived from 13C-labeled lactate than control mice, suggesting that blockade of PHD2 in the liver ameliorates lactic acidosis by activating gluconeogenesis from lactate. Phd2-LKO mice were resistant to lactic acidosis induced by injection of a lethal dose of lactate, displaying a significant elongation of survival. Moreover, oral administration of a PHD inhibitor improved survival in an endotoxin shock mice model. These data suggest that PHD2 is a potentially novel drug target for the treatment of lactic acidosis, which is a serious and often fatal complication observed in some critically ill patients.
In metazoans, the cellular enzyme lactate dehydrogenase (LDH) converts pyruvate to lactate, which is then exported from cells. Lactate efflux is increased under hypoxic conditions, where available molecular oxygen is limited. The cellular response to hypoxia is mainly regulated by the heterodimeric transcription factor hypoxia-inducible factor (HIF), which consists of an unstable alpha subunit (HIFα) and a stable beta subunit (HIFβ) (1, 2). HIF prolyl hydroxylases called PHDs (PHD1–PHD3) (3) target HIFα for ubiquitin-proteasome-dependent protein degradation under normoxic conditions, lowering HIF levels and suppressing HIF signaling. Under hypoxic conditions, PHDs become inactive because they require molecular oxygen for enzymatic activity. This inactivation leads to HIFα stabilization and activation of HIF signaling. Activated HIF up-regulates genes involved in various events, including erythrocytosis, neovascularization, and anaerobic glycolysis. HIF activation enhances anaerobic glycolysis by up-regulating glucose transporters and glycolytic enzymes, including lactate dehydrogenase A (LDHA), and monocarboxylate transporters, leading to enhanced lactate secretion.
Results and Discussion
Inactivation of Phd2 in the Liver Reduces the Blood Lactate Level.
PHD2 is the dominant HIF-prolyl hydroxylase in vivo among all three PHDs (4), and inactivating PHD2 alone is sufficient to activate HIF (5), which would enhance lactate efflux from the cells. As expected, lactate efflux from Phd2−/− mouse embryonic fibroblasts (MEFs) was significantly higher than from Phd2+/+ MEFs (Fig. 1A). We therefore expected that systemic inactivation of PHD2 would cause increased lactic acid production and hyperlacticacidemia. To test this, we studied mice in which Phd2 can be conditionally inactivated systemically (Phd2-SKO) (5). We first confirmed that the expression levels of some mRNAs linked to glycolysis were significantly increased in skeletal muscles of Phd2-SKO mice compared to control mice (Fig. S1A and Table S1). Unexpectedly, however, blood lactate levels in Phd2-SKO were not higher, and in fact tended to be lower, than in the control mice, although this difference did not reach statistical significance (Fig. 1B). To examine the mechanisms responsible for this unexpected observation, we measured lactate levels in mice subjected to treadmill exercise. Blood lactate levels were significantly lower in Phd2-SKO mice after treadmill exercise compared to control mice (Fig. 1C). This result suggested that systemic inactivation of Phd2 increases lactate clearance, perhaps to compensate for enhanced lactate production. Notably, these treadmill experiments were performed a week after tamoxifen-induced Phd2 inactivation, well before the induction of erythrocytosis (5, 6). Therefore, our results cannot be attributed to changes in red blood cell mass.
Fig. 1.
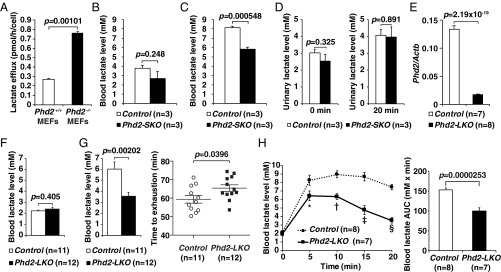
Inactivation of Phd2 in the liver reduces blood lactate levels. (A) Lactate efflux analysis in Phd2+/+ and Phd2−/− MEFs. Values were from triplicated dishes. Error bars indicate 1 SEM. (B) The blood lactate level in Control and Phd2-SKO mice. Error bars, SEM. (C) The blood lactate level 50 min after the treadmill in Control and Phd2-SKO mice. Error bars, SEM. (D) Urinary lactate measurement. Lactate levels in urine were measured before (Left) and 20 min after (Right) the lactate injection in Control and Phd2-SKO mice. Error bars, SEM. (E) Real-time RT-PCR analysis of Phd2 mRNA in the livers of Control and Phd2-LKO mice. Error bars, SEM. (F) Blood lactate levels in Control and Phd2-LKO mice. Error bars, SEM. (G) Treadmill experiment in Control and Phd2-LKO mice. The blood lactate levels 50 min after the exercise (Left) and time to exhaustion (Right) are shown. Error bars, SEM. (H) Lactate tolerance test. 0.5 mg per gram body weight of lactate was intraperitoneally injected, and the blood lactate levels were measured at the indicated time (Left). Area under the curve (AUC) was also analyzed (Right). Error bars, SEM. *P = 0.0448; †P = 0.000342; ‡P = 0.000118; §P = 2.53 × 10⁻⁷ versus Control.
Fig. S1.

Systemic or liver-specific inactivation of Phd2. (A) Real-time RT-PCR analysis of transporters or enzymes involved in the skeletal muscles of Control and Phd2-SKO mice: glucose transporter GLUT1 (Slc2a1), phosphofructokinase, muscle (Pfkm), phosphoglycerate kinase 1 (Pgk1), LDHA (Ldha), and PDH kinase 1 (Pdk1). Error bars, SEM. (B) Phd2 intact allele frequency was analyzed in the indicated tissues of Phd2-LKO mice (n = 3) by real-time PCR. The copy number of Phd2 locus and Rn18s locus was compared. All of the values were normalized with the control DNA (genomic DNA from livers of Phd2F/F mice carrying no Cre-recombinase transgene; n = 3). The unpaired Student t-test was performed versus control DNA. Note that gene disruption in Phd2-LKO mice is liver-specific. Error bars, SEM. (C) Blood glucose levels under the ad libitum (Left) or fasted (Right) conditions in Control and Phd2-LKO mice. Error bars, SEM.
Table S1.
Primer sequences for mRNA expression analysis
| Gene | Oligonucleotide sequence (forward) | Oligonucleotide sequence (reverse) |
| Phd2 | 5′-AATGGAGATGGAAGATGCG-3′ | 5′-TGGGTTCAATGTCAGCAAAC-3′ |
| Slc2a1 | 5′-CCCCCCAGAAGGTTATTGAG-3′ | 5′-CCAACAGGTTCATCATCAGC-3′ |
| Slc2a2 | 5′-GTCGCCTCATTCTTTGGTG-3′ | 5′-CTGATACACTTCGTCCAGC-3′ |
| Hk2 | 5′-TACCACACACCCTACAGCAG-3′ | 5′-ACCCTCTGGAGACCATTGTC-3′ |
| Pfkl | 5′-TACCGTGGACCTGGAGAAAC-3′ | 5′-CATAGATGAGGAAGACTTTGGC-3′ |
| Pfkm | 5′-GCGTGTCTATGATGCTTCAG-3′ | 5′-AAAGTGTCAGCCCCAGTGAG-3′ |
| Pgk1 | 5′-GATGAGGGTGGACTTCAAC-3′ | 5′-TAAGGACAACGGACTTGGC-3′ |
| Pklr | 5′-TTCTTCCAGCAGCAGCAAC-3′ | 5′-TCATCTCCTTGAGGCGGTC-3′ |
| Pdk1 | 5′-ACCTCGTTTATGTTTCTGCG-3′ | 5′-CAACTCCTGAAGGCTTTGG-3′ |
| Ldha | 5′-ACAGTTGTTGGGGTTGGTGC-3′ | 5′-CGCAGTTACACAGTAGTCTTTG-3′ |
| Ldhb | 5′-CTAAGCACCGTGTGATTGG-3′ | 5′-ATTCAGTTCCTGGAGGGAG-3′ |
| Pcx | 5′-CCACTATGACTCTCTGCTCG-3′ | 5′-GGAACTGCTGGTTGTTGAG-3′ |
| Mdh1 | 5′-ATGATGGGTGTTCTGGACG-3′ | 5′-TCACATTGGCTTTCAGTAGG-3′ |
| Mdh2 | 5′-CCAGAGCAAATGTGAAAGGC-3′ | 5′-ATGGTAGCGTTGGTGTTG-3′ |
| Pck1 | 5′-GGAAGGACAAAGATGGCAAG-3′ | 5′-TCAGGTTCAAGGCGTTTTC-3′ |
| Fbp1 | 5′-TGGATTGTGGTGTCAACTG-3′ | 5′-AGTCCTTGGCATAACCCTC-3′ |
| G6pd | 5′-ACCGTCTATTCTACCTGGC-3′ | 5′-AGAGAGGAGATGTGGTTCG-3′ |
| Slc16a1 | 5′-TGGTTGTCTGTCTGGTTGC-3′ | 5′-CAGTGGTCGCTTCTTGTAG-3′ |
| Slc16a3 | 5′-AGCCCAGTGTTCCTTTGTG-3′ | 5′-ACAGCAGTTGAGCAGTAGG-3′ |
| Slc16a7 | 5′-TTCAACACCACCTCCAGTC-3′ | 5′-CAGCATAATAGTCCTCCCAC-3′ |
| Slc7a5 | 5′-GCCCTCATCATTTTGCTCG-3′ | 5′-TCAGATAGTTCCATCCTCCG-3′ |
| Actb | 5′-AACCGTGAAAAGATGACCC-3′ | 5′-TACGACCAGAGGCATACAGG-3′ |
Urinary lactate levels did not differ between Phd2-SKO mice and control mice, suggesting the lower blood lactate levels in Phd2-SKO mice are not a result of enhanced lactate clearance by the kidneys (Fig. 1D). As circulating lactate can be taken up by the liver for gluconeogenesis (7), we hypothesized that the hypoxic response in hepatocytes contributes to systemic lactate clearance. To test this hypothesis, we crossed Phd2-conditional mice with an Albumin-Cre strain to generate Phd2 liver-specific knockout (Phd2-LKO) mice (6, 8). Real-time RT-PCR confirmed that Phd2 mRNA expression was drastically decreased in the livers of Phd2-LKO mice (Fig. 1E and Table S1). The frequency of intact Phd2 alleles was also analyzed by real-time PCR with genomic DNA obtained from various tissues, including the liver, kidney, heart, and muscle (Fig. S1B and Table S2) (5). The results confirmed that the Phd2 gene was inactivated in the liver of Phd2-LKO mice, but not in other tissues, consistent with prior characterizations of this Cre strain (6, 8, 9). Phd2-LKO and control mice showed no differences in blood glucose levels under either ad libitum or fasted conditions (Fig. S1C). They also showed no difference in hematocrit levels (8).
Table S2.
Primer sequences for genotyping and quantitative PCR for genomic DNA
| Gene | Oligonucleotide sequence |
| Phd2 wild type and conditional allele | |
| Fwd | 5′-AGATGACCTCCCCAACTCTGCTAC-3′ |
| Rev | 5′-CAGTGTTCTGCCTCCATTTAT-3′ |
| Cre-ER or Alb-Cre | |
| Fwd | 5′-CGGGTCAGAAAAAATGGTGTTG-3′ |
| Rev | 5′-CGGTATTGAAACTCCAGCG-3′ |
| Rn18s | |
| Fwd | 5′-CGGCTACCACATCCAAGGAA-3′ |
| Rev | 5′-GCTGGAATTACCGCGGCT-3′ |
Baseline blood lactate levels in Phd2-LKO mice were similar to those in control mice (Fig. 1F). However, blood lactate levels in the Phd2-LKO mice after 50 min of treadmill exercise were significantly lower than in the control mice (Fig. 1G, Left). Time to exhaustion was also significantly longer in Phd2-LKO mice than in control mice (Fig. 1G, Right), suggesting that inactivation of Phd2 in the liver is sufficient to reduce blood lactate levels and enhance exercise performance. To further assess whether Phd2 inactivation in the liver is able to overcome critical levels of hyperlacticacidemia, we performed lactate tolerance tests. After systemic lactate injection, blood lactate levels were significantly lower in Phd2-LKO mice than in control mice (Fig. 1H), suggesting the inactivation of Phd2 in hepatocytes ameliorates hyperlacticacidemia.
Inactivation of Phd2 in the Liver Activates Gluconeogenesis from Lactate.
To discern how imported lactate was being used in hepatocytes, the expression levels of the enzymes involved in lactate import and metabolism were quantitated by real-time RT-PCR (Fig. 2A, Fig. S2A, and Table S1). Lactate is transported into hepatocytes through monocarboxylate transporters (MCTs). Among several MCTs, MCT2 (Slc16a7) has the highest affinity with lactate (10) and was significantly up-regulated in Phd2-LKO livers compared to control livers (Fig. 2A). Lactate is then converted to pyruvate by LDHA (Ldha), which was also up-regulated in Phd2-deficient livers (Fig. 2A), suggesting that both lactate import and its conversion to pyruvate are accelerated in Phd2-deficient livers.
Fig. 2.

Inactivation of Phd2 in the liver activates gluconeogenesis from lactate. (A) Real-time RT-PCR analysis of transporters or enzymes involved in gluconeogenesis in the livers of Control and Phd2-LKO mice. Error bars, SEM. (B) LC/MS-based quantification of total 13C atoms in glucose that were newly synthesized from 13C3-lactate. Data were not corrected for the natural abundances of 13Cx-glucose (Materials and Methods). Error bars, SEM.
Fig. S2.
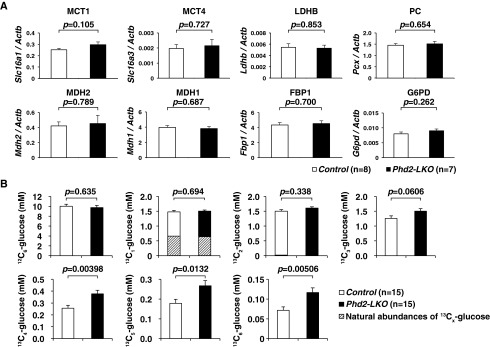
Gluconeogenesis in Phd2-LKO liver. (A) Real-time RT-PCR analysis of transporters or enzymes involved in gluconeogenesis in the livers of Control and Phd2-LKO mice: MCT1 (Slc16a1), monocarboxylate transporter 4 (MCT4) (Slc16a3), lactate dehydrogenase B (LDHB) (Ldhb), pyruvate carboxylase (PC) (Pcx), MDH2 (Mdh2), malate dehydrogenase 1 (MDH1) (Mdh1), fructose-1,6-bisphosphatase 1 (FBP1) (Fbp1), and glucose-6-phosphate dehydrogenase (G6PD) (G6pd). Error bars, SEM. (B) LC/MS-based quantification of nonlabeled (12C6) and 13C-labeled (13C1–13C6) glucose. Note that the shaded bars indicate the estimated natural abundances of 13Cx-glucose. Error bars, SEM.
Pyruvate is converted to acetyl CoA, a component of the tricarboxylic acid (TCA) cycle, by pyruvate dehydrogenase (PDH) in the mitochondria. PDH kinase 1 (PDK1), which is induced by HIF, negatively regulates the activity of PDH through inhibitory phosphorylation of its E1α subunit (11). Therefore, PDK1 is considered to be a gatekeeper of the TCA cycle. As expected, PDK1 (Pdk1) was up-regulated in Phd2-deficient livers, suggesting that PDH activity is inhibited by induced PDK1 and that the flux of pyruvate–acetyl CoA conversion is down-regulated in Phd2-inactivated livers. Therefore, fatty acid synthesis from pyruvate via acetyl CoA is not likely to be activated in Phd2-deficient livers.
Another possible metabolic pathway for the biotransformation of pyruvate under hypoxic conditions is gluconeogenesis. Pyruvate can be imported into mitochondria and converted to oxaloacetate (OAA) by pyruvate carboxylase (PC). OAA is converted to malate by mitochondrial malate dehydrogenase 2 (MDH2), exported from mitochondria, and converted back to OAA by cytoplasmic malate dehydrogenase 1 (MDH1). This cytoplasmic OAA is then converted to phosphoenolpyruvate by phosphoenolpyruvate carboxykinase (PEPCK), one of the rate-limiting enzymes of gluconeogenesis. Pck1 mRNA, which encodes PEPCK, was significantly up-regulated in Phd2-deficient livers compared with control livers (Fig. 2A). In contrast, expression of glucose-6-phosphate (G6P) dehydrogenase (G6pd), the enzyme that triggers entry of G6P into the pentose phosphate pathway, was comparable between the Phd2-deficient and control livers (Fig. S2A).
The last stage of gluconeogenesis involves the dephosphorylation of G6P and excretion of the resulting glucose from hepatocytes via the glucose transporter GLUT2 (Slc2a2) (12), which was also up-regulated in Phd2-LKO livers. Taken together, inactivation of Phd2 in the liver appears to turn on hypoxic responses that activate gluconeogenesis from lactate and decrease lactate use in the TCA cycle, fatty acid synthesis, and the pentose phosphate pathway. These responses contribute to the reduction in blood lactate levels (Fig. 2A).
To confirm that gluconeogenesis from lactate is indeed activated in Phd2-deficient liver, stable isotope-labeled lactate (13C3-lactate) was intraperitoneally injected into fasted mice, and plasma concentrations of 13C-labeled glucose (13C1–13C6) were quantified using liquid chromatography–mass spectrometry (LC/MS) (Fig. 2B and Fig. S2B). Nonlabeled (12C6) or one- to three-labeled (13C1–13C3) glucose in the plasma were unchanged between two genotypes. In contrast, four- to full-labeled (13C4–13C6) glucose, as well as total 13C atoms in glucose, were significantly elevated in the plasma of the Phd2-LKO mice compared to the control mice, providing further evidence that inactivation of Phd2 in the liver activates gluconeogenesis from lactate.
In addition to lactate, alanine is another major gluconeogenic substrate that comes from the muscle to the liver (glucose–alanine cycle or Cahill cycle) (13). If global gluconeogenesis is activated upon Phd2-inactivation in the liver, alanine would be used as a source of gluconeogenesis, and blood glucose levels in Phd2-LKO mice might be higher than control mice under fasted conditions as a result of enhanced gluconeogenesis. Under such circumstances, however, blood glucose levels were unchanged between Phd2-LKO and control mice (Fig. S1C, Right). This suggests that only gluconeogenesis from lactate is enhanced in Phd2-inactivated liver, and global hepatic gluconeogenesis is not enhanced.
Detailed Quantitative Analysis of the Metabolites Derived from 13C3-Lactate Confirms the Activation of Gluconeogenesis from Lactate in Phd2-Deficient Hepatocytes.
Because liver contains multiple cell types, such as blood cells, sinusoidal cells, Kupffer cells, endothelial cells, stellate cells, and cholangiocytes, in addition to hepatocytes, crude liver extracts contain a variety of metabolites from cells that are not hepatocytes. To clarify the molecular mechanism by which Phd2 inactivation activates gluconeogenesis from lactate in hepatocytes themselves, we perfused the livers of control mice and Phd2-LKO mice to isolate hepatocytes. Cultured hepatocytes were labeled with 13C3-lactate for 5 min and then subjected to metabolome analysis (Fig. 3). The 13C contents of each metabolite were quantified using capillary electrophoresis–mass spectrometry (CE/MS). The 13C contents of lactate, pyruvate, and malate were significantly greater in Phd2-deficient hepatocytes than in control hepatocytes. In contrast, the 13C contents of succinate were significantly lower in Phd2-deficient hepatocytes, suggesting that the pyruvate derived from 13C3-lactate was less incorporated into the TCA cycle in Phd2-deficient hepatocytes compared with controls. The 13C contents of G6P were significantly increased, whereas those of glucose-1-phosphate and ribose-5-phosphate were not increased in Phd2-inactivated hepatocytes compared with control hepatocytes. Although uncharged metabolites such as glucose cannot be quantified using CE/MS, our data support the idea that 13C3-lactate-derived G6P is used primarily for gluconeogenesis rather than glycogen synthesis or the pentose phosphate pathway in Phd2-deficient hepatocytes (Fig. 3).
Fig. 3.
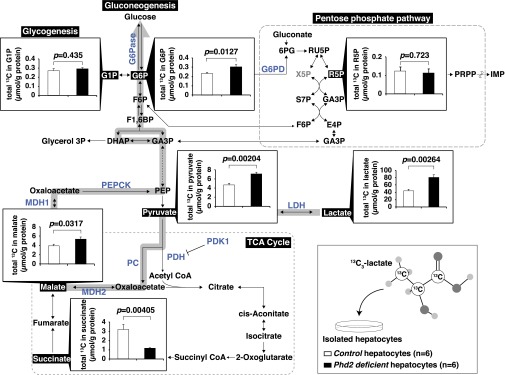
Quantification of total 13C atoms in 13C3-lactate-derived metabolites. Cultured hepatocytes from Control and Phd2-LKO mice were labeled with 13C3-lactate. Total 13C atoms in indicated metabolites were quantified (µmol/g protein), using CE/MS. Data were not corrected for the natural abundances of 13Cx-glucose (Materials and Methods). Error bars, SEM.
Previous studies reported that HIF2α activation caused by the loss of PHD3 enhanced insulin signaling in the liver and suppressed gluconeogenesis (14, 15). However, inactivating PHD2 alone induces PHD3, which is HIF-responsive and compensates for PHD2 loss, and thus might enhance gluconeogenesis. Although Pck1 and Slc2a2 mRNAs were induced in Phd2-LKO mice, other gluconeogenic mRNAs such as the Pcx and Fbp1 mRNAs were not (Fig. S2). Clearly, additional studies are needed to understand how, mechanistically, PHD2 regulates gluconeogenesis and the degree to which it does so through HIF versus other substrates.
Switching between glycolysis and gluconeogenesis might be controlled not only by the mRNA expression levels of rate-limiting enzymes, including bidirectional enzymes, linked to glycolysis and gluconeogenesis but also by posttranslational modification and allosteric regulation of those enzymes (16). For example, the rate-limiting enzymes of glycolysis (phosphofructokinase) and gluconeogenesis (fructose bisphosphatase) are both regulated by the abundance of fructose 2,6-bisphosphate (16). We observed that some HIF-responsive glycolytic mRNAs, such as Slc2a2 and Ldha mRNA, were induced in Phd2-defective hepatocytes (Fig. 2A), but others, such as the critical Hk2 (hexokinase 2), Pfkl (phosphofructokinase, liver), and Pklr (pyruvate kinase, liver, and red blood cell) mRNA, were not (Fig. S3). Moreover, the conversion of lactate to pyruvate consumes NAD and generates NADH, which inhibits glycolytic activity of GAPDH. Whether or not Phd2 inactivation increases glycolysis in the liver while allowing the liver to consume lactate still remains to be determined. It is also possible that PHD2 regulates HIF-independent glucose metabolism.
Fig. S3.

Expression of glycolytic genes in Phd2-LKO liver. The expression levels of Hk2, Pfkl, and Pklr in the livers of Control or Phd2-LKO mice were analyzed by real-time RT-PCR. Error bars, SEM.
Inactivation of Phd2 in the Liver Improves Survival in Life-Threatening Lactic Acidosis.
Increased blood lactate causes lactic acidosis, a critical medical condition characterized by blood lactate levels above 5 mM and blood pH levels below 7.35. To assess whether PHD2 loss in the liver can improve survival in the setting of lactic acidosis, Phd2-LKO and control mice were given intraperitoneal (i.p.) injection of lactate. Venous blood gas analysis 20 min after the lactate injection revealed a smaller decrease in pH in Phd2-LKO mice than in control mice (Fig. 4A). After administration of a lethal dose of lactate, Phd2-LKO mice also exhibited significantly higher survival rates than control mice (Fig. 4B). These results suggest that inactivating Phd2 in the liver can reduce the mortality linked to lactic acidosis.
Fig. 4.

Inactivation of Phd2 in the liver causes resistance to lactic acidosis. (A) Venous blood gas analysis. pH (Left) and base excess (Right) were analyzed in the venous sample from the retro-orbital sinus 20 min after the injection of 0.5 mg/g body weight of lactate. Error bars, SEM. (B) Kaplan–Meier survival analysis after the injection of 0.5 mg/g body weight of lactate. MS indicates median survival. (C) The blood lactate analysis in indicated points after LPS injection in vehicle or PHD inhibitor GSK360A-treated wild-type mice (Left). AUC was also calculated (Right). Error bars, SEM. *P = 0.00598; †P = 0.000641; ‡P = 0.00742 versus Control. (D) Survival analysis in LPS-induced endotoxin shock model. Wild-type mice were orally treated with vehicle or PHD inhibitor GSK360A immediately after the LPS injection. U.D., undefined. (E) Scheme of how the Cori cycle is activated in the liver upon PHD2-inactivation.
Lactic acidosis is often a complication of severe medical conditions, including endotoxin shock and ischemic diseases, and has also been observed in biguanide-treated diabetic patients with renal dysfunction (17). Lactic acidosis is frequently associated with multiple organ failure, which has an extremely poor survival rate (18). Because the outcome of multiple organ failure treatment is closely correlated with blood lactate levels (19–22), it is believed that reducing blood lactate levels would improve outcomes in this setting. To test whether pharmacological PHD2 inhibition could have a beneficial effect on such severe medical conditions, including endotoxin-induced shock, wild-type mice were treated with vehicle or the PHD inhibitor GSK360A by oral gavage immediately after the i.p. injection of a lethal dose of lipopolysaccharide (LPS). GSK360A treatment clearly attenuated the elevation of the blood lactate level (Fig. 4C) and was associated with a significantly better survival rate after the LPS injection (Fig. 4D). The presence of a GSK360A-induced hypoxic response was confirmed by the up-regulation of mRNAs that are direct targets of HIF (Fig. S4 and Table S1).
Fig. S4.

GSK360A-induced hypoxic response. Real-time RT-PCR analysis of Ldha, Pdk1, Pgk1, and L-type amino acid transporter 1 (LAT1) (Slc7a5), known as direct HIF-target mRNAs, in the livers of vehicle or GSK360A treated wild-type male mice (n = 3). Total RNA from the liver was isolated 6 h after the oral administration of vehicle (1% methyl cellulose) or GSK360A (30 mg/kg body weight). Error bars, SEM.
It is well established that the balance between peripheral lactate generation and its consumption in the liver determine the severity of lactic acidosis. Our study suggests that promoting lactate clearance by inhibiting hepatic PHD2 function, and thereby enhancing the hepatic arm of the Cori cycle, improves outcomes in patients with lactic acidosis and shock. In addition, there may be a beneficial immune response caused by enhanced interleukin-10 (IL-10) production, which was reported previously (23). Conventional lactate reduction therapies include oxygen inhalation or the transfusion of red blood cells to improve molecular oxygen delivery, treatment with inotropes to increase cardiac output, and treatment with vasodilators to improve microvascular circulation (20, 21). None of these treatments enhances lactate clearance directly. Moreover, even though conventional oxygenation therapies down-regulate lactate production in peripheral tissues, they also appear to simultaneously suppress hepatic lactate consumption. Our study clearly demonstrates that inactivation of PHD2 in the liver triggers hypoxic responses that directly contribute to lactate clearance, resulting in better survival of lactic acidosis upon endotoxin shock by activating the Cori cycle (7) in the liver (Fig. 4E). Although chronic and systemic complete inactivation of PHD2 can cause detrimental adverse effects, such as cardiomyopathy, hepatic steatosis, and polycythemia (5, 6, 24), transient, acute inhibition of PHD2 might be safe and potentially beneficial in situations such as the treatment of myocardial infarction (25, 26), stroke (27), or organ transplantation (28). Moreover, as drugs that are given orally or via nasal tube are absorbed from the gut and delivered first to the liver via the portal vein, oral PHD inhibitors now under development might prove useful and safe for the treatment of lactic acidosis by preferentially targeting the PHD2 in the liver.
Materials and Methods
Mice.
All experiments were approved by the Animal Care and Utilization Committee of Keio University School of Medicine (11050–1). Wild-type C57BL/6 mice were from CLEA Japan, Inc. All Phd2 flox/flox (Phd2F/F) mice in this study were backcrossed to C57BL/6 strain at least five times, as previously reported (5). The transgenic mice expressing tamoxifen-inducible Cre-recombinase (Cre-ER) (004682 CAGG-Cre-ER; The Jackson Laboratory) and the albumin promoter-driven Cre-recombinase (Alb-Cre) were also described previously (6, 8, 9, 29). Further detailed breeding information is provided in the SI Materials and Methods. All the mice used in this study were 8–10-wk-old males except those used for urinary lactate measurement and venous blood gas analysis, and were maintained on a 12-h light/12-h dark cycle in a specific pathogen-free facility. Mice were fed ad libitum except in the in vivo 13C3-lactate tracer study (fasted for 16 h). Control and Phd2-SKO mice were orally treated with 1 mg tamoxifen twice at 6 and 7 d before the blood lactate measurement (Fig. 1 B and C) and real-time RT-PCR (Fig. S1A), or were treated with 1 mg tamoxifen twice at 2 and 3 d before the urinary analysis (Fig. 1D). Oligonucleotide sequences for genotyping are shown in Table S2.
Treadmill Experiment.
Forced exercise endurance in a treadmill experiment (Model MK-680S/CS; Muromachi Kikai) with an initial velocity of 6 m/min and an increase in velocity of 2 m/min every 5 min, as described previously (30), were performed. Mice were forced to run at a 20° uphill incline to induce concentric exercise in the musculature, which results in the lactate accumulation because of the activation of anaerobic glycolysis. Exhaustion was defined as an inability to stay off shock grids (100 V) for at least 5 s. Before and 50 min after treadmill exercise, blood samples were obtained from the retro-orbital sinus (Fig. 1 B and C) or tail vein (Fig. 1 F–H) for analysis of lactate levels, using Lactate Pro Test Meter and Lactate Pro Test Strip (Cycle Classic Imports).
Lactate Tolerance Test.
Lactate tolerance test was performed by the i.p. injection of 0.5 mg/g body weight of lactate (l-lactic acid. 252476; Sigma-Aldrich) dissolved in 0.9% NaCl. Whole-blood samples (5 µL each) were obtained from the tail veins at 0, 5, 10, 15, and 20 min after the injection. The blood lactate levels were measured using Lactate Pro Test Meter and Lactate Pro Test Strip. Kaplan–Meier survival analysis (up to 48 h) was also performed.
In Vivo Tracer Study.
Mice were fasted for 16 h and were intraperitoneally injected with 0.5 mg/g body weight of 13C3-lactate (l-lactic acid-13C3, 606065; Sigma-Aldrich). Twenty minutes after the injection, mice were anesthetized with isoflurane, and a blood sample was obtained from the retro-orbital sinus. Plasma compartment was purified with centrifuge twice at 15,000 × g for 5 min at 4 °C.
LC/MS-Based Quantification of Plasma Glucose.
Plasma samples were further purified by methanol–chloroform, as previously reported (31). 13C-labeled glucose (13C1–13C6), which is newly synthesized from administered 13C3-lactate, was measured using the Nexera UHPLC (Ultra High Performance Liquid Chromatograph) system coupled with a LCMS-8030 triple quadrupole mass spectrometer (Shimadzu). Total 13C atoms in glucose were quantified as a sum of 1 × 13C1-glucose, 2 × 13C2-glucose, 3 × 13C3-glucose, 4 × 13C4-glucose, 5 × 13C5-glucose, and 6 × 13C6-glucose. 12C6-glucose indicates nonlabeled glucose (13C0-glucose). The data were not corrected for the presence of naturally occurring 13C, which would be estimated to represent 6.6% of 12C6-glucose in total 13C1-glucose, 0.22% of 12C6-glucose in total 13C2-glucose, and so on.
CE/MS-Based Metabolome Analysis.
Extracted metabolites from the hepatocytes were analyzed using Agilent CE Capillary Electrophoresis System equipped with an Agilent 1100 series MSD mass spectrometer, as previously reported (31, 32). Quantification of the metabolites was normalized with protein amount of the samples (µmol/g protein). Total 13C atoms in indicated metabolites were calculated in a same manner as LC/MS-based quantification of 13C-labeled glucose.
Endotoxin Shock Model.
Eight-week-old wild-type C57BL/6 male mice were intraperitoneally injected with 40 mg/kg body weight of LPS (L2880, Sigma-Aldrich) and then treated with vehicle (1% methyl cellulose; 64625; Sigma-Aldrich) or 30 mg/kg body weight of PHD-inhibitor GSK360A (sc-490346; Santa Cruz Biotechnology) (33) by oral gavage immediately after the LPS injection. Whole-blood samples (5 µL each) were obtained from the tail veins, and the blood lactate levels were measured using Lactate Pro Test Meter and Lactate Pro Test Strip before and after the LPS injection.
Statistical Analysis.
No power calculation was performed to determine sample size. Sample size for each group was chosen based on previous reports. No animals were excluded. Comparisons of normally distributed data between genotypes were analyzed with the use of unpaired Student t test. Area under the curve value was calculated for time course lactate measurement and analyzed by unpaired Student t test. Difference in survival rate was analyzed by Log-rank (Mantel–Cox) test, using GraphPad Prism software.
SI Materials and Methods
Mice Breeding.
Phd2F/F mice were crossed with the Cre-ER mice or Alb-Cre mice to generate Phd2+/F;Cre-ER or Phd2+/F;Alb-Cre mice, respectively. Phd2+/F;Cre-ER or Phd2+/F;Alb-Cre mice were then intercrossed to generate Phd2F/F;Cre-ER (Phd2-SKO) or Phd2F/F;Alb-Cre (Phd2-LKO) mice, respectively, as well as relevant littermate controls (Phd2F/F).
Lactate Efflux Assay.
First, 1 × 10⁶ cells of Phd2+/+ or Phd2−/− MEFs (5) were plated on six-well dishes (9.4 cm2 surface/well) with 1 mL/well of fresh culture media. Lactate concentrations in the fresh culture media and the culture supernatant (8 h after plating) were compared, and then Δ lactate efflux was calculated (pmol/mL/hour/cell).
Urinary Lactate Measurement.
Eight- to 10-wk-old female Control and Phd2-SKO mice were orally administered 1 mg tamoxifen dissolved in 100 µL corn oil twice on day 0 and day 1. On day 2, 0.5 mg/g body weight of lactate dissolved in 0.9% NaCl was injected into mice intraperitoneally, and urine samples were collected at 0 and 20 min after the lactate injection. Urinary lactate levels were measured using Lactate Pro Test Meter and Lactate Pro Test Strip.
RNA Isolation and Real-Time RT-PCR Analysis.
Total RNA was isolated from the liver, using TRIzol (15596-026, Invitrogen) and RNeasy column (74104, Qiagen). Purified RNA samples (1 μg) were reverse transcribed into cDNA using AffinityScript QPCR cDNA Synthesis Kit (600559; Agilent Technologies). Real-time RT-PCR was performed with THUNDERBIRD SYBR qPCR Mix (QPS-201; TOYOBO), using real-time PCR system (Model 7300; Applied Biosystems). The mRNA levels were normalized to β-actin (Actb). The primer sequences are shown in Table S1.
Quantitative PCR for Genomic DNA.
Genomic DNA was extracted from various tissues including the liver, kidney, heart, and skeletal muscle of 8–10-wk-old Phd2-LKO male mice, using DNeasy Blood & Tissue Kit (69504; Qiagen). A total of 50 ng DNA was analyzed using THUNDERBIRD SYBR qPCR Mix by real-time PCR system. The primers were designed to amplify intronic sequences (intron 2–3) of Phd2 that are expected to be excised out upon Cre-mediated recombination (5). The primer sequences of Rn18s locus as a control are shown in Table S2.
Primary Hepatocytes Isolation and Culture.
Portal veins of 10-wk-old male mice were perfused with HBSS buffer without calcium and magnesium (085-09355; Wako) supplemented with 10 mM Hepes and 0.5 mM EGTA for 10 min, then perfused with low-glucose DMEM (041-29775, Wako) supplemented with 10 mM Hepes and 0.4 mg/mL collagenase type 4 (Worthington). After being filtered through a 70-µm cell strainer (352350; BD Biosciences), the isolated hepatocytes were washed using DMEM low glucose and centrifuged at 50 × g for 3 min at 4 °C three times. Viable hepatocytes were counted and then plated onto the collagen type 1-coated 100-mm dishes (4020-010; Iwaki) at 6 × 10⁶ cells per dish in hepatocyte culture media consisting of William’s E medium (W4128; Sigma-Aldrich) supplemented with 10% FBS (172012; Sigma-Aldrich), 1% antibiotic–antimycotic (15240-062; Gibco), 1% MEM nonessential amino acids (11140-050; Gibco), 1% ITS (41400-045; Gibco), 2 mM l-glutamine (35050-061; Gibco), 1 mM sodium pyruvate (11360-070; Gibco), 100 nM dexamethasone (872454; MSD Japan), and 10 ng/mL recombinant murine EGF (315-09; PeproTech). Hepatocytes were cultured at 37 °C in 21% O2 and 5% CO2, and the nonadhering cells were removed by changing the media 4 h after plating. Three days later, the culture media were replaced with hepatocyte culture media without ITS 3 h before the in vitro tracer assay. Then, hepatocytes were labeled for 5 min with 10 mM 13C3-lactate in hepatocyte culture media without ITS, of which pH was adjusted to 7.20 with NaOH. Metabolites were extracted as previously reported (32).
Venous Blood Gas Analysis.
Before and 20 min after the i.p. injection of 0.5 mg/g body weight of l-lactic acid, 8–10-wk-old Control and Phd2-LKO female mice were anesthetized with isoflurane, and whole-blood samples were taken from the retro-orbital sinus using heparinized Micro-Hematocrit Capillary Tubes (22-362-566; Thermo Fisher Scientific Inc.). pH, HCO3−, base excess, and anion gap were measured using i-STAT 1 analyzer and EC8+ cartridge (Abbott).
Acknowledgments
This study was supported in part by Grants-in-Aid for Scientific Research (B) (23310136 to Y.A.M.), Grant-in-Aid for Exploratory Research (23659175 and 20593966 to Y.A.M., and 24659154 to M.K.), Grant-in-Aid for Scientific Research on Innovative Areas “Oxygen Biology: a new criterion for integrated understanding of life” (26111006 to Y.A.M.) from the Ministry of Education, Culture, Sports, Science and Technology, Japan, and a research grant from Takeda Science Foundation, Japan (to Y.A.M.). M.S. was a leader of the Japan Science and Technology Agency, Exploratory Research for Advanced Technology, Suematsu Gas Biology Project until March 31, 2015. LC/MS-based metabolome analysis was supported by Biobank Japan Project in the Ministry of Education, Culture, Sports, Science and Technology, Japan, under the supervision of T.H., and capillary electrophoresis–mass spectrometry (CE/MS)-based metabolome analysis was supported by the Japan Science and Technology Agency, Core Research for Evolutional Science and Technology, under the supervision of T.H. and Dr. Yasuaki Kabe.
Footnotes
The authors declare no conflict of interest.
This article contains supporting information online at www.pnas.org/lookup/suppl/doi:10.1073/pnas.1515872112/-/DCSupplemental.
References
- 1.Kaelin WG, Jr, Ratcliffe PJ. Oxygen sensing by metazoans: The central role of the HIF hydroxylase pathway. Mol Cell. 2008;30(4):393–402. doi: 10.1016/j.molcel.2008.04.009. [DOI] [PubMed] [Google Scholar]
- 2.Semenza GL. Oxygen sensing, homeostasis, and disease. N Engl J Med. 2011;365(6):537–547. doi: 10.1056/NEJMra1011165. [DOI] [PubMed] [Google Scholar]
- 3.Epstein AC, et al. C. elegans EGL-9 and mammalian homologs define a family of dioxygenases that regulate HIF by prolyl hydroxylation. Cell. 2001;107(1):43–54. doi: 10.1016/s0092-8674(01)00507-4. [DOI] [PubMed] [Google Scholar]
- 4.Berra E, et al. HIF prolyl-hydroxylase 2 is the key oxygen sensor setting low steady-state levels of HIF-1alpha in normoxia. EMBO J. 2003;22(16):4082–4090. doi: 10.1093/emboj/cdg392. [DOI] [PMC free article] [PubMed] [Google Scholar]
- 5.Minamishima YA, et al. Somatic inactivation of the PHD2 prolyl hydroxylase causes polycythemia and congestive heart failure. Blood. 2008;111(6):3236–3244. doi: 10.1182/blood-2007-10-117812. [DOI] [PMC free article] [PubMed] [Google Scholar]
- 6.Minamishima YA, et al. A feedback loop involving the Phd3 prolyl hydroxylase tunes the mammalian hypoxic response in vivo. Mol Cell Biol. 2009;29(21):5729–5741. doi: 10.1128/MCB.00331-09. [DOI] [PMC free article] [PubMed] [Google Scholar]
- 7.Cori CF, Cori GT. Glycogen formation in the liver from d- and l-lactic acid. J Biol Chem. 1929;81(2):389–403. [Google Scholar]
- 8.Minamishima YA, Kaelin WG., Jr Reactivation of hepatic EPO synthesis in mice after PHD loss. Science. 2010;329(5990):407. doi: 10.1126/science.1192811. [DOI] [PMC free article] [PubMed] [Google Scholar]
- 9.Haase VH, Glickman JN, Socolovsky M, Jaenisch R. Vascular tumors in livers with targeted inactivation of the von Hippel-Lindau tumor suppressor. Proc Natl Acad Sci USA. 2001;98(4):1583–1588. doi: 10.1073/pnas.98.4.1583. [DOI] [PMC free article] [PubMed] [Google Scholar]
- 10.Halestrap AP. The SLC16 gene family - structure, role and regulation in health and disease. Mol Aspects Med. 2013;34(2-3):337–349. doi: 10.1016/j.mam.2012.05.003. [DOI] [PubMed] [Google Scholar]
- 11.Kikuchi D, Minamishima YA, Nakayama K. Prolyl-hydroxylase PHD3 interacts with pyruvate dehydrogenase (PDH)-E1β and regulates the cellular PDH activity. Biochem Biophys Res Commun. 2014;451(2):288–294. doi: 10.1016/j.bbrc.2014.07.114. [DOI] [PubMed] [Google Scholar]
- 12.Karim S, Adams DH, Lalor PF. Hepatic expression and cellular distribution of the glucose transporter family. World J Gastroenterol. 2012;18(46):6771–6781. doi: 10.3748/wjg.v18.i46.6771. [DOI] [PMC free article] [PubMed] [Google Scholar]
- 13.Felig P, Marliss E, Owen OE, Cahill GF., Jr Role of substrate in the regulation of hepatic gluconeogenesis in fasting man. Adv Enzyme Regul. 1969;7:41–46. doi: 10.1016/0065-2571(69)90008-9. [DOI] [PubMed] [Google Scholar]
- 14.Taniguchi CM, et al. Cross-talk between hypoxia and insulin signaling through Phd3 regulates hepatic glucose and lipid metabolism and ameliorates diabetes. Nat Med. 2013;19(10):1325–1330. doi: 10.1038/nm.3294. [DOI] [PMC free article] [PubMed] [Google Scholar]
- 15.Wei K, et al. A liver Hif-2α-Irs2 pathway sensitizes hepatic insulin signaling and is modulated by Vegf inhibition. Nat Med. 2013;19(10):1331–1337. doi: 10.1038/nm.3295. [DOI] [PMC free article] [PubMed] [Google Scholar]
- 16.Rui L. Energy metabolism in the liver. Compr Physiol. 2014;4(1):177–197. doi: 10.1002/cphy.c130024. [DOI] [PMC free article] [PubMed] [Google Scholar]
- 17.Inzucchi SE, Lipska KJ, Mayo H, Bailey CJ, McGuire DK. Metformin in patients with type 2 diabetes and kidney disease: A systematic review. JAMA. 2014;312(24):2668–2675. doi: 10.1001/jama.2014.15298. [DOI] [PMC free article] [PubMed] [Google Scholar]
- 18.Angus DC, van der Poll T. Severe sepsis and septic shock. N Engl J Med. 2013;369(9):840–851. doi: 10.1056/NEJMra1208623. [DOI] [PubMed] [Google Scholar]
- 19.Bakker J, Jansen TC. Don’t take vitals, take a lactate. Intensive Care Med. 2007;33(11):1863–1865. doi: 10.1007/s00134-007-0679-y. [DOI] [PMC free article] [PubMed] [Google Scholar]
- 20.Jansen TC, et al. LACTATE study group Early lactate-guided therapy in intensive care unit patients: A multicenter, open-label, randomized controlled trial. Am J Respir Crit Care Med. 2010;182(6):752–761. doi: 10.1164/rccm.200912-1918OC. [DOI] [PubMed] [Google Scholar]
- 21.Jones AE, et al. Emergency Medicine Shock Research Network (EMShockNet) Investigators Lactate clearance vs central venous oxygen saturation as goals of early sepsis therapy: A randomized clinical trial. JAMA. 2010;303(8):739–746. doi: 10.1001/jama.2010.158. [DOI] [PMC free article] [PubMed] [Google Scholar]
- 22.Wacharasint P, Nakada TA, Boyd JH, Russell JA, Walley KR. Normal-range blood lactate concentration in septic shock is prognostic and predictive. Shock. 2012;38(1):4–10. doi: 10.1097/SHK.0b013e318254d41a. [DOI] [PubMed] [Google Scholar]
- 23.Hams E, et al. The hydroxylase inhibitor dimethyloxallyl glycine attenuates endotoxic shock via alternative activation of macrophages and IL-10 production by B1 cells. Shock. 2011;36(3):295–302. doi: 10.1097/SHK.0b013e318225ad7e. [DOI] [PMC free article] [PubMed] [Google Scholar]
- 24.Moslehi J, et al. Loss of hypoxia-inducible factor prolyl hydroxylase activity in cardiomyocytes phenocopies ischemic cardiomyopathy. Circulation. 2010;122(10):1004–1016. doi: 10.1161/CIRCULATIONAHA.109.922427. [DOI] [PMC free article] [PubMed] [Google Scholar]
- 25.Kido M, et al. Hypoxia-inducible factor 1-alpha reduces infarction and attenuates progression of cardiac dysfunction after myocardial infarction in the mouse. J Am Coll Cardiol. 2005;46(11):2116–2124. doi: 10.1016/j.jacc.2005.08.045. [DOI] [PubMed] [Google Scholar]
- 26.Philipp S, et al. Stabilization of hypoxia inducible factor rather than modulation of collagen metabolism improves cardiac function after acute myocardial infarction in rats. Eur J Heart Fail. 2006;8(4):347–354. doi: 10.1016/j.ejheart.2005.10.009. [DOI] [PubMed] [Google Scholar]
- 27.Baranova O, et al. Neuron-specific inactivation of the hypoxia inducible factor 1 alpha increases brain injury in a mouse model of transient focal cerebral ischemia. J Neurosci. 2007;27(23):6320–6332. doi: 10.1523/JNEUROSCI.0449-07.2007. [DOI] [PMC free article] [PubMed] [Google Scholar]
- 28.Bernhardt WM, et al. Donor treatment with a PHD-inhibitor activating HIFs prevents graft injury and prolongs survival in an allogenic kidney transplant model. Proc Natl Acad Sci USA. 2009;106(50):21276–21281. doi: 10.1073/pnas.0903978106. [DOI] [PMC free article] [PubMed] [Google Scholar]
- 29.Hayashi S, McMahon AP. Efficient recombination in diverse tissues by a tamoxifen-inducible form of Cre: A tool for temporally regulated gene activation/inactivation in the mouse. Dev Biol. 2002;244(2):305–318. doi: 10.1006/dbio.2002.0597. [DOI] [PubMed] [Google Scholar]
- 30.Aragonés J, et al. Deficiency or inhibition of oxygen sensor Phd1 induces hypoxia tolerance by reprogramming basal metabolism. Nat Genet. 2008;40(2):170–180. doi: 10.1038/ng.2007.62. [DOI] [PubMed] [Google Scholar]
- 31.Bao Y, et al. Energy management by enhanced glycolysis in G1-phase in human colon cancer cells in vitro and in vivo. Mol Cancer Res. 2013;11(9):973–985. doi: 10.1158/1541-7786.MCR-12-0669-T. [DOI] [PubMed] [Google Scholar]
- 32.Shintani T, et al. Cystathionine beta-synthase as a carbon monoxide-sensitive regulator of bile excretion. Hepatology. 2009;49(1):141–150. doi: 10.1002/hep.22604. [DOI] [PubMed] [Google Scholar]
- 33.Bao W, et al. Chronic inhibition of hypoxia-inducible factor prolyl 4-hydroxylase improves ventricular performance, remodeling, and vascularity after myocardial infarction in the rat. J Cardiovasc Pharmacol. 2010;56(2):147–155. doi: 10.1097/FJC.0b013e3181e2bfef. [DOI] [PubMed] [Google Scholar]