

Abstract
Study Design Systematic review.
Objective To examine the relationship between the patient's preoperative expectations and short-term postoperative satisfaction and functional outcome in lumbar spine surgery.
Methods The Medline, Embase, and Cochrane databases were queried using a predefined search algorithm to identify all lumbar spine studies analyzing the influence of preoperative expectations on postoperative satisfaction and functional outcome. Two independent reviewers and a third independent mediator reviewed the literature and performed study screening, selection, methodological assessment, and data extraction using an objective protocol.
Results Of 444 studies identified, 13 met the inclusion criteria. Methodological quality scores ranged from 59 to 100% with the greatest variability in defining patient characteristics and the methods of assessing patient expectations. Patient expectations were assessed in 22 areas, most frequently back and leg pain expectations and general expectations. Functional outcome was assessed by 13 tools; the most common were the visual analog scale, Oswestry Disability Index (ODI), and Short Form Health Survey (SF-36). Positive expectations for symptomatology, activity, general health, and recovery correlated with satisfaction. General expectations correlated with higher SF-36 Physical Subcomponent scores, better global function, and lower ODI outcome. Conclusions on the influence of the expectations for pain were limited due to the study heterogeneity, but the evidence suggests a positive correlation between the expectation and outcome for back and leg pain.
Conclusions Positive expectations correlated significantly with short-term postoperative satisfaction and functional outcome, including higher SF-36 scores, earlier return to work, and decreased ODI scores. Future expectation-based investigations will benefit from implementation of the standardized methods of expectation, satisfaction, and outcome analysis discussed herein.
Keywords: spine surgery, expectations, satisfaction, functional outcome, quality assessment, patient counseling
Introduction
As the volume of lumbar spine cases and associated costs of treating lumbar spinal conditions rise, spine surgery has faced increasing scrutiny.1 2 3 Various measures have been used to study the effectiveness and outcomes in spine surgery. Patients' perception of the benefit gained from surgery and overall patient satisfaction have become recognized as important measures of the success of any intervention.4 Some authors even suggest these issues to be the most important outcome measurements.5 Ultimately, these perceptions determine whether the patients will be content with the treatment received and whether they will avail themselves of further health care resources.6
Preoperative expectations are a potentially important determinant of patient satisfaction with spinal surgery. Preoperative expectations in spine surgery refers to patient preferences with regard to postoperative outcome along any facet of patient symptomatology or function. Patient satisfaction refers to one's sentiment regarding a specific symptom or function, which may be analyzed as current satisfaction at follow-up or as percent attainment of preoperatively established expectations. Previous studies have demonstrated lower postoperative satisfaction in patients with unrealistic expectations prior to undergoing total joint replacement and spinal decompression.7 8 Other studies have shown that patients with higher expectations of success in spine surgery report better satisfaction.9 10 11 There is also some evidence to suggest that preoperative expectations play a role in the postoperative functional outcome.12 13 However, there is no consensus, and it remains unknown whether preoperative expectations in lumbar surgery affect the postoperative satisfaction or functional outcomes. Our objective is to apply the methodology of systematic reviews to determine whether the preoperative expectations of lumbar spine surgery affect patients' postoperative satisfaction and functional outcomes.
Methods
This systematic review addresses the question: “What is the short-term relationship between patient expectations and postoperative satisfaction and functional outcome in lumbar spine surgery?”
Inclusion/Exclusion Criteria
The authors sought to identify all studies (case–control, cohort, randomized control, and meta-analyses) that met the following inclusion criteria, which were defined into three categories: study population, independent variables, and the outcome measured. To this effect, studies were included if they (1) included patients undergoing specific spinal operations; (2) evaluated preoperative expectations; (3) examined the relationship between preoperative expectations, postoperative satisfaction, and/or functional outcomes. Due to paucity of non–lumbar spine studies, the inclusion criteria were amended to include only articles investigating the lumbar spine.
Literature Search
A literature review was conducted to identify all applicable studies from 1996 to November 15, 2014. An electronic database search of Medline was performed using medical subject headings and text word searching (Appendix 1). Briefly, using keyword and medical subject headings, the search was designed to cross-reference three individual searches of (1) spine literature (lines 1 to 10, Appendix 1), (2) operative interventions (lines 11 to 14, Appendix 1), and (3) expectations (lines 15 to 16, Appendix 1). The Medline algorithm was adapted for Embase. The Cochrane Database was queried using text words. Reference lists of accepted articles were searched. Expert opinion was sought.
Appendix 1. Medline database query conducted November 15, 2014.
| Line | Query | Results |
|---|---|---|
| 1 | exp Spine | 70,392 |
| 2 | exp Back | 8,631 |
| 3 | exp Spinal Diseases | 50,848 |
| 4 | exp Sciatica | 1,716 |
| 5 | exp Radiculopathy | 2,868 |
| 6 | Cervical Spine.mp. | 10,979 |
| 7 | Thoracic Spine.mp. | 3,041 |
| 8 | Thoracolumbar Spine.mp. | 1,081 |
| 9 | Thoracolumbar vertebrae.mp. | 90 |
| 10 | Lumbar.mp. | 61,906 |
| 11 | Surgery.mp. | 618,344 |
| 12 | Procedure.mp. | 371,150 |
| 13 | Operation.mp. | 166,415 |
| 14 | exp Orthopaedic Procedures | 145,328 |
| 15 | Expectation.mp. | 34,030 |
| 16 | Expectations.mp. | 34,030 |
| 17 | 1 or 2 or 3 or 4 or 5 or 6 or 7 or 8 or 9 or 10 | 134,875 |
| 18 | 11 or 12 or 13 or 14 | 1,096,651 |
| 19 | 15 or 16 | 47,782 |
| 20 | 17 and 18 and 19 | 166 |
Study Selection
Two independent reviewers evaluated each study record and abstract relevant to the study. The studies were excluded if both reviewers independently judged the inclusion criteria were not met. The reviewers were blinded to the authors, institutions, and journal of publication for the title and abstract review. Conference proceedings were excluded. The complete report of included studies was reviewed. Any disagreements were resolved by discussion and if necessary, mediation by a third reviewer.
Assessment of Methodological Quality
A quality assessment tool was adapted from a systematic review by Haanstra et al,14 based upon the work of Hayden et al.15 The tool is composed of 18 individual criteria divided among five categories (Appendix 2). Each criterion was assessed as positive (fulfilled), negative (not fulfilled), not applicable, or unknown. The criteria and grade (total positive criteria divided by total applicable criteria) were referenced when drawing final conclusions.
Appendix 2. Methodological assessment questionnaire applied to each study included in the review.
| Study population |
| 1. Is the source population adequately described (primarily in terms of indication and operation)? |
| 2. Is it clear how participants are recruited (consecutive, random, or selective sample)? |
| 3. Are inclusion and exclusion criteria described? |
| 4. Is the chance of selection bias small (is the study population an adequate representation of the source population)? |
| 5. Are at least five key baseline characteristics of the study population reported (e.g., gender, age, type of operation, indication for operation, litigation status, worker's compensation status)? |
| Measurement of determinant |
| 6. Is there a clear definition or description of the type of expectations measured? |
| 7. Is it clear how expectations are measured (questionnaire/interview, number of items, continuous/ordinal/dichotomous)? |
| 8. Are the majority of expectations evaluated on three or more categories (e.g., leg pain, back pain, return to work)? |
| 9. Are individual categories evaluated on a scale of 3 or more (e.g., dichotomous versus 5-point Likert scale)? |
| 10. Is the evaluator independent of the surgeon? |
| 11. Are disclosures revealed (e.g., financial conflict of interest)? |
| Outcome measurement |
| 12. Is it clear how the functional outcome is measured (questionnaire/interview/functional assessment, number of items, continuous/ordinal/dichotomous)? |
| 13. Is it clear how satisfaction is measured (questionnaire/interview, number of items, continuous/ordinal/dichotomous)? |
| 14. Is the follow-up rate adequate (>80% is adequate)? |
| 15. Is it plausible that there is no selective dropout during follow-up? |
| Confounding measurement and account |
| 16. Are confounding variables identified? |
| 17. Are appropriate methods used to account for the confounders in the analyses? |
| Analysis |
| 18. Is an appropriate statistical method used for the analyses? |
Criterion were assigned values of either positive (criteria fulfilled), negative (criteria not fulfilled), not applicable (NA), or unknown (Unk). The questionnaire was adapted from Hayden JA, Côté P, Bombardier C. Evaluation of the quality of prognosis studies in systematic reviews. Ann Intern Med 2006;144(6):427–437,15 and Haanstra TM, van den Berg T, Ostelo RW et al. Systematic review: do patient expectations influence treatment outcomes in total knee and total hip arthroplasty? Health Qual Life Outcomes 2012;10:152.14
Data Extraction
Data extraction was conducted by two independent reviewers based upon the critical review from Law et al.16 Any disagreements were resolved by discussion and if necessary mediation by a third reviewer.
Results
Study Selection
Fig. 1 outlines the study selection process. Briefly, 444 references were identified by the literature search: 166 Medline, 278 Embase, 0 Cochrane articles. Expert recommendation identified 12 potential studies. Bibliography review of the accepted studies identified 46 potential studies. The abstracts were reviewed for 104 of the 444 references identified in the literature review. The eliminated abstracts either failed to investigate lumbar spine surgery-related topics or examined non-expectation-based outcomes. Duplicate studies were removed from the remaining 56 studies (23 Medline, 28 Embase, 5 expert), and the complete articles were reviewed; similarly, studies failing to address the inclusion criteria were eliminated. Thirteen studies were included in the final systematic review.
Fig. 1.
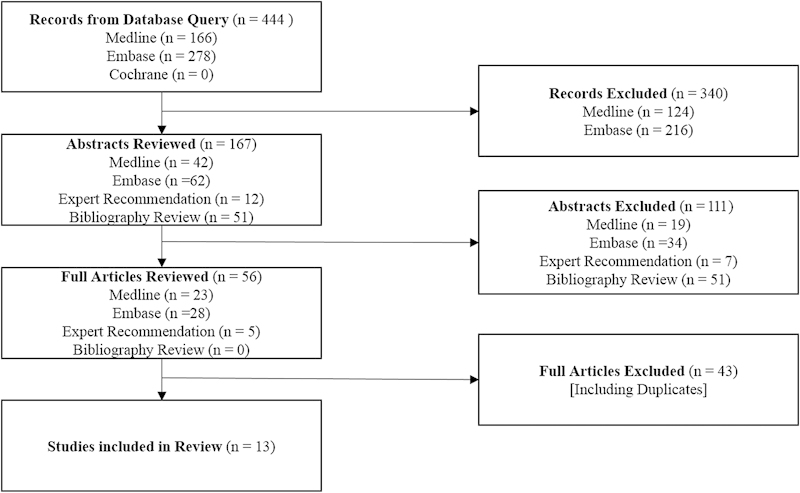
Flowchart of study selection.
Study Characteristics
The characteristics and results of the 13 studies are presented in Table 1. The studies enrolled 2,366 patients (range 5917 to 367,10 mean 182, standard deviation 99). Final follow-up ranged from 679 to 100%18 (mean 88%, standard deviation 9%). Studied operations included diskectomy9 12 13 18 19 20 and decompression alone or with fusion.6 7 10 11 12 13 18 19 20 21
Table 1. Study characteristics.
| Study (level of evidence*) | Patients at follow-up/enrolled (% follow-up) | Follow-up | Intervention | Expectation assessment tool | Timing expectation measurement | Satisfaction assessment tool | Outcome assessment tool |
|---|---|---|---|---|---|---|---|
| de Groot et al13 (cohort) | 107/120 (89%) | 3 mo | Lumbar diskectomy (n = 101); lumbar decompression (n = 19), fusion (n = 0) (level not reported) | 2 items (5-point scale): rate of recovery, return to work; 2 items (4-point scale): leg pain, back pain | Day prior to operation | 10 item (4-point scale): symptoms disappeared, day after surgery, decision to operate, disappointment with operation, feel better than preoperative, fulfilled wishes for operation, operation turned out badly, satisfaction with operation, more complaints than expected, operation exceeded expectations | 2 items (0–100 VAS): leg pain, back pain |
| Gepstein et al10 (retrospective cohort) | 298/367 (81%) | 42 mo (0–10 y) | Lumbar decompression (level not reported) | 1 item (2-point scale): preoperative expectations | Preoperatively (not otherwise specified) | 1 item (4-point scale): satisfaction | Barthel Index; walking distance |
| Iversen et al11 (cohort) | 228/257 (89%) | 6 mo | Lumbar decompression: single level (n = 59), two levels (n = 85), multiple levels (n = 113), with fusion (n = 75), with diskectomy (n not reported) | 4 items (2 point scale): pain relief, physical function (walking capacity), social role, independence; 2 items (open-ended): list ways life will be improved, activities expected to perform but currently unable; 1 item (5-point scale): recovery time | Preoperatively (not otherwise specified) | 2 items (4-point scale): pain relief, physical function (walking capacity) | Mental health index; Sickness Impact Profile; Zung Depression Scale; 4 items (4-point Likert): walking capacity scale; 1 item (6-point scale): level of pain |
| Johansson et al17 (cohort*) | 55/59 (93%) | 12 mo | Lumbar disk | 1 item (10-point scale): expectation to work in 3 mo | 7–14 d preoperatively | Not assessed | EuroQol 5D; Oswestry Disability Index; 2 items (VAS): leg pain, back pain |
| Licina et al18 (case series) | 145/145 (100%) | 6 mo | Lumbar single-level diskectomy (n = 58); laminectomy (n = 20); laminectomy and fusion (n = 27); TLIF (n = 27); ALIF (n = 13) | 3 items: value least acceptable to be satisfied; Oswestry Disability Index; back pain (0–10 VAS); leg pain (0–10 VAS) | Preoperatively (not otherwise specified) | 1 item (5-point Likert): general satisfaction | Oswestry Disability Index; 2 items (0–10 VAS): leg pain, back pain |
| Lutz et al9 (cohort) | 183/273 (67%) | 12 mo | Lumbar diskectomy | 2 items (5-point scale): expected recovery time, desirability of surgery; 1 item (3-point scale): expected health state postoperatively | Preoperatively (not otherwise specified) | 4 items (7-point scale): leg pain, leg/foot/groin numbness/tingling, leg/foot weakness, back/leg pain with sitting; 1 item (5-point scale): satisfaction remaining at current symptoms | Roland-Morris disability scale; SF-36 |
| Mannion et al9 (cohort*) | 2 mo 100/100 (100%); 12 mo 96/100 (96%) | 2 mo; 12 mo | Lumbar decompression (level not reported) fusion (n = 0) | Modified NASS Lumbar Spine Questionnaire; 8 items (5-point Likert): leg pain, back pain, walking capacity, independence in activities, general physical capacity; sports, social contacts; mental well-being | Preoperatively (not otherwise specified) | 8 items (5-point scale): leg pain, back pain, walking capacity, independence, sport, general function, social function, mental well-being; 1 item: most important symptom change; 1 item (3-point scale): general meeting expectation; 1 item (5-point scale): global effectiveness of operation | Roland-Morris disability scale |
| McGregor and Hughes7 (cohort) | 6 wk 72/77 (94%); 6 mo 68/77 (88%); 12 mo 65/77 (77%) | 6 wk; 6 mo; 12 mo | Lumbar decompression unilateral (n = 13), bilateral (n = 64), single level (n = 18), multiple level (n = 59), fusion (n = 5), refused surgery (n = 7) | Cantril Life Satisfaction Scale; Oswestry Disability Index; SF-36; 7 items (5-point Likert): function, general health, pain, life satisfaction, general satisfaction, confidence in outcome, importance of outcome; 2 items (0–100 VAS): leg pain, back pain | 6 wk preoperatively | 4 items (5-point Likert): general improvement, pain, function, life satisfaction; 3 items (0–100 VAS): satisfaction with operation, achieved pre-operative goal, decision for operation | Cantril Life Satisfaction; Oswestry Disability Index; SF-36; 2 items (0–100 VAS): leg pain, back pain |
| McGregor et al22 (cohort*) | 6 wk 245/338 (72%); 6 mo 233/338 (69%); 12 mo 293/338 (87%) | 6 wk; 6 mo; 12 mo | Lumbar diskectomy lumbar decompression | 3 items (0–100 VAS): leg pain, back pain, state of health | Preoperatively (not otherwise specified) | 3 items (0–100 VAS): leg pain, back pain, state of health | EuroQol 5D; 3 items (0–100 VAS): leg pain, back pain, state of health |
| Rönnberg et al19 (cohort) | 148/172 (86%) | 24 mo | Lumbar single-level diskectomy | 5 items (3-point continuum): leg pain, back pain, sensibility, muscle function, return to work | Preoperatively (not otherwise specified) | 1 item (3-point scale): global satisfaction | Macnab classification; 4 items (3-point continuum): leg pain, back pain, sensibility, muscle function; 1 item (2-point scale): work status |
| Cobo Soriano et al21 (cohort) | 184/203 (91%) | 12 mo | Lumbar decompression and fusion single level (n = 95), two levels (n = 55), multiple levels (n = 34), not reported (n = 19) | 1 item (open-ended): symptom relief | Preoperatively (not otherwise specified) | 1 item: satisfaction with results no specific information available) | Oswestry Disability Index; SF-36; 2 items (0–100 VAS): leg pain, back pain |
| Toyone et al20 (cohort) | 98/100 (98%) | 24 mo | Lumbar diskectomy (n = 50), lumbar laminotomy (n = 50) (1–4 levels, mean 2 levels) | 5 items (4-point scale): leg pain, leg numbness, low back pain, walking, activities of daily living; 2 items (0–100 VAS): success of surgery, lumbar complications | Preoperatively (not otherwise specified) | 1 item (4-point scale): satisfaction with surgery | Roland-Morris disability scale; SF-12; 5 items (0–100 VAS): leg pain, leg numbness, low back pain, walking ability, activity of daily living |
| Yee et al12 (cohort) | 143/155 (92%) | Decompress 6 mo; fusion 12 mo | Lumbar decompression: single level (n = 66); two levels (n = 20); multiple levels (n = 8); not reported (n = 8); lumbar fusion: single level (n = 24), multiple level (n = 25); not reported (n = 4) | 7 items (6-point scale): back pain, leg pain, numbness/weakness/instability, household activities, sleep comfort, return to work/activities of daily living, recreational activities | 1 wk preoperatively | 7 items (5-point scale): back pain, leg pain, numbness/weakness/instability, household activities, sleep comfort, return to work/activities daily living, recreational activities | Oswestry Disability Index; SF-36 |
Abbreviations: ALIF, anterior lumbar interbody fusion; ODI, Oswestry Disability Index; SF-12, Short Form Health Survey 12; SF-36, Short Form Health Survey 36; TLIF, transforaminal lumbar interbody fusion; VAS, visual analog scale.
The study population was part of a larger randomized control study.
Follow-up ranged from 313 to 24 months19 20 in studies with fixed follow-up. The study by Gepstein et al reported only the mean follow-up (41.6 months) of their retrospective cohort.10
Assessment of Methodological Quality
The individual results of the methodological quality assessment are reported in Table 2. The methodological quality was between 5910 and 100%22 (mean 86%, standard deviation of 11%). Deficiencies included insufficient characterization of baseline study population,7 12 19 20 expectation evaluation with dichotomous scales,10 11 21 and failure to identify10 18 19 20 and to assess confounding factors.10 18 19 20
Table 2. Methodological assessment.
| 1 | 2 | 3 | 4 | 5 | 6 | 7 | 8 | 9 | 10 | 11 | 12 | 13 | 14 | 15 | 16 | 17 | 18 | Total score | Total score (%) | |
|---|---|---|---|---|---|---|---|---|---|---|---|---|---|---|---|---|---|---|---|---|
| de Groot et al13 | + | + | + | + | + | + | + | + | + | + | − | + | + | + | + | + | + | + | 17/18 | 94 |
| Gepstein et al10 | + | + | − | + | + | − | + | − | − | Unk | − | + | + | + | + | − | − | + | 10/17 | 59 |
| Iversen et al11 | + | + | + | + | + | + | + | + | − | + | + | + | + | + | + | + | + | + | 17/18 | 94 |
| Johansson et al17 | + | + | + | + | + | + | + | − | + | + | + | + | NA | + | + | + | + | + | 16/17 | 94 |
| Licina et al18 | + | + | + | − | + | + | + | + | + | + | + | + | + | + | + | − | − | − | 14/18 | 78 |
| Lutz et al9 | + | + | + | + | + | + | + | + | + | Unk | + | + | + | − | − | + | + | + | 15/17 | 88 |
| Mannion et al9 | + | + | + | + | + | + | + | + | + | + | + | + | + | + | + | + | + | + | 16/18 | 89 |
| McGregor and Hughes7 | + | + | + | + | − | + | + | + | + | + | + | + | + | + | + | + | + | + | 17/18 | 94 |
| McGregor et al22 | + | + | + | + | + | + | + | + | + | Unk | + | + | + | + | + | + | + | + | 17/17 | 100 |
| Rönnberg et al | + | + | + | + | − | + | + | + | + | + | + | + | + | + | + | − | − | + | 15/18 | 83 |
| Cobo Soriano et al21 | + | + | + | + | + | + | − | − | − | + | − | + | − | + | + | + | + | + | 13/18 | 72 |
| Toyone et al20 | + | − | + | + | − | + | + | + | + | + | + | + | + | + | + | − | − | + | 14/18 | 78 |
| Yee et al12 | + | + | + | + | − | + | + | + | + | + | + | + | + | + | + | + | + | + | 17/18 | 94 |
Note: Articles were reviewed according to each criterion of the methodological assessment questionnaire (Fig. 1). Criteria were evaluated as + (criteria fulfilled), − (criteria not fulfilled), NA (not applicable), or Unk (unknown). Total score calculated as fulfilled criteria divided by sum of fulfilled and not fulfilled criteria).
Preoperative Expectations
Expectation assessment methods were organized into five categories: expectations regarding symptomatology, activities, general health, recovery, and other expectations (Table 3). The most frequent category was symptomatology (20 assessments from 10 studies) and activities (15 assessments from 6 studies). The most commonly assessed expectations were the expectations for back or leg pain,6 12 13 18 20 22 followed by general expectations6 10 11 20 and return to work.12 13 17 19
Table 3. Patient expectation assessment tools.
| de Groot et al13 | Gepstein et al10 | Iversen et al11 | Johansson et al17 | Licina et al18 | Lutz et al9 | Mannion et al9 | McGregor and Hughes7 | McGregor et al22 | Rönnberg et al19 | Cobo Soriano et al21 | Toyone et al20 | Yee et al12 | Total | |
|---|---|---|---|---|---|---|---|---|---|---|---|---|---|---|
| Symptomatology | ||||||||||||||
| Back pain | + | + | + | + | + | + | 6 | |||||||
| General pain | + | + | 2 | |||||||||||
| General symptom relief | + | 1 | ||||||||||||
| Leg numbness/weakness/instability | + | + | 2 | |||||||||||
| Leg pain | + | + | + | + | + | + | 6 | |||||||
| Sensibility | + | 1 | ||||||||||||
| Sleep comfort | + | 1 | ||||||||||||
| Activities | ||||||||||||||
| Activities of daily living | + | + | + | 3 | ||||||||||
| General function | + | 1 | ||||||||||||
| General physical | + | + | 2 | |||||||||||
| Independence in general activities | + | + | 2 | |||||||||||
| Recreational activities | + | + | 2 | |||||||||||
| Social life | + | + | 2 | |||||||||||
| Walking | + | + | + | 3 | ||||||||||
| General health | ||||||||||||||
| General, undefined expectations | + | + | + | + | 4 | |||||||||
| Health state | + | + | + | 3 | ||||||||||
| Life satisfaction | + | 1 | ||||||||||||
| Mental well-being | + | 1 | ||||||||||||
| Recovery | ||||||||||||||
| Complications | + | 1 | ||||||||||||
| Recovery time | + | + | + | 3 | ||||||||||
| Return to work | + | + | + | + | 4 | |||||||||
| Other | ||||||||||||||
| Oswestry Disability Index | + | 1 | ||||||||||||
Note: Preoperative expectation evaluation tools are arranged into five categories based upon type of expectation statement. + identifies tools applied to evaluate patient preoperative expectations.
The expectations were quantified through open-ended questions, visual analog scales, and multiple point scales. Nine studies applied scales with 4 or more points,6 7 9 11 12 13 17 18 20 22 two studies employed 3-point scales,9 19 and two studies employed 2-point scales.10 11 Two studies utilized open-ended questions.11 21
Postoperative Satisfaction
Eight studies asked about patients' general satisfaction.6 7 10 11 18 19 20 21 Six studies assessed satisfaction with specific symptoms.6 7 9 12 19 22 Unique tools included a postoperative disappointment survey.13
Functional Outcome
Thirteen functional outcome tools were utilized (Table 4), including the most commonly applied visual analog scale for leg and back pain,7 17 18 19 20 21 22 Oswestry Disability Index (ODI),7 12 18 19 21 and Short Form Health Survey (SF-36).7 9 12 20 21 Although the ODI versions are unknown, two studies7 19 referenced the original publication by Fairbank et al,23 and one study20 referenced a 1995 Spanish translation of the ODI.24 One study evaluated walking distance.10 Other outcome tools included: EuroQol 5D,17 22 Barthel index,10 Cantril Life Satisfaction,7 Macnab classification,19 and the Sickness Impact Profile.11
Table 4. Functional outcome assessment tools.
| de Groot et al13 | Gepstein et al10 | Iversen et al11 | Licina et al18 | Johansson et al17 | Lutz et al9 | Mannion et al9 | McGregor and Hughes7 | McGregor et al22 | Rönnberg et al19 | Cobo Soriano et al21 | Toyone et al20 | Yee et al12 | Total | |
|---|---|---|---|---|---|---|---|---|---|---|---|---|---|---|
| Barthel Index | + | 1 | ||||||||||||
| Cantril Life Satisfaction | + | 1 | ||||||||||||
| EuroQol 5D | + | + | 2 | |||||||||||
| Macnab classification | + | 1 | ||||||||||||
| Oswestry Disability Index | + | + | + | + | + | + | 5 | |||||||
| Roland-Morris Disability | + | + | 2 | |||||||||||
| SF-36 | + | + | + | +* | + | 5 | ||||||||
| Return to work | + | 1 | ||||||||||||
| Sickness Impact Profile | + | 1 | ||||||||||||
| VAS back pain | + | + | + | + | + | + | + | 7 | ||||||
| VAS health state | + | 1 | ||||||||||||
| VAS leg pain | + | + | + | + | + | + | + | 7 | ||||||
| Walking distance | + | 1 | ||||||||||||
| SF-12 |
Abbreviations: SF, Short Form Health Survey, VAS, visual analog scale.
Note: + identifies tools applied by respective studies for assessment of functional outcome.
Indicates SF-12.
Results of Individual Studies
The relevant conclusions and significances are reported in Table 5.
Table 5. Study conclusions.
| Study | Positive correlation | Significance | Negative correlation | Significance | No significant correlation |
|---|---|---|---|---|---|
| Correlating preoperative expectations and postoperative satisfaction | |||||
| de Groot et al13 | Expectation of no (1) leg, (2) back pain had less disappointment at 3 d [significant when pain covariate p < 0.001 (1) and (2)]; expectation of no (3) leg, (4) back pain had less disappointment at 3 mo [not significant when pain covariate p = 0.25 (1) and (2)] | (1) p < 0.001; (2) p < 0.001; (3) p < 0.005; (4) p < 0.005 | Postoperative disappointment and expectations for: (1) rate of recovery, (2) returning to work | ||
| Gepstein et al10 | Positive expectation associated with satisfaction | p < 0.001, OR 2.9 (1.61–5.23) | |||
| Iversen et al11 | Ambitiousness of expectations correlated with satisfaction with walking capacity | p = 0.043 | Greater expectation for pain relief correlated with decreased satisfaction with pain relief | p = 0.004 | |
| Johansson et al17 | Not assessed | ||||
| Licina et al18 | Very satisfied patients and expectations for: Oswestry Disability Index; back pain VAS; leg pain VAS | ||||
| Lutz et al9 | Those who expected shorter recovery (less than 3 mo) were more satisfied at 12 mo | OR 2.2 (1.1–4.4) | Expectation to return to usual health and satisfaction | ||
| Mannion et al9 | Not assessed | ||||
| McGregor and Hughes7 | Patients who rated themselves as either satisfied or very satisfied at the 6-wk review remained satisfied with the procedure at subsequent reviews, whereas those who were dissatisfied at 6 wk became progressively more dissatisfied at the subsequent reviews (no significance reported) | ||||
| McGregor et al22 | Satisfaction remained high despite expectations greater than outcome for: health VAS; back pain VAS; leg pain VAS | ||||
| Rönnberg et al19 | Global Satisfaction and expectation for: (1) sensibility, (2) muscle function; patients with no expectation for return to work were less satisfied with treatment (3) | (1) p = 0.001; (2) p = 0.016; (3) p = 0.029 | Global satisfaction and expectation for leg pain (p = 0.050), back pain | ||
| Cobo Soriano et al21 | Not assessed | ||||
| Toyone et al20 | Diskectomy fulfillment of expectations with greater expectations for (1) overall surgical success, (2) leg numbness | (1) p = 0.016; (2) p = 0.048 | Fulfillment and expectations (diskectomy/stenosis): leg pain (p = 0.729)/(p = 0.720); back pain (p = 0.768)/(p = 0.535); leg numbness (N/A)/(p = 0.073); walking (p = 0.291)/(p = 0.768); overall success (N/A)/(p = 0.705); complication (p = 0.139)/(p = 0.665) | ||
| Yee et al12 | Not assessed | ||||
| Correlating preoperative expectations and functional outcome | |||||
| de Groot et al13 | Expecting no leg pain (no history of back pain) had lowest postoperative followed by expecting no leg or back pain followed by expectation of pain: (1) leg pain at 3 d [not significant at 3 mo (p = 0.10)]; (2) back pain at 3 mo [not significant at 3 d (p = 0.41)] | (1) p = 0.024; (2) p < 0.001 | Postoperative pain and expectations: rate of recovery, return to work | ||
| Gepstein et al10 | Not assessed | ||||
| Iversen et al11 | Number of expectation statements correlated with global function | β = –2.0; p = 0.003 | Greater number of expectations for pain relief correlated with greater pain | p = 0.009 | Ambitiousness of expectation for walking capacity and outcome for walking capacity (p = 0.057) |
| Johansson et al17 | Low expectation to return to work at 3 mo correlated with 12-mo postoperative (1) being on sick leave; (2) greater leg pain; (3) greater back pain; (4) greater ODI; (5) lower EuroQol 5D | OR (95% CI): (1) 19.5 (2.1–179.2); (2) 8.2 (1.7–41.1); (3) 9.7 (1.9–49.1); (4) 13.8 (2.2–79.8); (5) 0.2 (0.3–0.9) | |||
| Licina et al18 | Not assessed | ||||
| Lutz et al9 | Expectations for recovery time, recovery extent, and return to usual health: Roland disability (p > 0.05); SF-36 (p > 0.05) | ||||
| Mannion et al9 | Fulfillment of expectation for worst symptom explained the greatest variance in global treatment effectiveness (2 and 12 mo) | β = –0.448, p = 0.012 | Expectation and outcome: leg pain, back pain; expectation for general physical capacity and Roland-Morris disability | ||
| McGregor and Hughes7 | Not assessed | ||||
| McGregor et al22 | Expectation and outcome for: (1) health VAS; (2) back pain VAS; (3) leg pain VAS | Rank correlation: 6 wk, 0.20–0.26; 6 mo, 0.20–0.28; 2 mo, 0.20–0.22 | |||
| Rönnberg et al19 | Level of expectation for improvement of (1)–(4) correlated with outcome: (1) leg pain, (2) sensibility, (3) muscle function, (4) return to work | (1) p = 0.036; (2) p = 0.013; (3) p = 0.013; (4) p = 0.021 | Expectation for improvement and outcome: back pain (p ≥ 0.05) | ||
| Cobo Soriano et al21 | Expectation for improvement correlated with (1) leg pain, (2) ODI | (1) β 12.48 (1.47–24.03); (2) β 6.28 (0.12–12.44) | Expectation for improvement and outcome: back pain, SF-36 PCS | ||
| Toyone et al20 | Expectation and postoperative: leg pain, back pain, leg numbness, walking ability, usual activity | ||||
| Yee et al12 | Expectations correlated with outcome, SF-36 PCS | p = 0.002, OR 3.7 (1.59–8.58) | Expectation and postoperative ODI | ||
Abbreviations: CI, confidence interval; ODI, Oswestry Disability Index; OR, odds ratio; SF-36 MCS, Short Form Health Survey 36 Mental Subcomponent; SF-36 PCS, Short Form Health Survey 36 Physical Subcomponent; VAS, visual analog scale.
Note: Positive, negative, and insignificant correlations presented for each study exploring the relationship between preoperative expectations and postoperative satisfaction, as well as, preoperative expectations and functional outcome. Significance and effect size presented where available.
Preoperative Expectations and Satisfaction
Regarding symptomatology, Rönnberg et al concluded a positive correlation between the expectation for sensibility and satisfaction at 24 months.19 The expectations for leg numbness and satisfaction were positively correlated in patients having diskectomy but not patients having decompression at 24 months.20
One study examined the expectation for general pain and satisfaction, noting a negative correlation between the expectation for pain relief and satisfaction with pain relief at 6 months.11 The expectation for no postoperative leg or back pain positively correlated with satisfaction at 3 days and 3 months (insignificant at 3 months when pain was included as covariate),13 whereas other authors noted no significant relationship at 6, 12, 24, and 24 months, respectively.18 19 20 22
Activity expectations revealed muscle function expectations correlated positively with satisfaction at 24 months.19 Ambitiousness of the expectations positively correlated with satisfaction at 6 months,11 but no significant correlation was noted between walking expectation and satisfaction with walking at 24 months.20
Two studies identified positive correlations,10 20 and two studies concluded nonsignificant correlations9 20 between the expectations for general health and satisfaction. The positive correlation of Gepstein et al reported patients having lumbar decompression and diskectomy together at 42 months.10 Although Toyone et al followed patients having diskectomy and decompression, only the 24-month correlation for the diskectomy group significantly correlated with satisfaction.20 Two studies noted no significant correlations: Lutz et al noted no significant correlation between the expectation for return to health state and satisfaction at 12 months,9 and McGregor et al concluded that patients remained satisfied despite the expectations exceeding outcome from health state.22
Expectations for recovery revealed positive correlations at 129 and 24 months19 and insignificant correlations at 313 and 24 months.20 Although there was an insignificant correlation between expected recovery rate and disappointment at 3 months,13 there was a significant positive correlation between the expectation of short recovery (<3 months) and satisfaction at 12 months.9 The former study educated patients on profession-specific recovery time but did not stratify results based upon profession or inquire worker's compensation or litigation status.13 Those expecting to return to work were more likely to return at 24 months,19 whereas there was no correlation with disappointment were more likely to return at 3 months.13
Preoperative Expectations and Functional Outcome
General expectations correlated with better SF-36 Physical Subcomponent (PCS),12 better global function,11 and decreased leg pain.21 Although general expectations positively and significantly correlated with decreased postoperative ODI at 12 months,21 Yee et al did not note any correlation with ODI.12 There was no correlation between expectation for general physical capacity and postoperative Roland-Morris disability score.6 Additionally, no correlation was found between the expected improvement and outcome in leg numbness, usual activities, or expectation for recovery with postoperative Roland Morris disability,9 SF-36,9 or postoperative pain.13
The expected improvement in leg pain,19 muscle function,19 sensibility,19 and return to work19 were positively associated with their outcome at 24 months. Iversen et al concluded that the number of expectation statements correlated positively with global function at 6 months.11 However, a negative correlation was noted between the expected and achieved general health at 12 months22 and no correlation was noted between general function expectation and function at 12 and 24 months.12 20 No correlation was noted between the ambitiousness of walking expectation11 or expected walking improvement20 and postoperative walking. Johansson et al noted a significant correlation between low expectations to return to work at 3 months and being on sick leave, experiencing greater back and leg pain, greater ODI score, and lower EuroQol 5D score at 12 months.17
Regarding pain, de Groot et al noted that patients expecting no leg pain (no history of back pain) or expecting no leg pain or back pain experienced less leg pain at 3 days (not significant at 3 months) and back pain at 3 months (not significant at 3 days).13 McGregor et al noted a significant positive correlation between the expectation for back and leg pain with their outcome at 6 weeks, 6 months, and 12 months postoperatively.22 The expectations for improvement in leg pain positively correlated with leg pain (not correlated for back pain) in patients who had diskectomy at 24 months.19 A negative correlation was noted between the number of expectations for pain relief and pain in patients who had decompression at 6 months.11 There was no significant correlation between the expectation for improvement and outcome in back pain,19 21 between the expectation for improvement in leg or back pain and postoperative pain,20 or between the expectation for leg or back pain and postoperative pain.6
Discussion
The increasing scrutiny on costs has made it imperative to focus on optimizing health care. Various measures are used to judge the success of spine surgery and thereby the cost–benefit ratio to society. Perceptions of the benefit gained, including patient satisfaction, is an important determinant of this evaluation,5 which ultimately has a direct bearing on whether the patients continue to avail themselves of health care resources.6 We sought to study the short-term relationship between the expectations, satisfaction, and functional outcome in lumbar spine surgery.
In general, the expectations for symptomatology, general health, activity, and recovery in lumbar surgery correlated positively with satisfaction. The expectations for activity and recovery positively correlated with satisfaction at 6 months and beyond. The relationship between pain expectations and satisfaction is difficult to conclude due to the heterogeneity within results, but a trend is noted where the expectations correlated positively with satisfaction at earlier (<6 months) and later (>24 months) time points, but was insignificant at the midterm (6 to 24 months). This trend should be noted in the context of lower-quality long-term studies, along with short-term results that were insignificant when pain was a covariate, and may reflect a true absence of correlation, but is more likely representative of the difficulty in analyzing the relationship due to the heterogeneity of the lumbar spine literature with regards to factors including patient demographics, underlying pathology and chronicity of symptoms, preoperative counseling, procedure, method of assessing expectation and satisfaction, and the dynamic nature of surgical recovery with respect to time.
General expectations correlated positively with postoperative outcome with regards to SF-36 PCS, and global function. The expectations for muscle function, sensibility, and return to work correlated positively with their respective outcome. Of the two studies examining expectations for relief of symptoms and ODI, one reported a positive correlation, whereas the other failed to detect a significance.
One of the primary reasons patients seek lumbar spine surgery is for alleviation of pain. Unfortunately, due to the unpredictable nature of spine surgery, including etiology, chronicity of symptoms, and medical and surgical history, it is difficult to predict which patients may experience the greatest symptom relief. As we counsel our patients, it is important to understand the influence of patient expectations for pain on satisfaction and outcome. Although the results presented herein are mixed, demonstrating a significant correlation for leg pain but not back pain, it is important to remember the multifactorial contributions to patient pain. Furthermore, when considering the role of expectations, the limitations of this study (including lack of uniformity in methods of expectation assessment) and diversity of patient populations (including baseline characteristics for example worker's compensation or litigation status) may obscure the true influence of expectations.
There are several limitations to this lumbar spine review. First, the studies examined expectations, satisfaction, and functional outcome in multiple areas, through several methods including dichotomous, multiple-choice, and open-ended questions. Additionally, as the studies varied with respect to demographics, surgical indications, type and level of operation, and follow-up time, it was difficult to generalize the effect of preoperative expectations. We initially sought to conduct a meta-analysis that would permit a more definite conclusion on the basis of magnitude and significance of associations. Unfortunately, due to the factors previously described and due to the variations in statistical analysis, it was not possible to conduct a meta-analysis. Second, our search strategy might have failed to identify studies that incorporated a review of expectations as part of a multivariable model but did not include the result in the abstract, potentially due to negative or insignificant results. This limitation was raised by Haanstra et al, who to assess this hypothesis examined a random sample of 50 references from their initial rejected papers and located no additional studies.14
Reflecting upon these limitations, we conclude with several recommendations for future expectation-based lumbar spine investigations. In a study on expectation assessment in orthopedic surgery, Zywiel et al25 documented 47 different tools with only five implemented by more than one group of investigators. Mirroring this study, we support the implementation of a limited number of validated expectation tools to maximize the strength of subsequent reviews and facilitate future meta-analyses.
For the assessment of expectation and satisfaction, the authors advocate the avoidance of dichotomous scales in favor of visual analog and multiple-point Likert scales. We recommend employing a single measurement scale throughout a study. In the formulation of expectation surveys, authors should focus on a multitude of concise, explicit statements, for example, on a visual analog scale where 0 is no expectations and 100 is greatest possible expectations, how much back pain do you expect at 3, 6, 12, 24 months? Furthermore, as satisfaction is dynamic with regard to the postoperative timing, we recommend a two-pronged approach to differentiate between satisfaction/fulfillment of initial expectations and overall satisfaction. When assessing fulfillment of initial expectations, we recommend comparing the patients' current symptomatology with baseline expectations. For example, at enrollment, enquire about patient's visual analog scale expectation for back pain at specific time points, and then at each follow-up enquire about their current level of back pain. In the assessment of overall satisfaction, in addition to general satisfaction questions, we recommend asking about satisfaction of each individual expectation through the same measurement tool and using the same questions, for example, “On a visual analog scale, how satisfied are you with your back pain?”
Regarding the functional outcome, we recommend employing well-validated robust tools including the ODI and the SF-36 (with versions referenced). The ODI and SF-36 are two of the most commonly applied questionnaires for the assessment of function. The merit of these tools is in their simplicity and ease of implementation. The ODI assesses 10 areas of general function, including mobility and social life. Similarly, the SF-36 assesses patient physical and mental health through a 36-question survey. As these surveys are validated, are commonly applied, are short in length, and may be self-administered, therefore obviating the cost and time requirement of additional clinic visits, they are ideal tools for the longitudinal assessment of patient function and recovery both physically and mentally.
Finally, the authors recommend multivariate analysis to control for confounders such as patient demographics, comorbidities, psychological factors, worker's compensation, baseline functional status, as well as operative indication and level. Regarding timing and frequency of assessment, McGregor and Hughes concluded that those who were satisfied at 6 weeks remained satisfied, whereas those unsatisfied became progressively dissatisfied; therefore, it will be important to assess patients early and throughout recovery.7
In summary, this review demonstrates a positive correlation between patient expectations and postoperative satisfaction and functional outcome in lumbar spine surgery. Furthermore, it underscores the need for additional research, based upon standardized assessment tools, to allow the community to gain a greater understanding of these important issues in future studies.
Footnotes
Disclosures Daniel J. Ellis, none Scott S. Mallozzi, none Jacob E. Mathews, none Isaac L. Moss, none Jean A. Ouellet, Consultancy: Depuy-Synthes; Educational presentations: AO Foundation Peter Jarzem, none Michael H. Weber, none
References
- 1.Martin B I, Turner J A, Mirza S K, Lee M J, Comstock B A, Deyo R A. Trends in health care expenditures, utilization, and health status among US adults with spine problems, 1997–2006. Spine (Phila Pa 1976) 2009;34(19):2077–2084. doi: 10.1097/BRS.0b013e3181b1fad1. [DOI] [PubMed] [Google Scholar]
- 2.Davis H. Increasing rates of cervical and lumbar spine surgery in the United States, 1979–1990. Spine (Phila Pa 1976) 1994;19(10):1117–1123, discussion 1123–1124. doi: 10.1097/00007632-199405001-00003. [DOI] [PubMed] [Google Scholar]
- 3.Weinstein J N, Lurie J D, Olson P R, Bronner K K, Fisher E S. United States' trends and regional variations in lumbar spine surgery: 1992–2003. Spine (Phila Pa 1976) 2006;31(23):2707–2714. doi: 10.1097/01.brs.0000248132.15231.fe. [DOI] [PMC free article] [PubMed] [Google Scholar]
- 4.Yamashita K, Hayashi J, Ohzono K, Hiroshima K. Correlation of patient satisfaction with symptom severity and walking ability after surgical treatment for degenerative lumbar spinal stenosis. Spine (Phila Pa 1976) 2003;28(21):2477–2481. doi: 10.1097/01.BRS.0000090888.63860.4F. [DOI] [PubMed] [Google Scholar]
- 5.Hudak P L, Wright J G. The characteristics of patient satisfaction measures. Spine (Phila Pa 1976) 2000;25(24):3167–3177. doi: 10.1097/00007632-200012150-00012. [DOI] [PubMed] [Google Scholar]
- 6.Mannion A F, Junge A, Elfering A, Dvorak J, Porchet F, Grob D. Great expectations: really the novel predictor of outcome after spinal surgery? Spine (Phila Pa 1976) 2009;34(15):1590–1599. doi: 10.1097/BRS.0b013e31819fcd52. [DOI] [PubMed] [Google Scholar]
- 7.McGregor A H, Hughes S P. The evaluation of the surgical management of nerve root compression in patients with low back pain: Part 2: patient expectations and satisfaction. Spine (Phila Pa 1976) 2002;27(13):1471–1476, discussion 1476–1477. doi: 10.1097/00007632-200207010-00019. [DOI] [PubMed] [Google Scholar]
- 8.Haddad F S, Garbuz D S, Chambers G K, Jagpal T J, Masri B A, Duncan C P. The expectations of patients undergoing revision hip arthroplasty. J Arthroplasty. 2001;16(1):87–91. doi: 10.1054/arth.2001.17937. [DOI] [PubMed] [Google Scholar]
- 9.Lutz G K, Butzlaff M E, Atlas S J, Keller R B, Singer D E, Deyo R A. The relation between expectations and outcomes in surgery for sciatica. J Gen Intern Med. 1999;14(12):740–744. doi: 10.1046/j.1525-1497.1999.10417.x. [DOI] [PMC free article] [PubMed] [Google Scholar]
- 10.Gepstein R, Arinzon Z, Adunsky A, Folman Y. Decompression surgery for lumbar spinal stenosis in the elderly: preoperative expectations and postoperative satisfaction. Spinal Cord. 2006;44(7):427–431. doi: 10.1038/sj.sc.3101857. [DOI] [PubMed] [Google Scholar]
- 11.Iversen M D, Daltroy L H, Fossel A H, Katz J N. The prognostic importance of patient pre-operative expectations of surgery for lumbar spinal stenosis. Patient Educ Couns. 1998;34(2):169–178. doi: 10.1016/s0738-3991(97)00109-2. [DOI] [PubMed] [Google Scholar]
- 12.Yee A, Adjei N, Do J, Ford M, Finkelstein J. Do patient expectations of spinal surgery relate to functional outcome? Clin Orthop Relat Res. 2008;466(5):1154–1161. doi: 10.1007/s11999-008-0194-7. [DOI] [PMC free article] [PubMed] [Google Scholar]
- 13.de Groot K I, Boeke S, Passchier J. Preoperative expectations of pain and recovery in relation to postoperative disappointment in patients undergoing lumbar surgery. Med Care. 1999;37(2):149–156. doi: 10.1097/00005650-199902000-00005. [DOI] [PubMed] [Google Scholar]
- 14.Haanstra T M, van den Berg T, Ostelo R W. et al. Systematic review: do patient expectations influence treatment outcomes in total knee and total hip arthroplasty? Health Qual Life Outcomes. 2012;10:152. doi: 10.1186/1477-7525-10-152. [DOI] [PMC free article] [PubMed] [Google Scholar]
- 15.Hayden J A, Côté P, Bombardier C. Evaluation of the quality of prognosis studies in systematic reviews. Ann Intern Med. 2006;144(6):427–437. doi: 10.7326/0003-4819-144-6-200603210-00010. [DOI] [PubMed] [Google Scholar]
- 16.Law M, Stewart D, Pollock N, Hamilton, ON, Canada: McMaster University; 1998. Critical Review Form—Quantitative Studies. [Google Scholar]
- 17.Johansson A-C, Linton S J, Rosenblad A, Bergkvist L, Nilsson O. A prospective study of cognitive behavioural factors as predictors of pain, disability and quality of life one year after lumbar disc surgery. Disabil Rehabil. 2010;32(7):521–529. doi: 10.3109/09638280903177243. [DOI] [PubMed] [Google Scholar]
- 18.Licina P, Johnston M, Ewing L, Pearcy M. Patient expectations, outcomes and satisfaction: related, relevant or redundant? Evid Based Spine Care J. 2012;3(4):13–19. doi: 10.1055/s-0032-1328138. [DOI] [PMC free article] [PubMed] [Google Scholar]
- 19.Rönnberg K, Lind B, Zoëga B, Halldin K, Gellerstedt M, Brisby H. Patients' satisfaction with provided care/information and expectations on clinical outcome after lumbar disc herniation surgery. Spine (Phila Pa 1976) 2007;32(2):256–261. doi: 10.1097/01.brs.0000251876.98496.52. [DOI] [PubMed] [Google Scholar]
- 20.Toyone T, Tanaka T, Kato D, Kaneyama R, Otsuka M. Patients' expectations and satisfaction in lumbar spine surgery. Spine (Phila Pa 1976) 2005;30(23):2689–2694. doi: 10.1097/01.brs.0000187876.14304.15. [DOI] [PubMed] [Google Scholar]
- 21.Cobo Soriano J, Sendino Revuelta M, Fabregate Fuente M, Cimarra Díaz I, Martínez Ureña P, Deglané Meneses R. Predictors of outcome after decompressive lumbar surgery and instrumented posterolateral fusion. Eur Spine J. 2010;19(11):1841–1848. doi: 10.1007/s00586-010-1284-2. [DOI] [PMC free article] [PubMed] [Google Scholar]
- 22.McGregor A H, Doré C J, Morris T P. An exploration of patients' expectation of and satisfaction with surgical outcome. Eur Spine J. 2013;22(12):2836–2844. doi: 10.1007/s00586-013-2971-6. [DOI] [PMC free article] [PubMed] [Google Scholar]
- 23.Fairbank J C, Couper J, Davies J B, O'Brien J P. The Oswestry low back pain disability questionnaire. Physiotherapy. 1980;66(8):271–273. [PubMed] [Google Scholar]
- 24.Flórez M, García M, García F. et al. Adaptación transcultural a la población española de la escala de incapacidad por dolor lumbar de Oswestry. Rehabilitación. 1995;29:138–145. [Google Scholar]
- 25.Zywiel M G, Mahomed A, Gandhi R, Perruccio A V, Mahomed N N. Measuring expectations in orthopaedic surgery: a systematic review. Clin Orthop Relat Res. 2013;471(11):3446–3456. doi: 10.1007/s11999-013-3013-8. [DOI] [PMC free article] [PubMed] [Google Scholar]