

Abstract
Background
Understanding HCV disease progression rates among people who inject drugs (PWID) is important to setting policy to expand access to detection, diagnosis and treatment, and in forecasting the burden of disease. In this paper we synthesize existing data on the natural history of HCV among PWID, including fibrosis progression rates (FPR) and the incidence of compensated cirrhosis (CC), decompensated cirrhosis (DC), and hepatocellular carcinoma (HCC).
Methods
We conducted electronic and manual searches for published and unpublished literature. Reports were eligible if they (i) included participants who were chronically infected with HCV and reported current or previous injection drug use; (ii) presented original data on disease progression in a study sample comprised of at least 90% PWID; (iii) published between January 1, 1990, and December 31, 2013; and (iv) included data from upper-middle- or high-income countries. Quality ratings were assigned using an adaptation of the Quality In Prognosis Studies (QUIPS) tool. We estimated pooled FPRs using the stage-constant and stage-specific methods, and pooled incidence rates of CC, DC, and HCC.
Results
Twenty-one reports met the study inclusion criteria. Based on random-effect models, the pooled stage-constant FPR was 0.117 METAVIR units per year (95% CI, 0.099 −0.135), and the stage-specific FPRs were F0→F1, 0.128 (95% CI 0.080, 0.176); F1→F2, 0.059 (95% CI 0.035, 0.082); F2→F3, 0.078 (95% CI 0.056, 0.100); and F3→F4, 0.116 (95% CI 0.070, 0.161). The pooled incidence rates of CC, DC, and HCC were 6.6 (95% CI 4.8, 8.4), 1.8 (95% CI 0.3, 3.3), and 0.3 (95% CI −0.1, 0.6) events per 1,000 person-years, respectively. Following the stage-constant estimate, average time to cirrhosis is 34 years post-infection, and time to METAVIR stage F3 is 26 years; using the stage-specific estimates, time to cirrhosis is 46 years and time to F3 is 38 years.
Conclusion
Left untreated, PWID with chronic HCV infection will develop liver sequelae (including HCC) in mid- to late-adulthood. Delaying treatment with the new drug regimens until advanced fibrosis develops prolongs the period of infectiousness to perhaps thirty years. Scaling up of effective HCV prevention and early engagement in care and treatment will facilitate the elimination HCV as a source of serious disease in PWID.
Keywords: hepatitis C, people who inject drugs, natural history, liver fibrosis, cirrhosis
INTRODUCTION
Hepatitis C virus (HCV) infection is a chronic blood-borne viral infection that is of global importance (Nelson, Mathers, Cowie, Hagan, Des Jarlais, Horyniak, & Degenhardt, 2011; Averhoff, Glass, & Holtzman, 2012). Approximately 160 million people, or 2–3% of the world’s population, have chronic HCV; chronic HCV accounts for one-quarter of cases of cirrhosis and hepatocellular carcinoma (HCC) (Lavanchy, 2011; Nelson et al., 2011; Averhoff et al., 2012; World Health Organization, 2014). The vast majority of incident and prevalent HCV infections in the world are related to unsafe medical and illicit drug injections (Colvin & Mitchell, 2010). In most high-income countries, the primary route of HCV transmission is due to drug injection. HCV is concentrated in people who inject drugs (PWID) in these countries (Aceijas & Rhodes, 2007; Nelson et al., 2011), and approximately 50–80% of PWID are chronically infected (Nelson et al., 2011; Wiessing, Ferri, Grady, Kantzanou, Sperle, Cullen, EMCDDA DRID group, Hatzakis, Prins, Vickerman, Lazarus, Hope, & Matheï, 2014).
Viral and host factors hinder the detection, diagnosis and treatment of HCV in PWID (Hagan 2011). Acute infection is typically asymptomatic and chronically infected individuals may not develop significant sequelae for decades after initial infection (Grebely, Prins, Hellard, Cox, Osburn, Lauer, Page, Lloyd, & Dore, 2012). If left untreated, chronic liver disease will occur in 60–70%, cirrhosis in 5v20%, and 1–5% will die from decompensated cirrhosis or HCC (Rein, Wittenborn, Weinbaum, Sabin, Smith, & Lesesne, 2011). It has been estimated that fewer than 5% of PWID have received treatment for chronic HCV (Adeyemi, Jensen, Attar, Ghaoui, Gallagher, Wolen, & Cotler, 2004; Grebely, Raffa, Lai, Krajden, Kerr, Fischer, & Tyndall, 2009).
New HCV treatments feature shorter drug regimens with manageable side effects, and are highly likely to result in cure (Kohli, Shaffer, Sherman, & Kottilil 2014). However these options are expensive and treatment eligibility guidelines may explicitly exclude active drug users (Harris & Rhodes, 2013; Robaeys, Grebely, Mauss, Bruggmann, Moussalli, De Gottardi, Swan, Arain, Kautz, Stöver, Wedemeyer, Schaefer, Taylor, Backmund, Dalgard, Prins, & Dore, 2013; Fralick, 2014; World Health Organization, 2014). Many US states’ public insurance programs (e.g., Medicaid) have restricted coverage of these new treatments to those with more advanced disease, i.e., METAVIR fibrosis stages 3 or 4, which may delay treatment for years; this restriction will disproportionately affect PWID and other low-income patients (Viohl & Associates, 2014). These restrictions also are in conflict with new HCV treatment guidelines from the American Association for the Study of Liver Disease (2015), which state explicitly that active injection drug users should be prioritized for treatment in part because of the risk of transmission to susceptible injection partners.
Understanding HCV disease progression rates among PWID is important to setting policy to expand access to detection, diagnosis and treatment, and in forecasting the burden of disease. In this paper we synthesize existing data on the natural history of HCV among PWID, including fibrosis progression rates and the incidence of compensated cirrhosis (CC), decompensated cirrhosis (DC), and HCC. Prior systematic reviews of HCV disease progression in PWID did not explicitly exclude studies of HIV-HCV co-infected patients. Because the majority of PWID with HCV are mono-infected, it is important to characterize this group separately. Estimates from the analysis will be used to inform simulations of the impact and cost-effectiveness of HCV management among PWID. This systematic review and meta-analysis and related simulations are conducted as part of the HCV Synthesis Project (see Hagan, Neurer, Jordan, Des Jarlais, Wu, Dombrowski, Khan, Braithwaite, and Kessler, 2014; Jordan, Des Jarlais, and Hagan, 2014), which is funded to develop guidance and recommendations for HCV control strategies for the US.
METHODS
Search strategy
A combination of manual and electronic searches for published literature, including scientific conference websites and abstract books, were conducted within the databases of Ovid, Proquest, PubMed, and Web of Science. Variations of the search string consisted of keywords such as “HCV,” “hepatitis C,” “PWID,” “injection drug use,” “intravenous drug use,” “natural history,” “disease progression,” “survival,” “fibrosis,” “cirrhosis,” “hepatocellular carcinoma,” and “end stage liver disease.” The search filters applied included publication date, peer-reviewed journal, and human studies. Manual searches of the reference lists of eligible reports, pertinent reviews, and methodological papers also were conducted for additional literature. The conduct and reporting of this project was guided by the Preferred Reporting Items for Systematic Reviews and Meta-Analyses (PRISMA) (Moher, Liberati, Tetzlaff, & Altman, 2009); the protocol was registered with PROSPERO (CRD42014008805).
Inclusion and exclusion criteria
Reports were eligible for inclusion if they met the following criteria: (i) included participants who were chronically infected with HCV and reported current or previous injection drug use (hereafter referred to as PWID); (ii) presented original data on disease progression in a study sample comprised of at least 90% PWID; (iii) published between January 1, 1990, and December 31, 2013; and (iv) included data from upper-middle- or high-income countries. (The restriction in (iv) was placed under the assumption that disease progression may be influenced by country-level factors including access to health services, which vary in relation to national income (Peters, Garg, Bloom, Walker, Brieger, & Hafizur Rahman, 2008).) Reports were excluded if more than 50% of participants were co-infected with HIV or HBV, or were receiving or previously had received HCV treatment or liver transplantation. (Four reports included HIV+ PWID (range 2.2%, 33.4%).
Exposure measure
The exposure of interest was chronic HCV infection, defined as HCV RNA positivity or based on a statement in the report that all participants were chronically infected (Hoofnagle, 2002; Chen & Morgan, 2006).
Outcome measures
Outcomes included the fibrosis progression rate (FPR) and the incidence and prevalence of CC, DC, and HCC. The preferred criterion for measuring fibrosis and cirrhosis was a liver biopsy in which the sample was staged according to the METAVIR, Ishak, Knodell, or Scheuer scoring systems. In addition to staging based on liver biopsy, diagnostic evidence from clinical examination (e.g., coagulation tests) or ultrasonographic evaluation served as alternative criteria for measuring CC. In the included reports, DC was determined based on the clinical presentation of symptoms, e.g., esophageal varices, ascites, hepatic encephalopathy, jaundice, and esophageal varices. (Reports did not always specify whether or not variceal bleeding was used to diagnosis DC). CC was detected through computed tomography, ultrasonography, liver biopsy, or, in one study, alpha-fetoprotein testing and radiography. We excluded reports in which noninvasive procedures were used to stage fibrosis (e.g., FibroSURE and FibroScan). A limitation of noninvasive methods is their difficulty to differentiate between intermediate METAVIR stages, which generates discordance with liver biopsy in staging results (de Lucca Schiavon, Narciso-Schiavon, & de Carvalho-Filho, 2014; Fallatah, 2014). The exclusion of data acquired from noninvasive procedures minimized bias due to measurement error.
Screening and data collection
Two research assistants (RAs) independently screened abstracts and extracted data. In the event that consensus between the RAs was not reached on the eligibility of a report, the project director and principal investigator were consulted for a final decision. From all included reports we collected data on the following domains: citation information; study cohort, period, and location; study design; sampling, recruitment, testing, and statistical methodology; incidence or prevalence of fibrosis, CC, DC, and HCC; rates of fibrosis progression; disease duration; and participant characteristics, particularly factors understood to be associated with accelerated liver disease progression (e.g., age, sex, alcohol consumption). In the case of missing or inconsistent data in a report, the corresponding author was contacted for additional information or clarification. Of seven authors contacted, two fulfilled our data request (29%).
Report quality
All reports included in the systematic review were assigned quality ratings using an adapted version of the Quality In Prognosis Studies (QUIPS) tool for the assessment of bias in studies of prognostic factors (Hayden, Côté, & Bombardier, 2006; Hayden, van der Windt, Cartwright, Côté, & Bombardier, 2013). (The complete adapted instrument is available by request.) Each report was given an overall rating (and an associated numeric grade) of high (2), moderate (1), or low (0), which summarized the degree to which the design and analysis of the study controlled selection bias, misclassification, and confounding.
Data Analysis
Time to event
For every report, time to event was recorded in person-years (PYs). In cases where total PYs were not provided, aggregate PYs were approximated by cumulative disease duration or time between biopsies, which were estimated by the product of the sample size and the sample mean of the duration of infection or interval separating paired biopsies.
Fibrosis progression
We estimated the progression of fibrosis using two methods: i) the stage-constant method, wherein the rate of progression is assumed to be linear, and therefore constant, across person-time, and ii) the stage-specific method, in which fibrosis progression is presumed to be nonlinear and thus advances unevenly over person-time. All fibrosis staging data were standardized by converting the original fibrosis scores graded by the Ishak, Knodell, or Scheuer system to METAVIR units (F0-F4) (Thein, Yi, Dore, & Krahn, 2008).
Linear estimation
An annual stage-constant FPR, which refers to a uniform rate of progression from METAVIR stage F0→F1, was estimated for any report that did not directly report it but provided relevant data for its computation. The FPR was approximated using one of three methods depending on the amount of data included in the report. In general, a modified version of the indirect or direct method for estimating a stage-constant FPR, appropriate for single-biopsy or serial-biopsy data (Yi, Wang, & Krahn, 2004; Thein et al. 2008), respectively, was applied when the report provided the distribution of fibrosis stages.
1. Standard direct method: The FPR was the average of each participant’s progression rate, which was calculated by dividing the difference in a participant’s METAVIR scores between two biopsies by the time interval separating the biopsies.
2. Modified direct method: The estimated FPR was the quotient of the difference in cumulative METAVIR units between paired biopsies divided by the time elapsed between the biopsies.
3. Modified indirect method: The FPR was derived from the ratio of cumulative METAVIR units to total disease duration of the participants biopsied.
Nonlinear estimation
We also estimated annual stage-specific FPRs, which describe fibrosis progression as a function of METAVIR staging-that is, the rate at which an individual transitions from one given METAVIR stage to the next. For each report that provided the fibrosis staging distribution and person-time of the sample, four METAVIR-stage-specific transition rates were estimated: F0→F1, F1 →F2, F2→F3, and F3→F4. The stage-specific FPRs were generated using the Markov maximum likelihood (MML) estimation method (Yi et al., 2004; Sweeting, De Angelis, Neal, Ramsay, Irving, Wright, Brant, Harris, Trent HCV Study Group, & HCV National Register Steering Group, 2006; Thein et al., 2008; Bochud, Cai, Overbeck, Bochud, Dufour, Müllhaupt, Borovicka, Heim, Moradpour, Cerny, Malinverni, Francioli, & Negro, 2009).
Incidence of hepatic sequelae
Separate incidence rates of CC, DC, and HCC were estimated as the ratio of the event count for an outcome to the cumulative PYs of the subgroup under examination. When necessary, total PYs were estimated as described in the preceding section. All estimates of incidence were expressed as events per 1,000 PYs.
Meta-analysis
Pooled estimates were generated from both fixed-effect and random-effects metaanalysis models. Heterogeneity was assessed using both Cochran’s Q and I2 (Higgins, Thompson, Deeks, & Altman, 2003) measures. Random-effects meta-regression of fibrosis progression and incidence of CC were performed. Statistical analysis was conducted using Stata 13.1 (StataCorp, 2013) and SAS 9.3 (SAS Institute Inc., 2012).
RESULTS
Overview of included reports
As presented in figure 1, twenty-one unique reports were included in this review. Tables 1–2 present the pooled estimates and characteristics of the included reports for each of the four main outcomes of interest: FPR (10 reports), CC (15 reports), DC (4 reports), and HCC (5 reports). The geographic scope of the data focused largely on Europe where 11 reports (52%) originated; a smaller percentage represented data from the United States (5; 24%) and Australia (5; 24%). A total of 8,502 unique PWID contributing 119,797.6 person-years (PYs) of observation for the study of four major HCV-related outcomes were included in this review. Among the 8,495 PWID for which data on duration of infection was available, the estimated mean disease duration was 14.3 years (median 14.0; range 5.6, 26.0; 20 reports); in 7,177 PWID, the estimated age of infection was 21.2 years (median 21.2; range 15.8, 26.4; 17 reports).
Figure 1.
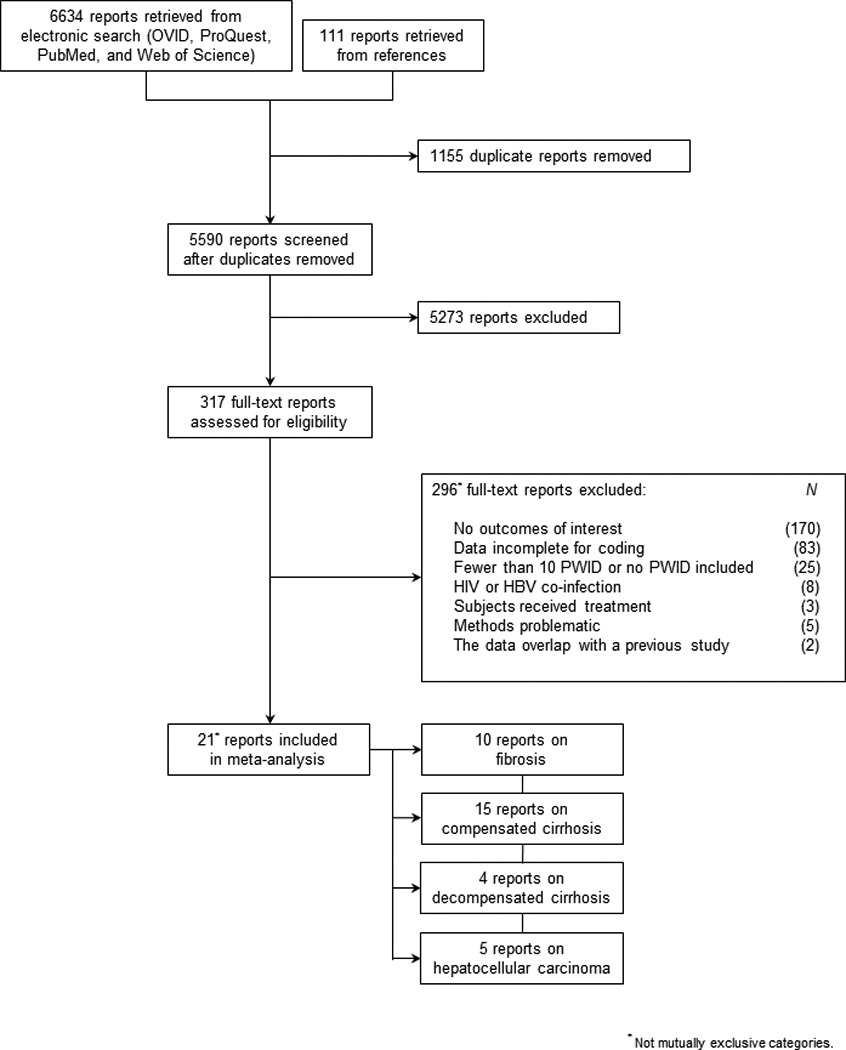
PRISMA diagram of literature search and eligibility assessment.
Table 1.
Reports investigating the incidence, prevalence, or progression of fibrosis.
|
Single-Biopsy Method | |||||||||||
|---|---|---|---|---|---|---|---|---|---|---|---|
| Study characteristics |
Progression rate (METAVIR units/year) |
||||||||||
| First author (pub. yr.) | Study period | Location | Time-to-event origin | Recruitment method | Recruitment site | Quality rating | N | Cumulative METAVIR units |
Total person-years |
Reported mean | Calculated mean |
| Benhamou (1999) | 1995–1998 | France | Date of first injection | Other systematic | Hospital (liver unit) | 2 | 122 | 198 | 1647 | 0.135 | — |
| Hallinan (2006) | 2002–2005 | Australia | Date of first injection or last Ab- |
Consecutive sampling | Drug treatment center | 2 | 22 | 62 | 440 | — | 0.141 |
| Harder (2004) | 1997–1998 | Germany | Estimated date of infection not reported |
Consecutive sampling | Drug treatment center | 0 | 47 | 48 | 263 | — | 0.182 |
| Kielland (2014) | 1970–2008 | Norway | Date of two years | Consecutive sampling | Drug treatment center | 2 | 61 | 83 | 1079 | 0.097 | |
| Larsen (2010) | 2001–2007 | France | Date of first injection or last Ab- |
Consecutive sampling | Hospital (liver unit) | 2 | 1725 | 2988 | 31050 | — | 0.096 |
| Ostapowicz (1999) | No dates given | Australia | Date of first injection | Unspecified | Hospital (liver unit) | 2 | 130 | 205 | 1898 | — | 0.108 |
| Romeo (2000) | 1991–1992 | Italy | Estimated date of infection not reported |
Consecutive sampling | Hospital (liver unit) | 0 | 71 | 85 | 556 | — | 0.153 |
| Wali (1999) | 1989–1997 | United Kingdom | Date of first injection | Consecutive sampling | Hospital (liver unit) | 2 | 64 | 64 | 896 | 0.070 | — |
|
Serial-Biopsy Method | |||||||||||
|
Study characteristics |
Progression rate (METAVIR units/year) |
||||||||||
|
First author (publication year) |
Study period | Location | Time-to-event origin | Recruitment method | Recruitment site | Quality rating | N |
Cumulative METAVIR units |
Total person-years |
Reported mean | Calculated mean |
| Wilson (2006) | 1996–2003 | United States | Date of first biospy | Convenience sampling | Community-based organization | 2 | 119 | 40 | 500 | — | 0.080 |
| Yeh (2005) | 1972–1975 | United States | Date of first biospy | Unspecified | Hospital (multiple units) | 0 | 7 | 2 | 14 | — | 0.232 |
|
Pooled fixed-effect stage-constant FPR (10 studies): 0.101 METAVIR units per year (95% CI 0.098, 0.104). Pooled random-effects stage-constant FPR (10 studies): 0.117 METAVIR units per year (95% CI 0.099, 0.135). Heterogeneity: Q = 105.95, p = 0.000; I2 = 91.5%. | |||||||||||
Table 2.
Reports investigating the incidence or prevalence of compensated cirrhosis (CC), decompensated cirrhosis (DC), or hepatocellular carcinoma (HCC).
|
N |
||||||||||||
|---|---|---|---|---|---|---|---|---|---|---|---|---|
| Outcome | First author (pub. yr.) | Study period | Study location | Study design | Time-to-event origin | Recruitment method | Recruitment site | Quality rating | Subjects | Events | Total person-years |
Incidence rate per 1000 person-years |
| CC | ||||||||||||
| DiMartino (2001) | 1980–1997 | France | Cohort | Date of first injection | Other systematic | Hospital (unspecified unit) | 1 | 80 | 3 | 816 | 3.7 | |
| Gordon (1998) | 1989–1997 | United States | Cohort | Date of first injection | Unspecified | Hospital (unspecified unit) | 2 | 195 | 40 | 3705 | 10.8 | |
| Hallinan (2006) | 2002–2005 | Australia | Cohort | Date of first injection or last Ab- |
Consecutive sampling | Drug treatment center | 2 | 22 | 7 | 440 | 15.9 | |
| Khan (1998) | 1982–1994 | Australia | Cross-sectional | Date of first injection | Consecutive sampling | Hospital (liver unit) | 2 | 196 | 18 | 2352 | 7.7 | |
| Kielland (2014) | 1970–2008 | Norway | Cohort | Date of two years post-first injection |
Consecutive sampling | Drug treatment center | 2 | 61 | 7 | 1079 | 6.5 | |
| Larsen (2010) | 2001–2007 | France | Cross-sectional | Date of first injection or last Ab- |
Consecutive sampling | Hospital (liver unit) | 2 | 1725 | 177 | 31050 | 5.7 | |
| McGuinness (1996) | No dates given | Australia | Cross-sectional | Estimated date of infection not reported |
Unspecified | Unspecified | 0 | 19 | 5 | 267 | 18.7 | |
| Ostapowicz (1999) | No dates given | Australia | Cross-sectional | Date of first injection | Unspecified | Hospital (liver unit) | 2 | 346 | 41 | 5052 | 8.1 | |
| Pol (1998) | No dates given | France | Cross-sectional | Date of first injection | Consecutive sampling | Hospital (unspecified unit) | 1 | 150 | 23 | 1770 | 13.0 | |
| Poynard (2001) | 1993–1998 | France | Cross-sectional | Date of first injection | Unspecified | Hospital (unspecified unit) | 1 | 355 | 18 | 7100 | 2.5 | |
| Romeo (2000) | 1991–1992 | Italy | Cross-sectional | Estimated date of infection not reported |
Consecutive sampling | Hospital (liver unit) | 0 | 71 | 2 | 556 | 3.6 | |
| Roudot-Thoraval (1997) | 1991–1993 | France | Cross-sectional | Estimated date of infection not reported |
Other systematic | Hospital (unspecified unit) | 1 | 889 | 52 | 7112 | 7.3 | |
| Serfaty (2001) | 1996–1996 | France | Cross-sectional | Date of first injection | Other systematic | Hospital (multiple units) | 2 | 38 | 1 | 532 | 1.9 | |
| Tong (1996) | 1981–1994 | United States | Cohort | Date of first injection | Convenience sampling | Hospital (liver unit) | 1 | 74 | 25 | 1332 | 18.8 | |
| Wilson (2006) | 1996–2003 | United States | Cohort | Date of first injection | Convenience sampling | Community-based organization | 2 | 119 | 5 | 3094 | 1.6 | |
|
Pooled fixed-effect incidence rate of CC (15 studies): 4.9 events per 1,000 person-years (95% CI 4.4, 5.4). Pooled random-effects incidence rate of CC (15 studies): 6.6 events per 1,000 person-years (95% CI 4.8, 8.4). Heterogeneity: Q = 98.41, p = 0.000; I2 = 85.8%. |
||||||||||||
| DC | ||||||||||||
| Khan (2000) | 1982–1996 | Australia | Cohort | Date of first injection | Consecutive sampling | Hospital (liver unit) | 2 | 198 | 2 | 2376 | 0.8 | |
| McGuinness (1996) | No dates given | Australia | Cross-sectional | Estimated date of infection not reported |
Unspecified | Unspecified | 1 | 19 | 2 | 267 | 7.5 | |
| Thomas (2000) | 1988–1997 | United States | Cohort | Date of first injection | Convenience sampling | Community-based organization | 2 | 1667 | 40 | 12737 | 3.1 | |
| Wilson (2006) | 1996–2003 | United States | Cohort | Date of first injection | Convenience sampling | Community-based organization | 2 | 119 | 3 | 3094 | 1.0 | |
|
Pooled fixed-effect incidence rate of DC (4 studies): 1.8 events per 1,000 person-years (95% CI 1.2, 2.4). Pooled random-effects incidence rate of DC (4 studies): 1.8 events per 1,000 person-years (95% CI 0.3, 3.3). Heterogeneity: Q = 13.23, p= 0.004; I2 = 77.3%. |
||||||||||||
| HCC | ||||||||||||
| Gordon (1998) | 1989–1997 | United States | Cohort | Date of first injection | Unspecified | Hospital (unspecified unit) | 2 | 195 | 2 | 3705 | 0.5 | |
| Khan (2000) | 1982–1996 | Australia | Cohort | Date of first injection | Consecutive sampling | Hospital (liver unit) | 2 | 198 | 1 | 2376 | 0.4 | |
| Kielland (2014) | 1970–2008 | Norway | Cohort | Date of two years post-first injection |
Consecutive sampling | Drug treatment center | 2 | 61 | 1 | 1079 | 0.9 | |
| Larsen (2010) | 2001–2007 | France | Cross-sectional | Date of first injection or last Ab- |
Consecutive sampling | Hospital (liver unit) | 2 | 3978 | 8 | 71604 | 0.1 | |
| Tong (1996) | 1981–1994 | United States | Cohort | Date of first injection | Convenience sampling | Hospital (liver unit) | 1 | 74 | 3 | 1332 | 2.3 | |
|
Pooled fixed-effect incidence rate of HCC (5 studies): 0.1 events per 1,000 person-years (95% CI 0.0, 0.2). Pooled random-effects incidence rate of HCC (5 studies): 0.3 events per 1,000 person-years (95% CI −0.1, 0.6). Heterogeneity: Q = 5.21, p = 0.267; I2 = 23.2%. |
||||||||||||
Across the included reports, very few participant characteristics were consistently measured and presented. Sex and age were described most frequently; 19 reports (90%) summarized the sex distribution, and 14 reports (67%) provided a mean or median estimate of age at enrollment. Despite its critical role in the progression of liver disease, alcohol consumption among participants was given in only 13 reports (62%), measurement of alcohol use varied widely, and few reports specifically assessed problem or excess drinking.
Pooled estimates
In the supporting tables (1–5), both fixed-effect and random-effects meta-analysis results are presented. We discuss below only the random-effects estimates.
Table 5.
Random-effects meta-regression results.
| Stage-constant FPR |
Stage-specific FPR |
CC incidence rate (per 1,000 PYs) |
||||||||||||||||
|---|---|---|---|---|---|---|---|---|---|---|---|---|---|---|---|---|---|---|
| Factor | F0→F4 | F0→F1 | F1→F2 | F2→F3 | F3→F4 | |||||||||||||
| β | SE | p | β | SE | p | β | SE | p | β | SE | p | β | SE | P | β | SE | p | |
| Age at infection | 0.011 | 0.006 | 0.111 | −0.012 | 0.024 | 0.704 | 0.017 | 0.028 | 0.654 | −0.038 | 0.085 | 0.733 | −0.182 | 0.192 | 0.517 | 1.487 | 1.526 | 0.362 |
| Duration of infection | −0.003 | 0.002 | 0.114 | −0.007 | 0.006 | 0.437 | 0.002 | 0.008 | 0.808 | −0.021 | 0.020 | 0.485 | −0.055 | 0.044 | 0.430 | 0.213 | 0.577 | 0.723 |
| Males (%) | 0.128 | 0.079 | 0.154 | −0.398 | 0.321 | 0.432 | 0.626 | −0.407 | 0.367 | 0.172 | 1.170 | 0.907 | −3.310 | 2.356 | 0.394 | −4.003 | 23.012 | 0.867 |
| Recruitment location | ||||||||||||||||||
| non-clinical setting | (ref. cat.) | (ref. cat.) | (ref. cat.) | (ref. cat.) | (ref. cat.) | (ref. cat.) | ||||||||||||
| Clinical setting | −0.022 | 0.014 | 0.161 | 0.059 | 0.060 | 0.504 | −0.004 | 0.059 | 0.959 | 0.056 | 0.330 | 0.894 | 0.280 | 0.490 | 0.670 | −2.678 | 4.901 | 0.602 |
| Constant | −0.140 | 0.150 | 0.386 | 0.755 | 0.763 | 0.503 | −0.787 | 0.894 | 0.541 | 1.053 | 2.438 | 0.741 | 7.157 | 6.077 | 0.448 | −21.622 | 46.591 | 0.657 |
| No. of reports | 11 | 6 | 6 | 6 | 6 | 12 | ||||||||||||
Fibrosis progression rate
A total of 2,607 participants representing 41,119 PYs and 3,775 cumulative METAVIR units contributed to the study of FPR in 10 reports. Among 2,361 PWID in 9 of the remaining 10 reports, the estimated mean duration of infection was 15.2 years (median 14.6; range 5.6, 26.0) and the estimated mean age of infection was 20.7 years (median 21.0; range 15.8, 23.0).
Linear estimation
In the 10 reports, the pooled stage-constant estimate of fibrosis progression (F0→F4), described in table 1, was 0.117 units per year (range 0.070, 0.232). Using this estimate, time to CC was 34 years for an individual with chronic HCV.
Nonlinear estimation
MML estimation was performed for 6 of the 10 reports containing sufficient data on the fibrosis staging distribution and person-time of the sample. Table 3 presents the pooled stage-specific transition rates among this subset; the FPRs were the following: F0→F1, 0.128 (CI 0.080, 0.176); F1→F2, 0.059 (CI 0.035, 0.082); F2→F3, 0.078 (CI 0.056, 0.100); and F3→F4, 0.116 (CI 0.070, 0.161). Based on this progression sequence, time to CC was 46 years.
Table 3.
Pooled stage-specific transition rates.
| METAVIR stage transition | Fixed-effect model |
Random-effects model |
Heterogeneity |
||||
|---|---|---|---|---|---|---|---|
| Estimate | 95% CI | Estimate | 95% CI | Q | p | I2 | |
| F0→F1 | 0.113 | 0.102 – 0.124 | 0.128 | 0.080 – 0.176 | 57.11 | 0.000 | 91.2 |
| F1→F2 | 0.058 | 0.051 – 0.065 | 0.059 | 0.035 – 0.082 | 24.90 | 0.000 | 79.9 |
| F2→F3 | 0.079 | 0.064 – 0.093 | 0.078 | 0.056 – 0.100 | 5.76 | 0.331 | 13.2 |
| F3→F4 | 0.120 | 0.085 – 0.155 | 0.116 | 0.070 – 0.161 | 5.48 | 0.360 | 8.7 |
Cirrhosis
In aggregate, 4,340 participants contributing 63,662 PYs were examined in the 15 reports characterizing CC. Among these participants the estimated mean disease duration was 15.4 years (median 14.6; range 7.8, 26.0); from 12 reports examining 3,022 PWID, the estimated mean age of infection was 20.5 years (median 21.0; range 15.8, 22.0). The pooled incidence rate was 6.6 events per 1,000 PYs (CI 4.8, 8.4).
Decompensated cirrhosis
Within the four reports investigating DC, there were 2,003 participants who provided 15,880 PYs of observation. The estimated mean duration of infection was 14.9 years (median 13.0; range 7.6, 26.0; 4 reports), and the estimated mean age of infection was 21.4 years (median 21.7; range 15.8, 26.4; 4 reports). The pooled incidence was 1.8 events per 1,000 PYs (range 0.3, 3.3).
Hepatocellular carcinoma
HCC was examined in five reports representing 80,096 PYs and 4,506 participants. In these reports, the estimated mean disease duration was 16.9 years (median 18.0; range 12.0, 19.0); from the four reports that assessed 4,432 PWID, the estimated mean age of infection was 20.4 years (median 20.3; range 19.0, 22.0). Most of these reports presented data from cohorts prior to 2001. The pooled incidence rate was 0.3 events per 1,000 PYs (range −0.1, 0.6).
Quality ratings
Mean quality scores, ranging from 0 (low) to 2 (high), by outcome for the reports on FPR, CC, DC, and HCC were 1.5, 1.3, 1.8, and 1.8, respectively. Using random-effects modeling, we conducted subgroup analysis of the quality ratings for the reports examining fibrosis progression; reports were stratified by quality score and pooled stage-constant estimates were calculated. Referring to table 4, the results suggest a negative correlation between report quality and fibrosis progression—that is, in higher quality reports, the FPR is slower (low 0.164, n studies = 3; moderate N/A, n = 0; high 0.107, n = 7). The variance across the pooled estimates translates to a range for time to cirrhosis of 24–37 years.
Table 4.
Comparison of pooled random-effects FPRs and time-to-CC by quality rating and recruitment from a liver speciality clinic.
| Factor | Stage constant |
Stage-specific |
||||||||||||
|---|---|---|---|---|---|---|---|---|---|---|---|---|---|---|
| F0→F4 |
F0→F1 |
F1→F2 |
F2→F3 |
F3→F4 |
||||||||||
| N reports | Estimate | 95% CI | Years to CC | N reports | Estimate | 95% CI | Estimate | 95% CI | Estimate | 95% CI | Estimate | 95% CI | Years to CC | |
| Quality rating | ||||||||||||||
| Low | 3 | 0.164 | 0.136 – 0.191 | 24 | 1 | 0.139 | 0.67 – 0.210 | 0.160 | 0.032 – 0.287 | 0.322 | −0.066–- 0.710 | 0.070 | −0.105 – 0.246 | 34 |
| Moderate | 0 | — | — | — | 0 | — | — | — | — | — | — | — | — | — |
| High | 7 | 0.107 | 0.089 – 0.126 | 37 | 5 | 0.126 | 0.073 – 0.180 | 0.055 | 0.032 – 0.078 | 0.078 | 0.060 – 0.095 | 0.118 | 0.057 – 0.178 | 44 |
|
Recruited exclusively from a liver specialty clinic |
||||||||||||||
| Yes | 5 | 0.112 | 0.090 – 0.135 | 36 | 4 | 0.143 | 0.129 – 0.157 | 0.064 | 0.043 – 0.086 | 0.083 | 0.064 – 0.103 | 0.133 | 0.094 – 0.172 | 42 |
| No | 5 | 0.125 | 0.089 – 0.162 | 32 | 2 | 0.081 | 0.011 – 0.151 | 0.046 | −0.009 – 0.101 | 0.052 | 0.010 – 0.093 | 0.065 | −0.015 – 0.144 | 69 |
Of the study design issues accounted for in the quality ratings instrument, we were particularly interested in selection bias, defined for our purposes as the likelihood that observed disease progression was related to the setting or method for recruiting participants. The overall rating for selection bias was 1.4. This mean score corresponds to the lower rating applied to reports that sampled from liver or unidentified units in hospitals, wherein the population is believed to be composed disproportionately of individuals with more severe hepatic conditions.
Table 4 presents additional analysis of report-level data and fibrosis progression. The pooled stage-constant FPR was 0.112 for those reports in which recruitment exclusively occurred in liver clinics (n = 5) compared to 0.125 for reports that recruited across multiple clinics or non-clinical settings (n = 5); the difference in time to CC was approximately 4 years (36 v. 32 years). In comparing the chain of stage-specific rates in table 4, CC occurs at 42 years post-infection among samples exclusively drawn from liver clinics (n = 4) and at 69 years for samples recruited in all other settings (n = 2).
Heterogeneity
Tests for heterogeneity, detailed in tables 1–3, revealed significant variability across the reports contributing to each outcome. Among the meta-analysis estimates affected by heterogeneity, the Q-statistic was associated with a p-value less than 0.05, and the I2 values suggested moderate to high inconsistency. However, there was no evidence to suggest the influence of heterogeneity in the estimation of three outcomes: the stage-specific progression from F2→F3 and F3→F4, and the incidence of HCC. The p-values for all Q-statistics were greater than 0.10, and I2 values were below 23%.
Meta-regression
We performed a random-effects meta-regression to examine the influence of report and participant characteristics on fibrosis progression and incidence of CC. Both stage-constant and stage-specific rates were used as dependent variables. In a univariate regression, quality rating (coeff. −0.029; 95% CI −0.055, −0.004; p = 0.026) was associated with a slower stage-constant FPR. However, there was no evidence of an effect of quality rating on stage-specific fibrosis progression or incidence of CC. (Results are not shown.) The results of a multivariate analysis are presented in table 5. Across all three outcome variables, there was no evidence to suggest the influence of age at infection, duration of infection, male sex, or recruitment from clinical settings.
DISCUSSION
This systematic review synthesized the available data on the progression of fibrosis and the incidence of severe hepatic sequelae in PWID with chronic HCV infection. Random-effects estimation generated a stage-constant FPR of 0.117 and stage-specific FPRs of 0.128 (F0→F1), 0.059 (F1→F2), 0.078 (F2→F3), and 0.116 (F3→F4). The stage-constant rate (0.117) is within the range (and near the midpoint) of other stage-constant estimates from samples of HIV-negative patients with HCV infection due to other exposures (range 0.07, 0.151) (Mathurin, Moussall, Cadranel, Thibault, Charlotte, Dumouchel, Cazier, Huraux, Devergie, Vidaud, Opolon, & Poynard, 1998; Bonacini, Groshen, Yu, Govindarajan, & Lindsay, 2001; Mohsen, Easterbrook, Taylor, Portmann, Kulasegaram, Murad, Wiselka, & Norris, 2003; Rodríguez-Torres, Ríos-Bedoya, Rodríguez-Orengo, Fernández-Carbia, Marxuach-Cuétara, López-Torres, Salgado-Mercado, & Bräu, 2006; Souza, Tovo, Mattos, & Chaves, 2008; Bochud et al., 2009).
Likewise, based on a progression rate of 0.117, the estimated time to cirrhosis of 34 years is near the midpoint of the time-to-event range (22, 57) in the other patient groups. Although there is wide variance in the estimates of fibrosis progression and the associated times to event, the stage-constant rate of the present meta-analysis lies near the centers of the distributions.
Similarly, the stage-specific rates we derived-0.128 (F0→F1), 0.059 (F1→F2), 0.078 (F2→F3), and 0.116 (F3→F4)-are consistent with the rates of Thein et al. (2008), who also examined fibrosis progression among PWID: 0.116 (F0→F1), 0.085 (F1→F2), 0.085 (F2→F3), and 0.130 (F3→F4). With the exception of the transition from F1→F2, our estimates deviate slightly from Thein et al.; this is demonstrated in the comparison of between-stage duration and overall time to CC. We estimate the occurrence of compensated cirrhosis at 46 years post-infection, and Thein et al. provide an estimate of 40 years. One explanation for the difference in rates is the moderation effect of HIV co-infection, which was prevalent in higher proportions in the PWID samples of Thein et al.
Limitations
There are several limitations to our study. Our inclusion criteria restricted the size of the dataset and limited generalizability to upper-middle and high-income countries. Also, the study-level estimates for the included reports were calculated using estimators that rely on cohort-level data rather than participant-level data, which was generally unavailable. Furthermore, our linear FPR was based on the assumption of stage-constant disease progression, and recent literature suggests that the course of disease may actually vary across fibrosis stages (Yi et al., 2004; Sweeting et al., 2006; Thein et al., 2008; Bochud et al., 2009), as suggested by the MML estimates we provided. However, because the lack of required data in some of the reports precluded calculation of stage-specific rates for all included literature that examined fibrosis progression, our MML estimation must be viewed with caution.
This analysis is further limited by the shortcomings of the contributing reports. First, reports varied in methodology, particularly the definition of chronic infection, the approximation of date of infection, and recruitment location. The potential inclusion of RNA-negative participants and the use of date of first injection as a time point for infection would underestimate rates of fibrosis progression and incidence of severe liver outcomes. On the other hand, many of the included studies recruited participants from hospitals, especially liver units, and this may overestimate progression to serious sequelae. This concern arises from studies of other conditions showing that patients who are experiencing symptoms (and have more advanced disease) are more likely to be found in specialty clinics (Wilfley, Pike, Dohm, Striegel-Moore, & Fairburn, 2001; Ness, Leisenring, Goodman, Kawashima, Mertens, Oeffinger, Armstrong, & Robison, 2009).
Additionally, there was not enough information in the reports on factors that are known to influence the rate of progression (e.g., alcohol consumption), and thus we could not examine whether these factors explained variability. Furthermore, some extracted data, particularly those measuring baseline covariates, introduced the possibility of misclassification, wherein the reported sample characteristics may not accurately represent PWID after losses to follow-up. More consistent characterization and improved reporting of participants with respect to these prognostic factors in future studies will allow for more informative syntheses of disease progression rates.
Policy and research implications
Based on our synthesis of fibrosis progression, PWID on average will reach METAVIR stage F3 26–38 years after HCV infection, and will develop cirrhosis within 34–46 years. As in other populations where carcinogenic viruses are endemic, PWID are infected at an early age and thus may develop HCC in mid- to late-adulthood, leading to losses of individuals in their most productive period of life (Yang & Roberts, 2010). The prognosis following diagnosis with HCC is extremely poor, and the median length of survival is 12–15 months (Yip, Wantuck, Kim, Wong, Ahmed, Garcia, & Nguyen, 2014).
It is clear that there is a need for more literature describing the impact of alcohol consumption and other factors on disease development in PWID, particularly in view of the likelihood that new HCV treatments will not be made available on a public health scale and that other measures to reduce disease development will remain important. Consistent reporting of excess or problem drinking using standard measures, such as the Alcohol Use Disorders Identification Test (AUDIT) (Babor, Higgins-Biddle, Saunders, & Monteiro, 2001), will permit comparing and pooling of data across studies. Our review showed that the number of studies of the natural history of HCV in PWID is relatively small, so standard reporting of drinking and other patient characteristics is particularly important to advancing our understanding of the role of these factors.
Our results also demonstrate that attempts to manage HCV-related costs by delaying treatment with the new regimens until patients develop advanced disease will result in a period of infectiousness that persists for an average of three to four decades. The impact of such restrictions on any proposed HCV eradication efforts will certainly be deleterious, resulting in increased costs to care for ill patients and delaying the achievement of HCV control. A Markov model of treatment with new agents demonstrated that liver disease complications were three times higher post-treatment in patients with cirrhosis compared to those with less advanced disease (Younossi & Henry, 2014).
One of the main goals in synthesizing data on disease progression rates is to inform our (and others’) modeling of the impact of various combinations of prevention and treatment interventions on HCV disease burden and its associated costs to society and individual patients, so as to influence policy decisions regarding the allocation of public health resources. Recent evidence shows that combination prevention (opiate substitution treatment and syringe access) may reduce HCV incidence in PWID by 75–80% (Hagan, Pouget, & Des Jarlais, 2011; Turner, Hutchinson, Vickerman, Hope, Craine, Palmateer, May, Taylor, De Angelis, Cameron, Parry, Lyons, Goldberg, Allen, & Hickman, 2011).
However, just as new HCV treatments may not be implemented at public health scale to control HCV in PWID, the implementation of HCV prevention strategies lags far behind knowledge. Policy decisions regarding HCV treatment for PWID historically have been influenced by the perception that these patients will not adhere to treatment and will become re-infected (again, despite knowledge to the contrary) (Harris & Rhodes, 2013; de Vos & Kretzschmar, 2014). Progress toward elimination of HCV infection as a source of cirrhosis, liver failure and cancer will certainly require directly addressing the persistent stigmatization of drug use and drug users.
Highlights.
Early engagement in HCV needs to be a policy priority to address HCV as a source of serious disease in PWID.
The natural history of HCV among PWID was explored through systematic review and data synthesis.
Few people who inject drugs are engaged in needed care for chronic HCV infection.
PWID infected with HCV will develop liver sequelae in mid- to late-adulthood if left untreated.
Acknowledgements
We would like to gratefully acknowledge Dr. Jason Fletcher for his statistical assistance. This study is supported by the National Institutes of Health, grant numbers 1R01DA034637 and P30 DA011041.
Footnotes
Publisher's Disclaimer: This is a PDF file of an unedited manuscript that has been accepted for publication. As a service to our customers we are providing this early version of the manuscript. The manuscript will undergo copyediting, typesetting, and review of the resulting proof before it is published in its final citable form. Please note that during the production process errors may be discovered which could affect the content, and all legal disclaimers that apply to the journal pertain.
Conflict of interest
The authors have no conflicts of interest to disclose.
REFERENCES
- Aceijas C, Rhodes T. Global estimates of prevalence of HCV infection among injecting drug users. International Journal of Drug Policy. 2007;18(5):352–358. doi: 10.1016/j.drugpo.2007.04.004. [DOI] [PubMed] [Google Scholar]
- Adeyemi O, Jensen D, Attar B, Ghaoui R, Gallagher M, Wolen D, Cotler S. Hepatitis C treatment eligibility in an urban population with and without HIV coinfection. AIDS Patient Care STDs. 2004;18:239–245. doi: 10.1089/108729104323038919. [DOI] [PubMed] [Google Scholar]
- Alter M. HCV routes of transmission: What goes around comes around. Seminars in Liver Diseases. 2011;31(4):340–346. doi: 10.1055/s-0031-1297923. [DOI] [PubMed] [Google Scholar]
- American Association for the Study of Liver Diseases, Infectious Diseases Society of America, & International Antiviral Society—USA. Recommendations for testing, managing, and treating hepatitis C. 2015 doi: 10.1002/hep.31060. Retrieved 9th January 2015 from http://www.hcvguidelines.org. [DOI] [PMC free article] [PubMed]
- Averhoff F, Glass N, Holtzman D. Global burden of hepatitis C: considerations for healthcare providers in the United States. Clinical Infectious Diseases. 2012;55(Supplement 1):S10–S15. doi: 10.1093/cid/cis361. [DOI] [PubMed] [Google Scholar]
- Babor T, Higgins-Biddle J, Saunders J, Monteiro M. AUDIT. The Alcohol Use Disorders Identification Test: Guidelines for use in primary care. 2nd ed. Geneva: World Health Organization; 2001. [Google Scholar]
- Backmund M, Reimer J, Meyer K, Gerlach J, Zachoval R. Hepatitis C virus infection and injection drug users: Prevention, risk factors, and treatment. Clinical Infectious Diseases. 2005;40(Supplement 5):S330–S335. doi: 10.1086/427475. [DOI] [PubMed] [Google Scholar]
- Benhamou Y, Bochet M, Di Martino V, Charlotte F, Azria F, Coutellier A, Vidaud M, Bricaire F, Opolon P, Katlama C, Poynard T. Liver fibrosis progression in human immunodeficiency virus and hepatitis C virus coinfected patients. Hepatology. 1999;30(4):1054–1058. doi: 10.1002/hep.510300409. [DOI] [PubMed] [Google Scholar]
- Bochud P, Cai T, Overbeck K, Bochud M, Dufour J, Müllhaupt B, Borovicka J, Heim M, Moradpour D, Cerny A, Malinverni R, Francioli P, Negro F. Genotype 3 is associated with accelerated fibrosis progression in chronic hepatitis C. Journal of Hepatology. 2009;51:655–666. doi: 10.1016/j.jhep.2009.05.016. [DOI] [PubMed] [Google Scholar]
- Bonacini M, Groshen S, Yu M, Govindarajan S, Lindsay K. Chronic hepatitis C in ethnic minority patients evaluated in Los Angeles County. The American Journal of Gastroenterology. 2001;96(8):2438–2441. doi: 10.1111/j.1572-0241.2001.04050.x. [DOI] [PubMed] [Google Scholar]
- Chen S, Morgan T. The natural history of hepatitis C virus (HCV) infection. International Journal of Medical Sciences. 2006;3(2):47–52. doi: 10.7150/ijms.3.47. [DOI] [PMC free article] [PubMed] [Google Scholar]
- Colvin H, Mitchell A, editors. Hepatitis and liver cancer: A national strategy for prevention and control of hepatitis B and C. Washington, DC: Institute of Medicine; 2010. [PubMed] [Google Scholar]
- de Lucca Schiavon L, Narciso-Schiavon J, de Carvalho-Filho R. Non-invasive diagnosis of liver fibrosis in chronic hepatitis C. World journal of gastroenterology. 2014;20(11):2854–2866. doi: 10.3748/wjg.v20.i11.2854. [DOI] [PMC free article] [PubMed] [Google Scholar]
- de Vos A, Kretzschmar M. Benefits of hepatitis C virus treatment: A balance of preventing onward transmission and re-infection. Mathematical Biosciences. 2014;258:11–18. doi: 10.1016/j.mbs.2014.09.006. [DOI] [PubMed] [Google Scholar]
- DiMartino V, Rufat P, Boyer N, Renard P, Degos F, Martinot-Peignoux M, Matheron S, Le Moing V, Vachon F, Degott C, Valla D, Marcellin P. The influence of human immunodeficiency virus coinfection on chronic hepatitis C in injection drug users: A long-term retrospective cohort study. Hepatology. 2001;34(6):1193–1199. doi: 10.1053/jhep.2001.29201. [DOI] [PubMed] [Google Scholar]
- Fallatah H. Noninvasive Biomarkers of Liver Fibrosis: An Overview. Advances in Hepatology. 2014;2014 [Google Scholar]
- Fralick M. Screening urged for hepatitis C but drug costs are prohibitive. Canadian Medical Association Journal. 2014;186(5):329. doi: 10.1503/cmaj.109-4727. [DOI] [PMC free article] [PubMed] [Google Scholar]
- Gordon S, Bayati N, Silverman A. Clinical outcome of hepatitis C as a function of mode of transmission. Hepatology. 1998;28(2):562–567. doi: 10.1002/hep.510280238. [DOI] [PubMed] [Google Scholar]
- Grebely J, Prins M, Hellard M, Cox A, Osburn W, Lauer G, Page K, Lloyd A, Dore G. Hepatitis C virus clearance, reinfection, and persistence, with insights from studies of injecting drug users: Towards a vaccine. The Lancet Infectious Diseases. 2012;12(5):408–414. doi: 10.1016/S1473-3099(12)70010-5. [DOI] [PMC free article] [PubMed] [Google Scholar]
- Grebely J, Raffa J, Lai C, Krajden M, Kerr T, Fischer B, Tyndall M. Low uptake of treatment for hepatitis C virus infection in a large community-based study of inner city residents. Journal of Viral Hepatitis. 2009;16:352–358. doi: 10.1111/j.1365-2893.2009.01080.x. [DOI] [PubMed] [Google Scholar]
- Hagan H. Agent, host, and environment: Hepatitis C virus in people who inject drugs. The Journal of Infectious Diseases. 2011;204(12):1819–1821. doi: 10.1093/infdis/jir654. [DOI] [PubMed] [Google Scholar]
- Hagan H, Neurer J, Jordan A, Des Jarlais D, Wu J, Dombrowski K, Khan B, Braithwaite R, Kessler J. Hepatitis C virus infection among HIV-positive men who have sex with men: Protocol for a systematic review and meta-analysis. Systematic Reviews. 2014;3:31–37. doi: 10.1186/2046-4053-3-31. [DOI] [PMC free article] [PubMed] [Google Scholar]
- Hagan H, Pouget E, Des Jarlais D. A systematic review and meta-analysis of interventions to prevent hepatitis C virus seroconversion in people who inject drugs. Journal of Infectious Diseases. 2011;204:74–83. doi: 10.1093/infdis/jir196. [DOI] [PMC free article] [PubMed] [Google Scholar]
- Hajarizadeh B, Grebely J, Dore G. Epidemiology and natural history of HCV infection. Nature Reviews Gastroenterology and Hepatology. 2013;10(9):553–562. doi: 10.1038/nrgastro.2013.107. [DOI] [PubMed] [Google Scholar]
- Hallinan R, Byrne A, Agho K, Dore G. Referral for chronic hepatitis C treatment from a drug dependency treatment setting. Drug and Alcohol Dependence. 2007;88(1):49–53. doi: 10.1016/j.drugalcdep.2006.09.018. [DOI] [PubMed] [Google Scholar]
- Harder J, Walter E, Riecken B, Ihling C, Bauer T. Hepatitis C virus infection in intravenous drug users. Clinical Microbiology and Infection. 2004;10(8):768–770. doi: 10.1111/j.1469-0691.2004.00934.x. [DOI] [PubMed] [Google Scholar]
- Harris M, Rhodes T. Hepatitis C treatment access and uptake for people who inject drugs: A review mapping the role of social factors. Harm Reduction Journal. 2013;10(7) doi: 10.1186/1477-7517-10-7. [DOI] [PMC free article] [PubMed] [Google Scholar]
- Hayden J, Côté P, Bombardier C. Evaluation of the quality of prognosis studies in systematic reviews. Annals of Internal Medicine. 2006;144(6):427–437. doi: 10.7326/0003-4819-144-6-200603210-00010. [DOI] [PubMed] [Google Scholar]
- Hayden J, van der Windt D, Cartwright J, Côté P, Bombardier C. Assessing bias in studies of prognostic factors. Annals of Internal Medicine. 2013;158(4):280–286. doi: 10.7326/0003-4819-158-4-201302190-00009. [DOI] [PubMed] [Google Scholar]
- Higgins J, Thompson S, Deeks J, Altman D. Measuring inconsistency in meta-analyses. British Medical Journal. 2003;327:557–60. doi: 10.1136/bmj.327.7414.557. [DOI] [PMC free article] [PubMed] [Google Scholar]
- Hoofnagle J. Course and outcome of hepatitis C. Hepatology. 2002;36(Supplement 1):S21–S29. doi: 10.1053/jhep.2002.36227. [DOI] [PubMed] [Google Scholar]
- Jordan A, Des Jarlais D, Hagan H. Prescription opioid misuse and its relation to injection drug use and hepatitis C virus infection: Protocol for a systematic review and meta-analysis. Systematic Reviews. 2014;3:95–99. doi: 10.1186/2046-4053-3-95. [DOI] [PMC free article] [PubMed] [Google Scholar]
- Khan M, Thomas L, Byth K, Kench J, Weltman M, George J, Liddle C, Farrell G. How much does alcohol contribute to the variability of hepatic fibrosis in chronic hepatitis C? Journal of Gastroenterology and Hepatology. 1998;13(4):419–426. doi: 10.1111/j.1440-1746.1998.tb00657.x. [DOI] [PubMed] [Google Scholar]
- Khan M, Farrell G, Byth K, Lin R, Weltman M, George J, Samarasinghe D, Kench J, Kaba S, Crewe E, Liddle C. Which patients with hepatitis C develop liver complications? Hepatology. 2000;31(2):513–520. doi: 10.1002/hep.510310236. [DOI] [PubMed] [Google Scholar]
- Kielland K, Delaveris G, Rogde S, Eide T, Amundsen E, Dalgard O. Liver fibrosis progression at autopsy in injecting drug users infected by hepatitis C: A longitudinal long-term cohort study. Journal of Hepatology. 2014;60(2):260–266. doi: 10.1016/j.jhep.2013.09.022. [DOI] [PubMed] [Google Scholar]
- Kohli A, Shaffer A, Sherman A, Kottilil S. Treatment of Hepatitis C: A systematic review. Journal of the American Medical Association. 2014;312(6):631–640. doi: 10.1001/jama.2014.7085. [DOI] [PubMed] [Google Scholar]
- Larsen C, Bousquet V, Delarocque-Astagneau E, Pioche C, Roudot-Thoraval F. the HCV surveillance steering committee, the HCV surveillance group, & Desenclos, J Hepatitis C virus genotype 3 and the risk of severe liver disease in a large population of drug users in France. Journal of Medical Virology. 2010;82(10):1647–1654. doi: 10.1002/jmv.21850. [DOI] [PubMed] [Google Scholar]
- Lavanchy D. Evolving epidemiology of hepatitis C virus. Clinical Microbiology and Infection. 2011;17(2):107–115. doi: 10.1111/j.1469-0691.2010.03432.x. [DOI] [PubMed] [Google Scholar]
- Mathurin P, Moussall J, Cadranel J, Thibault V, Charlotte F, Dumouchel P, Cazier A, Huraux J, Devergie B, Vidaud M, Opolon P, Poynard T. Slow progression rate of fibrosis in hepatitis C virus patients with persistently normal alanine transaminase activity. Hepatology. 1998;27(3):868–872. doi: 10.1002/hep.510270333. [DOI] [PubMed] [Google Scholar]
- McGuinness P, Bishop G, Painter D, Chan R, McCaughan G. Intrahepatic hepatitis C RNA levels do not correlate with degree of liver injury in patients with chronic hepatitis C. Hepatology. 1996;23(4):676–687. doi: 10.1002/hep.510230404. [DOI] [PubMed] [Google Scholar]
- Moher D, Liberati A, Tetzlaff J, Altman D. The PRISMA Group. Preferred Reporting Items for Systematic Reviews and Meta-Analyses: The PRISMA Statement. PLOS Medicine. 2009;6(7):e1000097. doi: 10.1371/journal.pmed.1000097. [DOI] [PMC free article] [PubMed] [Google Scholar]
- Mohsen A, Easterbrook P, Taylor C, Portmann B, Kulasegaram R, Murad S, Wiselka M, Norris S. Impact of human immunodeficiency virus (HIV) infection on the progression of liver fibrosis in hepatitis C virus infected patients. Gut. 2003;52(7):1035–1040. doi: 10.1136/gut.52.7.1035. [DOI] [PMC free article] [PubMed] [Google Scholar]
- Nelson P, Mathers B, Cowie B, Hagan H, Des Jarlais D, Horyniak D, Degenhardt L. The epidemiology of viral hepatitis among people who inject drugs: Results of global systematic reviews. The Lancet Infectious Diseases. 2011;378:571–583. doi: 10.1016/S0140-6736(11)61097-0. [DOI] [PMC free article] [PubMed] [Google Scholar]
- Ness K, Leisenring W, Goodman P, Kawashima T, Mertens A, Oeffinger K, Armstrong G, Robison L. Assessment of selection bias in clinic-based populations of childhood cancer survivors: A report from the childhood cancer survivor study. Pediatric blood & cancer. 2009;52(3):379–386. doi: 10.1002/pbc.21829. [DOI] [PMC free article] [PubMed] [Google Scholar]
- Ostapowicz G, Bell SJ, Desmond PV. Severity of liver disease in hepatitis C infection contracted through injecting drug use. Australian and New Zealand Journal of Medicine. 1999;29(6):776–781. doi: 10.1111/j.1445-5994.1999.tb00779.x. [DOI] [PubMed] [Google Scholar]
- Peters D, Garg A, Bloom G, Walker D, Brieger W, Hafizur Rahman M. Poverty and access to health care in developing countries. Annals of the New York Academy of Sciences. 2008;1136(1):161–171. doi: 10.1196/annals.1425.011. [DOI] [PubMed] [Google Scholar]
- Pol S, Lamorthe B, Thi N, Thiers V, Carnot F, Zylberberg H, Berthelot P, Nalpas B. Retrospective analysis of the impact of HIV infection and alcohol use on chronic hepatitis C in a large cohort of drug users. Journal of Hepatology. 1998;28(6):945–950. doi: 10.1016/s0168-8278(98)80341-3. [DOI] [PubMed] [Google Scholar]
- Poynard T, Ratziu V, Charlotte F, Goodman Z, McHutchison J, Albrecht J. Rates and risk factors of liver fibrosis progression in patients with chronic hepatitis C. Journal of Hepatology. 2001;34(5):730–739. doi: 10.1016/s0168-8278(00)00097-0. [DOI] [PubMed] [Google Scholar]
- Rein D, Wittenborn J, Weinbaum C, Sabin M, Smith B, Lesesne S. Forecasting the morbidity and mortality associated with prevalent cases of pre-cirrhotic chronic hepatitis C in the United States. Digestive and Liver Disease. 2011;43(1):66–72. doi: 10.1016/j.dld.2010.05.006. [DOI] [PubMed] [Google Scholar]
- Robaeys G, Grebely J, Mauss S, Bruggmann P, Moussalli J, De Gottardi A, Swan T, Arain A, Kautz A, Stöver H, Wedemeyer H, Schaefer M, Taylor L, Backmund M, Dalgard O, Prins M, Dore G. Recommendations for the management of hepatitis C virus infection among people who inject drugs. Clinical Infectious Diseases. 2013;57(Supplement 2):S129–S137. doi: 10.1093/cid/cit302. [DOI] [PubMed] [Google Scholar]
- Rodríguez-Torres M, Ríos-Bedoya C, Rodríguez-Orengo J, Fernández-Carbia A, Marxuach-Cuétara A, López-Torres A, Salgado-Mercado R, Bräu N. Progression to cirrhosis in Latinos with chronic hepatitis C: differences in Puerto Ricans with and without human immunodeficiency virus coinfection and along gender. Journal of Clinical Gastroenterology. 2006;40(4):358–366. doi: 10.1097/01.mcg.0000210105.66994.dc. [DOI] [PubMed] [Google Scholar]
- Romeo R, Rumi M, Donato M, Cargnel M, Vigano P, Mondelli M, Cesana B, Colombo M. Hepatitis C is more severe in drug users with human immunodeficiency virus infection. Journal of Viral Hepatitis. 2000;7(4):297–301. doi: 10.1046/j.1365-2893.2000.00230.x. [DOI] [PubMed] [Google Scholar]
- Roudot-Thoraval F, Bastie A, Pawlotsky J, Dhumeaux D. Epidemiological factors affecting the severity of hepatitis C virus-related liver disease: A French survey of 6,664 patients. Hepatology. 1997;26(2):485–490. doi: 10.1002/hep.510260233. [DOI] [PubMed] [Google Scholar]
- SAS Institute Inc. SAS 9.3. Cary, NC: SAS Institute Inc.; 2012. [Google Scholar]
- Serfaty L, Costagliola D, Wendum D, Picard O, Meyohas M, Girard P, Lebas J, Delamare C, Poupon R, Housset C. Impact of early-untreated HIV infection on chronic hepatitis C in intravenous drug users: a case-control study. AIDS. 2001;15(15):2011–2016. doi: 10.1097/00002030-200110190-00014. [DOI] [PubMed] [Google Scholar]
- Souza A, Tovo C, Mattos A, Chaves S. There is no difference in hepatic fibrosis rates of patients infected with hepatitis C virus and those co-infected with HIV. Brazilian Journal of Medical and Biological Research. 2008;41(3):223–228. doi: 10.1590/s0100-879x2006005000200. [DOI] [PubMed] [Google Scholar]
- StataCorp. Stata Statistical Software: Release 13. College Station, TX: StataCorp LP; 2013. [Google Scholar]
- Sweeting M, De Angelis D, Neal K, Ramsay M, Irving W, Wright M, Brant L, Harris H. Trent HCV Study Group , HCV National Register Steering Group. Estimated progression rates in three United Kingdom hepatitis C cohorts differed according to method of recruitment. Journal of clinical epidemiology. 2006;59(2):144–152. doi: 10.1016/j.jclinepi.2005.06.008. [DOI] [PubMed] [Google Scholar]
- Thein H, Yi Q, Dore G, Krahn M. Estimation of stage-specific fibrosis progression rates in chronic hepatitis C virus infection: A meta-analysis and meta regression. Hepatology. 2008;48:418–431. doi: 10.1002/hep.22375. [DOI] [PubMed] [Google Scholar]
- Thomas D, Astemborski J, Rai RM, Anania FA, Schaeffer M, Galai N, Nolt K, Nelson K, Strathdee S, Johnson L, Laeyendecker O, Boitnott J, Wilson L, Vlahov D. The natural history of hepatitis C virus infection: host, viral, and environmental factors. Journal of the American Medical Association. 2000;284(4):450–456. doi: 10.1001/jama.284.4.450. [DOI] [PubMed] [Google Scholar]
- Tong M, El-Farra N. Clinical sequelae of hepatitis C acquired from injection drug use. Western Journal of Medicine. 1996;164(5):399. [PMC free article] [PubMed] [Google Scholar]
- Turner K, Hutchinson S, Vickerman P, Hope V, Craine N, Palmateer N, May M, Taylor A, De Angelis D, Cameron S, Parry J, Lyons M, Goldberg D, Allen E, Hickman M. The impact of needle and syringe provision and opiate substitution therapy on the incidence of hepatitis C virus in injecting drug users: pooling of UK evidence. Addiction. 2011;106:1978–1988. doi: 10.1111/j.1360-0443.2011.03515.x. [DOI] [PubMed] [Google Scholar]
- Viohl & Associates. The Sovaldi squeeze: High costs force tough state decisions. 2014 Retrieved 9th January 2015 from http://www.mhpa.org/_upload/SovaldiSqueeze-Oct2014.pdf.
- Wali M, Lewis S, Hubscher S, Harrison R, Ahmed M, Elias E, Mutimer D. Histological progression during short-term follow-up of patients with chronic hepatitis C virus infection. Journal of Viral Hepatitis. 1999;6(6):445–452. doi: 10.1046/j.1365-2893.1999.00186.x. [DOI] [PubMed] [Google Scholar]
- Wiessing L, Ferri M, Grady B, Kantzanou M, Sperle I, Cullen K, Hatzakis A, Prins M, Vickerman P, Lazarus J, Hope V, Matheï C. EMCDDA DRID group, Hepatitis C virus infection epidemiology among people who inject drugs in Europe: A systematic review of data for scaling up treatment and prevention. PloS one. 2014;9(7):e103345. doi: 10.1371/journal.pone.0103345. [DOI] [PMC free article] [PubMed] [Google Scholar]
- Wilfley D, Pike K, Dohm F, Striegel-Moore R, Fairburn C. Bias in binge eating disorder: How representative are recruited clinic samples? Journal of Consulting and Clinical Psychology. 2001;69(3):383–388. doi: 10.1037//0022-006x.69.3.383. [DOI] [PubMed] [Google Scholar]
- Wilson L, Torbenson M, Astemborski J, Faruki H, Spoler C, Rai R, Mehta S, Kirk G, Nelson K, Afdhal N, Thomas D. Progression of liver fibrosis among injection drug users with chronic hepatitis C. Hepatology. 2006;43(4):788–795. doi: 10.1002/hep.21091. [DOI] [PubMed] [Google Scholar]
- World Health Organization. Guidelines for the screening, care and treatment of persons with hepatitis C infection. 2014 [PubMed] [Google Scholar]
- Yang J, Roberts L. Hepatocellular carcinoma: A global view. Nature Reviews Gastroenterology & Hepatology. 2010;7(8):448–458. doi: 10.1038/nrgastro.2010.100. [DOI] [PMC free article] [PubMed] [Google Scholar]
- Yeh M, Buskell Z, Seeff L, Strader D, Wright E, Goodman Z. More severe parenchymal injury in chronic hepatitis C acquired by recent injection drug use. Journal of Clinical Gastroenterology. 2005;39(8):722–727. doi: 10.1097/01.mcg.0000173852.70419.21. [DOI] [PubMed] [Google Scholar]
- Yi Q, Wang P, Krahn M. Improving the accuracy of long-term prognositc estimates in hepatitis C virus infection. Journal of Viral Hepatitis. 2004;11:166–174. doi: 10.1046/j.1365-2893.2003.00484.x. [DOI] [PubMed] [Google Scholar]
- Yip B, Wantuck J, Kim L, Wong R, Ahmed A, Garcia G, Nguyen M. Clinical presentation and survival of Asian and non-Asian patients with HCV-related hepatocellular carcinoma. Digestive Diseases and Sciences. 2014;59(1):192–200. doi: 10.1007/s10620-013-2948-7. [DOI] [PubMed] [Google Scholar]
- Younossi Z, Henry L. The impact of the new antiviral regimens on patient reported outcomes and health economics of patients with chronic hepatitis C. Digestive and Liver Disease. 2014;46(Supplement 5):S186–S196. doi: 10.1016/j.dld.2014.09.025. [DOI] [PubMed] [Google Scholar]