Abstract
Sweat production is crucial for thermoregulation. However, sweating can be problematic for individuals with spinal cord injuries (SCI), as they display a blunting of sudomotor and vasomotor responses below the level of the injury. Sweat gland density and eccrine gland metabolism in SCI are not well understood. Consequently, this study examined sweat lactate (S-LA) (reflective of sweat gland metabolism), active sweat gland density (SGD), and sweat output per gland (S/G) in 7 SCI athletes and 8 able-bodied (AB) controls matched for arm ergometry VO2peak. A sweat collection device was positioned on the upper scapular and medial calf of each subject just prior to the beginning of the trial, with iodine sweat gland density patches positioned on the upper scapular and medial calf. Participants were tested on a ramp protocol (7 min per stage, 20 W increase per stage) in a common exercise environment (21±1°C, 45-65% relative humidity). An independent t-test revealed lower (p<0.05) SGD (upper scapular) for SCI (22.3 ±14.8 glands · cm−2) vs. AB. (41.0 ± 8.1 glands · cm−2). However, there was no significant difference for S/G between groups. S-LA was significantly greater (p<0.05) during the second exercise stage for SCI (11.5±10.9 mmol · l−1) vs. AB (26.8±11.07 mmol · l−1). These findings suggest that SCI athletes had less active sweat glands compared to the AB group, but the sweat response was similar (SLA, S/G) between AB and SCI athletes. The results suggest similar interglandular metabolic activity irrespective of overall sweat rate.
Keywords: adaptation, adult, body temperature regulation, eccrine glands, exercise, physiopathology, sweating, wheelchairs
INTRODUCTION
Sweat production plays a major role in thermal regulation in humans in moderate to hot environments. Thermoregulation is, in part, mediated by sweat rate (SR) and skin blood flow, which are both linked to metabolic heat production. In response to heat stress, trained individuals initiate sweating more quickly than untrained ones [1]. Furthermore, physical training increases the volume of sweat secreted from the eccrine sweat glands [2]. Athletes with spinal cord injuries (SCI) have a reduced sweat response below the level of their spinal cord injury [3]. Studies of paraplegic individuals have shown impaired thermoregulatory responses below the level of lesion during resting and exercising conditions. This indicates a reduced sympathetic nervous system response causing a decreased sweat rate and blood redistribution [3, 4, 5]. During physical activity in warm environments, athletes with SCI at or above the sixth thoracic vertebral level (T6) will typically sweat profusely above the level of the lesion but usually display no signs of perspiration below the lesion. This phenomenon does not usually occur in athletes with lower-level lesions [6]. Using sweat lactate concentrations, Green et al. [1] showed that sweat gland metabolism is different between high- and low-fitness participants, reflecting eccrine gland adaptations to training. However, studies looking at the sweat lactate response in athletes with spinal cord injuries are non-existent. Because sweat lactate is a product of eccrine gland metabolism [7, 8, 9] and is independent of blood lactate [7, 8], it directly reflects metabolic activities of eccrine glands. In SCI athletes who display a decreased sweat response below the level of the lesion, there is an increased reliance on the area of their body that can still contribute to evaporative cooling through sweating. This becomes increasingly important during exercise when metabolic heat production increases and the need to dissipate heat via evaporative sweat loss increases. It is plausible that the impaired sweat response over a portion of the body as observed in wheelchair athletes may prompt adaptive augmentations in the sweat glands covering the portion of the body unaffected by the SCI (i.e., altered metabolic activity in these eccrine sweat glands).
Relatively little is known regarding the sweat gland response in athletes with SCI. It is hypothesized that the metabolically active area (above the level of the lesion) will display a greater sweat rate per unit of active sweat glands, compared to their ambulatory fit counterparts. Therefore, this study compared sweat output per gland (S/G), sweat gland density (SGD) and sweat lactate (S-LA) of SCI athletes with matched controls. Knowing the metabolic response and number of active sweat glands could potentially be beneficial in order to better understand the thermoregulatory capacity of athletes with spinal cord injuries compared to ambulatory athletes.
MATERIALS AND METHODS
Participants
Fifteen subjects gave their informed consent to participate in this investigation, which received Institutional Review Board approval. The group was composed of 7 paraplegic athletes (SCI) (T11-C7; Table 1) and 8 able-bodied (AB) athletes. All descriptive characteristics are shown in Table 2 for both cohorts. It should be noted that the groups were carefully controlled for fitness, with a few of the control (AB) participants (40%) being recruited from the same wheelchair basketball programme (Table 1). Based on an alpha level of 0.05, an effect size of 80.0 glands · cm−2, an SD of 10 glands · cm−2 for sweat gland density, and a power of 0.80, an a priori power analysis indicated that 7 subjects per group would be needed [10].
TABLE 1.
Physiological measurements (means ± SD) for participants with spinal cord injuries (SCI). US classification for wheelchair basketball along with their level of lesion and completeness of injury are represented (National Wheelchair Basketball Association, 2006-2007).
| Subject | Age (years) | Height (cm) | Weight (kg) | Injury level | US Classification | Years since injury | VO2peak (l·min−1) | Fat mass (%) |
|---|---|---|---|---|---|---|---|---|
| 1 | 23 | 170 | 60.0 | T12/L1 | 6 | 6.5 | 2.06 | 25 |
| 2 | 31 | 174 | 44.5 | T5 Complete | 1 | 10.4 | 2.02 | 36 |
| 3 | 23 | 189 | 65.8 | T11 Complete | 1 | 2.8 | 2.89 | 10 |
| 4 | 19 | 174 | 57.0 | T12 Complete | 2 | 4.6 | 1.95 | 12 |
| 5 | 26 | 172 | 54.4 | T6 Incomplete | 1 | 11.9 | 2.93 | 13 |
| 6 | 20 | 157 | 44.4 | T3 Complete | 1 | 17.8 | 1.81 | 18 |
| 7 | 26 | 176 | 51.0 | T11 Complete | 2 | 20 | 2.6 | 27 |
| Mean ± SD | 24.0 ± 4.1 | 173.1 ± 9.4 | 55.4 ± 7.4 | 2.0 ± 1.8 | 10.6 ± 6.5 | 2.3 ± 0.5 | 20.1 ± 9.5 | |
TABLE 2.
Descriptive characteristics of AB and SCI subjects. Values are expressed as means and standard deviations.
| Variable | SCI (n = 7) | AB (n = 8) |
|---|---|---|
| Age (years) | 24.0 ± 4.1 | 28.6 ± 6.7 |
| Height (cm) | 173.1 ± 9.4 | 168.4 ± 17.1 |
| Weight (kg) | 54.0 ± 7.4* | 70.1 ± 13.7 |
| Body fat % | 20.1 ± 9.5 | 19.4 ± 7.0 |
| VO2 peak (l·min−1) | 2.3 ± 0.5 | 2.6 ± 0.8 |
Note: different at p<0.05
Procedures
Participants visited the laboratory on two separate occasions. On the first occasion, participants were required to do an incremental arm-crank exercise (ACE) test to determine VO2 peak with gas exchange data collected using a Vacumed metabolic system (Vacumed Vista, Ventura, CA). This involved two sub-maximal exercise stages of arm crank exercise (35 W, 50 W) separated by 1 min of passive recovery [11]. Once the second sub-maximal ACE stage and rest stage had been completed, subjects exercised to volitional exhaustion at a ramp rate of 20 W every 2 min. All tests were completed on a cycle ergometer (Monarch 850E) adapted for upper body exercise. Subjects were required to maintain a cadence of 60 rev · min−1 throughout the exercise. All trials were undertaken in a room temperature environment (21 ± 1°C, 55-65 ± 0.1% relative humidity). This was chosen to represent the most common indoor environment experienced by college wheelchair basketball players and to maintain high ecological validity.
Prior to the incremental arm-crank exercise, subjects’ anthropometric measurements of supine height (cm) and weight (kg) were made and body fat percentage was estimated by measuring skin fold thickness [three-site, Jackson & Pollock (1985)] using a skin-fold caliper (Lange, Cambridge, MD., USA).
Measurements
On arrival at the laboratory for the incremental test, thermocouples (Physitemp Instruments INC., Clifton, NJ) were positioned for measurement of rectal (Tre) and oesophageal temperatures (Tes). The oesophageal thermocouple was inserted using the following procedure: The inside of the nose of the subject was swabbed with a mild anaesthetic gel (7.5 % benzocaine), and a light covering of gel was also placed on the distal end of the thermocouples.
A single spray of a topical anaesthetic (Cetacaine, 14% benzocaine, Cetylite Ind. Inc., Pennsauken, NJ) was sprayed on the back of the throat. After 2 minutes, the participant, with verbal instructions, advanced the oesophageal probe up through the nasal passage and to the pharynx. At this point the probe was withdrawn slightly, and the participant was then asked to drink water through a right-angle straw and at the same time the probe was advanced into the oesophagus to a length of one-fourth of the subject's supine height. The thermocouple was then taped to the participant's cheek and across the shoulder [12]. A flexible rectal thermocouple (Trec) probe was self-inserted ∼8 cm beyond the anal sphincter. The rectal probe was securely taped, and the thermocouple wire was passed over the back of the wheelchair to minimize interference.
Heart rate was recorded using a heart rate (HR) monitor (Polar, Stamford, Conn., USA). The exercise test consisted of multiple stages beginning at a work load of 35 W. Each stage was 7 minutes in duration. At the end of each stage, participants had a 1-minute passive recovery period during which sweat samples were collected using a modified Brisson et al. (1991) method [13]. An 8 cm x 9 cm piece of impermeable parafilm (American Can, Greenwich, Conn.) was placed on the adhesive side of a 10 cm x 14 cm Opsite wound dressing (Smith and Nephew, Largo, FL., USA). This collection device was positioned on the upper scapular (right side) and medial calf (right leg) of each subject just prior to the beginning of the trial. At each specified rest interval, the dressing was peeled from the skin at the top and the sweat was collected using a 3 cc syringe (Becton Dickinson and Co., Franklin Lakes, NJ). The sweat sample was then weighed using an electronic scale (XL 1800, Denver Instrument Company, Denver, CO.). The pre-measured weight of the syringe was subtracted from the weight of the sample to calculate sweat rate per surface area. After each sample was collected, the Opsite device was removed, the skin of the collection site was dried with a clean cotton towel and the new sweat collection device was positioned in the same location. This method has been used in previous studies mmol · l−1 [1, 7, 14] to eliminate contamination in subsequent samples. Because the parafilm is impermeable, the sweat samples are altered minimally by evaporation. The sweat samples were analysed after they had been weighed using a lactate analyser (Analox, Lunenburg, MA, USA). Prior to each test, the analyser was calibrated at 8 mmol · l−1 standard and checked for linearity at 16 mmol · l−1 and 32 mmol · l−1.
Sweat gland density was calculated using a 8 cm x 9 cm patch of linen paper with 1-cm grids. The linen paper was treated with commercially available povidone-iodine (1% iodine, 10% povidone-iodine) topical antiseptic microbicide. Patches were positioned on the upper-right scapula and the medial aspect of the right calf, where they remained for ∼10 minutes or until the presence of blue-black dots on the linen paper had been identified. The paper was then removed and the number of black dots was counted, over an area of 1 square cm. The presence of a blue-black dot on the paper indicated an active sweat gland [15]. Sweat rate per unit surface area was calculated by dividing the sweat rate by the number of glands under the collection site. The gland number and the sweat rate were collected from separate measures located close together.
Statistical Analyses
Sweat rates and sweat lactate concentrations were compared using repeated measures ANOVA (2 group x 4 samples) with a Bonferroni post hoc test to control for experiment-wise error.
Sweat gland density was compared using an independent t-test between SCI and AB controls. Significance levels of alpha <0.05 were accepted.
RESULTS
Descriptive data for subjects with SCI (n = 7) and AB (n = 8) are presented in Table 2.
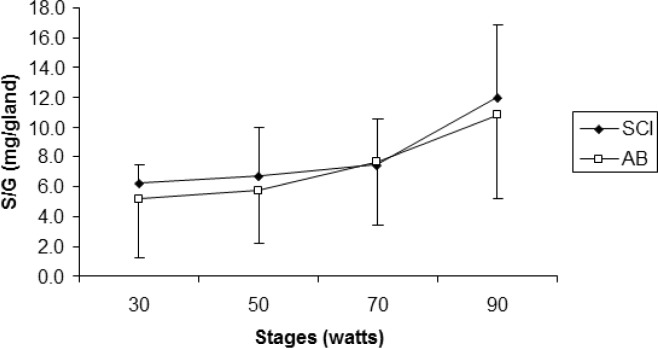
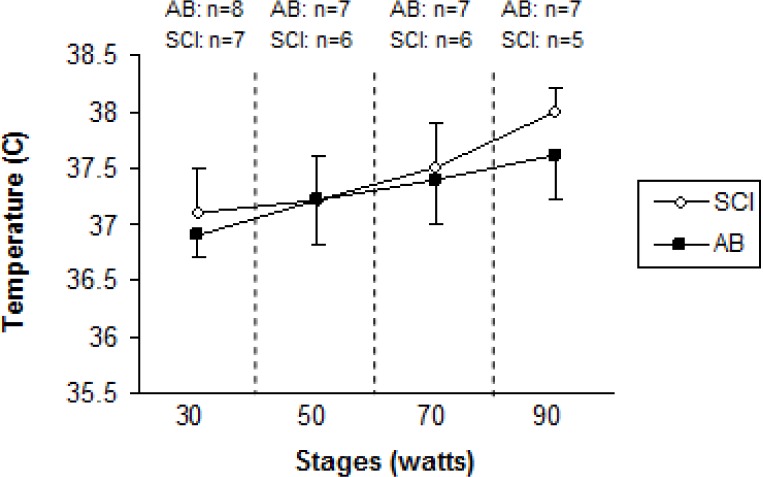
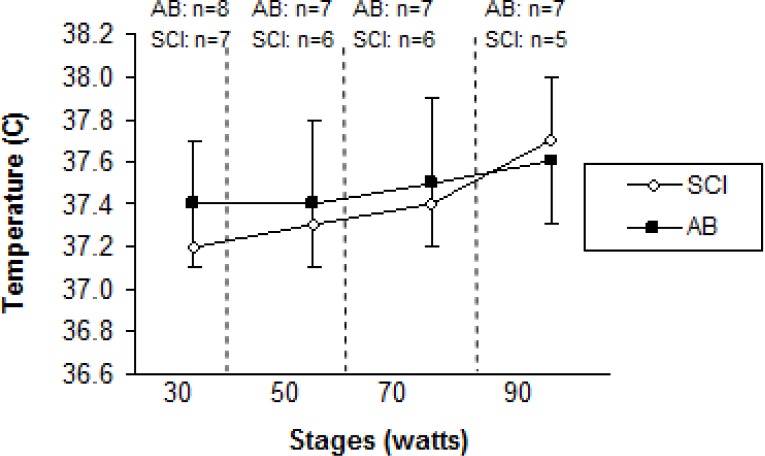
Age (years), height (cm), and peak VO2 (l · min−1) were not significantly different (p>.05) between SCI and AB groups. Weight was significantly lower for the SCI athletes compared to AB subjects. Mean test duration was 27 min 30 seconds. An independent t-test revealed that active SGD was significantly lower (p<.05) for SCI compared to AB (22.3 ± 14.8 glands · cm−2, 41.0 ± 8.1 glands · cm−2, respectively) (Figure 1). There were no active sweat glands detected for SCI participants on the medial calf. However, the sweat response below the level of the lesion was sporadic, with 4 of the 7 subjects reporting sweating around the groin region, although this was not measured. Repeated measures ANOVA showed that S-LA for the 50 W stage was significantly lower for the SCI group compared to AB more dilute initially may reflect an adaptation (11.5 ± 10.9 mmol · l−1, and 26.8 ± 11.07 mmol · l−1 for SCI and AB, respectively) (p = 0.05), but did not show differences for 30, 70 and 90 W stages (Figure 2). No difference was detected for S/G (Figure 3) for each incremental work 30, 50, 70, 90 W stage (5.0 ± 3.0 and 5.2 ± 3.9 mg · gland−1, 6.7 ± 3.3 and 5.7 ± 3.5 mg · gland−1, 7.4 ± 3.2 and 7.6 ± 4.17 mg · gland−1, 11.9 ± 5.0 and 10.8 ± 5.6 mg · gland−1, for the respective exercise stages). Similarly, there was no significant difference detected for HR (Figure 4), Trec, or Tes between groups (Figure 5 and Figure 6). For one SCI athlete, there was no sweat gland density detected at either site of measurement. This individual also had the highest lesion level, at T3.
FIG. 1.
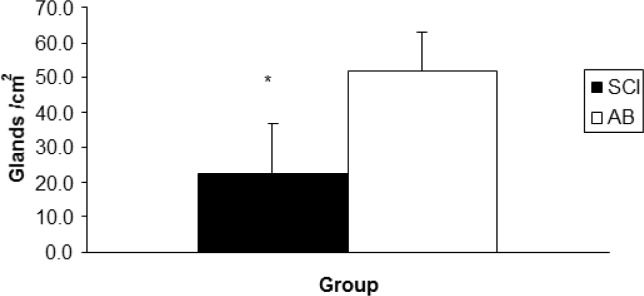
Mean sweat gland density per cm2 for athletes with SCI and able-bodied athletes (AB).
A significant difference was observed between groups (*p<0.05).
FIG. 2.
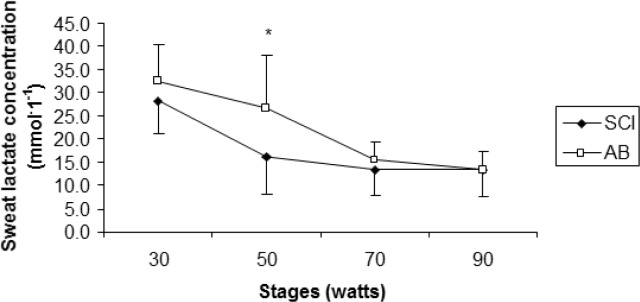
Mean sweat lactate concentrations (mmol · 1−1) for athletes with SCI and able-bodied athletes (AB).
A significant difference was detected at the 50 W stage between groups (*p< 0.05).
FIG. 3.
Mean sweat secretion per gland (mg/gland) for each stage, between athletes with SCI and able-bodied athletes (AB).
No significant differences (p>0.05) between groups were found.
FIG. 4.

Mean heart rate across time (beats · min−1) for athletes with SCI and able-bodied athletes (AB). No significant differences (p>0.05) between groups were found.
FIG. 5.
Oesophageal temperature (Tes) for spinal cord injured (SCI) wheelchair athletes and able-bodied (AB) controls, during incremental exercise for arm crank ergometry. Sample size (n) is given for each stage that was accomplished.
FIG. 6.
Rectal temperature (Trec) for spinal cord injured (SCI) wheelchair athletes and able-bodied (AB) controls, during incremental exercise for arm crank ergometry. Sample size (n) is given for each stage that was accomplished.
DISCUSSION
It was found that individuals with SCI have a compromised ability to thermoregulate, which can lead to magnified risk of thermal injury [16]. The purpose of this study was to add to our understanding of the sweat gland response of SCI athletes. The study was undertaken in a common mild environment (simulation of a typical wheelchair basketball playing environment) under exercise conditions that were intended to simulate the duration and intensity of a typical competition half. Our intent was to maintain high ecological validity throughout the investigation in order to make the results of this study applicable to an active SCI population partaking in wheelchair sports. In this study we investigated SGD, S-LA, and S/G during dynamic exercise in SCI and AB participants matched for fitness using a ramped arm crank protocol under environmental conditions common during indoor wheelchair basketball competition. AB measures were collected to provide control data when comparing S/G, SGD, and SLA to the SCI population at two different sites in order to compare regional (i.e. above and below the lesion) differences in these variables.
The main findings indicate that the density of the eccrine sweat glands for the SCI participants in our sample was less than for the AB population. However, participants anecdotally reported sweating below the level of the lesion, predominantly around the groin region. No active sweat glands were detected for any member of the SCI group on the medial calf (measurement site, below the level of lesion). Furthermore, all subjects were matched based on fitness. Three AB subjects had experienced training identical to the SCI group participating in the same wheelchair basketball team (absolute VO2 peak is presented in Table 2).
S/G increased dramatically after the 70 W stage; however, no difference was detected between the two groups. This supports the findings of Kondo et al. [17], who noted that there was an abrupt increase in sweat gland activity, sweat rate, and number of activated sweat glands after the onset of sweating during exercise in an able-bodied population. Although there was no statistical difference between groups, there was an associated increase in core temperature after 70 W in both groups; this also relates to a decrease in SLA concentration. Previous authors have stated that gland efficiency may contribute to a change in lactate concentration. While this study failed to measure ATP turnover, it is plausible to speculate that myoepithelial cell contraction emits a greater volume of sweat relative to ATP production [1]. This would explain the dilution of lactate in the sweat, due to a higher S/G with similar metabolic demand between groups. These results are similar to trials that have compared able-bodied groups between environments [1].
Thermoregulatory responses in individuals with SCI have not been documented as extensively as for able-bodied athletes [4, 6, 12, 18, 19]. The level and degree of the lesion relates directly to its impact on thermoregulatory-related physiology. The level of the lesion in the spine and the degree of the injury usually determine the extent of the incapacitation. In athletes with paraplegia, responses of both the vasomotor and the sudomotor systems are dependent on the lowest intact portion of the sympathetic chain [20]. Furthermore, Price et al. [11] stated that at submaximal levels of exercise (60% of VO2 peak) in a similar environment to the current investigation, trained individuals with thoracic, lumbar, or sacral SCI (paraplegia) experience an increase in core temperature similar to their able-bodied counterparts, which is indicative of the comparable volumes of S/G (Figure 3) identified in the current investigation.
Hopman et al. [19] compared the effects of exercise and thermal stress on cardiovascular exercise in a hot (35°C 70% relative humidity) environment in participants with SCI of varied levels of lesion. Participants were categorized into three different groups: thoracic level (T) T2- 6, T7-8, and T9-12. Participants performed 45 min of arm crank exercise. Hopman et al. concluded that athletes with paraplegia during prolonged arm-crank exercise in a hot environment experienced a sweat loss and sweat rate relative to their amount of sensate skin area and therefore their level of spinal cord lesion. The participants with T 7-8 lesions exhibited a mean sweat rate of 3,700 mg · cm−2 · min−1 and the T9-12 group had a sweat rate of 5,200 mg · cm−2 · min−1, whereas mean SR for the SCI group in the current investigation was significantly lower than that of the AB controls (23 mg · cm−2 · min−1 and 53 mg · cm−2 · min−1 for SCI and AB, respectively) (p>0.05). The current investigation observed sweat rates considerably lower than those of Hopman et al. primarily because of the much lower thermal stress. In the current study, a lower level of stress was chosen because normal function was of more interest than maximal function.
Yaggie et al. [11] examined eccrine gland sensitivity of upper and lower extremities in a population which was composed of untrained able-bodied individuals, untrained SCI individuals, and trained SCI athletes. Sweat production was induced by pilocarpine iontophoresis at the site of the flexor carpi radialis and medial gastrocnemius muscle. The findings suggest that the SCI athletes had a decreased sweat rate for both the upper and lower extremities (3,610 ± 2100 mg · cm−2 · min−1 and 710 ± 8100 mg · cm−2 · min−1) vs. the able-bodied participants (7,580 ± 1990 mg · cm−2 · min−1 and 4,420 ± 1230 mg · cm−2 · min−1 for upper and lower extremities), but it was greater than that of the untrained SCI athletes (1,080 ± 1,010 mg · cm−2 · min−1 and 420 ± 350 mg · cm−2 · min−1 for upper and lower extremities, respectively). However, the sweat gland density between the trained SCI athletes and the untrained able-bodied athletes was not significantly different. Furthermore, the results of the current study revealed no sweat response below the site of the medial gastrocnemius, unlike that of Yaggie et al. [11], who artificially induced sweating at both sites of measurement by iontophoresis. This could possibly explain the difference in sweat response due to the gymnasium simulated climate for the current study not eliciting a large thermal strain. Yaggie et al. [11] studied athletes of higher lesion level, cervical (C) 4-8, compared to T3-12 in the present study. The findings of our study support the notion that the sweat glands of SCI exercisers are functional, but lack neural stimulus.
To date, there have been no other studies investigating sweat lactate responses of exercising athletes with SCI. However, a limited number of studies have been done on able-bodied subjects looking at fitness, gender and different environments [7, 8, 12]. In the current investigation we evaluated the sweat lactate response in AB athletes and SCI athletes in a very mild environment. Initially, both groups had high S-LA concentrations, with the SCI athletes showing a quicker drop in concentration during the second stage when compared to the AB group, which was significantly higher. Green et al. [8] reported that there were no significant differences in S-LA between aerobically fit and unfit male able-bodied participants, irrespective of significantly greater sweat rates for trained athletes.
Conversely, sweat rate per gland increased slightly in our SCI participants over the last two stages. This is consistent with what would be expected and with the findings of Green et al. [7, 8, 14].
It has been posited that the decline in S-LA concentration after the initially high levels may be due to reabsorption of lactate by the eccrine gland. The difference between high S-LA production and relatively low reabsorption at the onset of exercise could also explain the initially high levels of S-LA [1].
In this study, S/G, S-LA, and SGD were measured on the upper scapula and on the medial calf. It has been noted that the density and capacity of sweat glands to produce sweat differ from one region to another [5, 9, 21, 22]. Therefore, it would be helpful to investigate multiple regional differences between individuals with SCI and AB individuals. The findings of the present study suggest that there is little difference between sweat responses (S/G and S-LA) and gland density between SCI and AB subjects under favourable gymnasium type conditions during high-intensity incremental exercise. However, initially higher sweat lactate concentration for SCI vs. AB indicates intraglandular adaptations.
A limitation to this study may be that there was limited thermal strain, due to the moderate environment in which it was performed. Nevertheless, the environment was justified because a high level of environmental validity was maintained. Therefore, the practical application of these results is that there is little difference in sweat response between SCI (paraplegia) and AB while working to volitional fatigue in a typical wheelchair basketball playing environment.
CONCLUSIONS
Upper right scapulae of SCI athletes have a similar sweat response to their matched AB counterparts. However, a lower SGD in the SCI athletes suggests that their sweat glands are more active. Furthermore, it should be noted that since SCI athletes were smaller in body size (Table 2), their heat production per unit surface area was higher at a fixed external workload on the arm ergometer (assuming similar mechanical efficiencies between SCI and AB groups). Therefore their skin wettedness required for heat regulation (% of skin surface covered with sweat) would be greater. It is plausible that this could be exacerbated even more by the fact that their effective surface area would be much lower, since they have areas of skin that are not innovated due to their injuries. However, in this cohort the SCI athletes still had a lower number of active sweat glands per cm2. This is strong evidence that the sudomotor activity is significantly reduced in the SCI group, as one would have expected a greater number of actual sweat glands (active or not) per cm2 because of their diminished surface area available for sweating. Individuals with paraplegia have a severely depressed ability to sweat below their level of injury. No sweat gland density or activity was detected below the level of the lesion for any of our paraplegic participants. This was most likely due to sympathetic decentralization [12].
Acknowledgements
Thank you to Smith and Nephew for their donation of the Opsite Wound Dressing used in the sweat collection in the current study.
Conflict of interests
The authors declared no conflict of interests regarding the publication of this manuscript.
REFERENCES
- 1.Green JM, Pritchett RC, Tucker DC, Crews TR, McLeaster JR. Sweat lactate responses during cycling at 30C and 18C WBGT. J Sports Sci. 2004;22:321–327. doi: 10.1080/02640410310001641575. [DOI] [PubMed] [Google Scholar]
- 2.Buono MJ, Sjohlm NT. Effect of physical training on peripheral sweat production. J Appl Physiol. 1998;65:811–814. doi: 10.1152/jappl.1988.65.2.811. [DOI] [PubMed] [Google Scholar]
- 3.Guttman WL, Silver J, Wyndham CH. Thermoregulation in spinal man. J Physiol. 1958;142:406–419. doi: 10.1113/jphysiol.1958.sp006026. [DOI] [PMC free article] [PubMed] [Google Scholar]
- 4.Petrofsky JS. Thermoregulatory stress during rest and exercise in heat in patients with a spinal cord injury. Eur J Appl Physiol. 1992;64:503–507. doi: 10.1007/BF00843758. [DOI] [PubMed] [Google Scholar]
- 5.Price MJ, Campbell IG. Effects of spinal cord lesion level upon thermoregulation during exercise in the heat. Med Sci Sports Exerc. 2003;35:1100–1107. doi: 10.1249/01.MSS.0000074655.76321.D7. [DOI] [PubMed] [Google Scholar]
- 6.Figoni SF. Exercise responses and quadriplegia. Med Sci Sports Exerc. 1993;25:577–583. [PubMed] [Google Scholar]
- 7.Green JM, Bishop PA, Muir IH, McLester JR, Heath H. Effects of high and low blood lactate concentrations on sweat lactate response. Int J Sports Med. 2000;2:1–5. doi: 10.1055/s-2000-8483. [DOI] [PubMed] [Google Scholar]
- 8.Green JM, Bishop PA, Muir IH, Lomax RG. Lactate-sweat relationships in younger and middle-aged men. J Age Phys Activity. 2001;9:67–77. [Google Scholar]
- 9.Sato K. The physiology, pharmacology, and biochemistry of the eccrine sweat gland. Rev Physiol Biochem Pharmacol. 1977;19:51–131. doi: 10.1007/BFb0037089. [DOI] [PubMed] [Google Scholar]
- 10.Lenth RV. Java applets for power and sample size [Computer software] 2006-2009; Retrieved Nov 17, 2006, from http://www.stat.uiowa.edu/∼rlenth/power . [Google Scholar]
- 11.Yaggie JA, Niemi T, Buono MJ. Sweat gland activity following thermal and cholinergic training. Biol Sport. 2005;22:3–11. [Google Scholar]
- 12.Price MJ, Campbell IG. Thermoregulatory and physiological responses of wheelchair athletes to prolonged arm crank ergometry. Int J Sports Med. 1999;20:457–463. doi: 10.1055/s-1999-8831. [DOI] [PubMed] [Google Scholar]
- 13.Brisson GR, Boisvert P, Peronnet F, Perrault H, Boisvert D, Lafond JS. A simple and disposable sweat collector. Eur J Appl Physiol Occup Physiol. 1991;63:269–272. doi: 10.1007/BF00233860. [DOI] [PubMed] [Google Scholar]
- 14.Green JM, Bishop PA, Muir IH, Lomax RG. Lactate-sweat relationships in younger and middle-aged men. J Age Phys Activity. 2001;9:67–77. [Google Scholar]
- 15.Davis SL, Wilson TE, Vener MJ, Crandall CG, Petajan HJ, White AT. Pilocarpine-induced sweat gland function in individuals with multiple sclerosis. J Appl Physiol. 2005;98:740–1744. doi: 10.1152/japplphysiol.00860.2004. [DOI] [PubMed] [Google Scholar]
- 16.Bhambhani Y. Physiology of wheelchair racing in athletes with spinal cord injury. Sports Med. 2002;32:23–51. doi: 10.2165/00007256-200232010-00002. [DOI] [PubMed] [Google Scholar]
- 17.Kondo N, Tominaga H, Shibasaki M, Aoki K, Koga S, Nishiyasu T. Modulation of thermoregulatory sweating response to mild hypothermia during activation of the muscle metaboreflex in humans. J Physiol. 1999;515:591–598. doi: 10.1111/j.1469-7793.1999.591ac.x. [DOI] [PMC free article] [PubMed] [Google Scholar]
- 18.Gass GC, Camp EM. The maximum physiological response during incremental wheelchair and arm cranking exercise in male paraplegics. Med Sci Sports Exerc. 1984;16:355–364. [PubMed] [Google Scholar]
- 19.Hopman MT, Oeseburg B, Binkhors RA. Cardiovascular responses in persons with paraplegia to prolonged arm exercise and thermal stress. Med Sci Sports Exerc. 1993;25:577–583. [PubMed] [Google Scholar]
- 20.Normell LA. Distribution of impaired cutaneous vasomotor and sudomotor function in paraplegic man. Scan J Clinl Lab Invesig. 1974;33:25–41. [PubMed] [Google Scholar]
- 21.Sato K, Sato F. Individual variations in structure and functioning of human eccrine sweat gland. Am J Physiol. 1983;245:203–208. doi: 10.1152/ajpregu.1983.245.2.R203. [DOI] [PubMed] [Google Scholar]
- 22.Gass GC, Camp EN, Nadel ER, Gwinn TH, Engel P. Rectal and rectal vs. esophageal temperatures in paraplegic men during prolonged exercise. J Appl Physiol. 1988;64:2265–2271. doi: 10.1152/jappl.1988.64.6.2265. [DOI] [PubMed] [Google Scholar]


