

ABSTRACT
Marburg virus is a genetically simple RNA virus that causes a severe hemorrhagic fever in humans and nonhuman primates. The mechanism of pathogenesis of the infection is not well understood, but it is well accepted that pathogenesis is appreciably driven by a hyperactive immune response. To better understand the overall response to Marburg virus challenge, we undertook a transcriptomic analysis of immune cells circulating in the blood following aerosol exposure of rhesus macaques to a lethal dose of Marburg virus. Using two-color microarrays, we analyzed the transcriptomes of peripheral blood mononuclear cells that were collected throughout the course of infection from 1 to 9 days postexposure, representing the full course of the infection. The response followed a 3-stage induction (early infection, 1 to 3 days postexposure; midinfection, 5 days postexposure; late infection, 7 to 9 days postexposure) that was led by a robust innate immune response. The host response to aerosolized Marburg virus was evident at 1 day postexposure. Analysis of cytokine transcripts that were overexpressed during infection indicated that previously unanalyzed cytokines are likely induced in response to exposure to Marburg virus and further suggested that the early immune response is skewed toward a Th2 response that would hamper the development of an effective antiviral immune response early in disease. Late infection events included the upregulation of coagulation-associated factors. These findings demonstrate very early host responses to Marburg virus infection and provide a rich data set for identification of factors expressed throughout the course of infection that can be investigated as markers of infection and targets for therapy.
IMPORTANCE Marburg virus causes a severe infection that is associated with high mortality and hemorrhage. The disease is associated with an immune response that contributes to the lethality of the disease. In this study, we investigated how the immune cells circulating in the blood of infected primates respond following exposure to Marburg virus. Our results show that there are three discernible stages of response to infection that correlate with presymptomatic, early, and late symptomatic stages of infection, a response format similar to that seen following challenge with other hemorrhagic fever viruses. In contrast to the ability of the virus to block innate immune signaling in vitro, the earliest and most sustained response is an interferon-like response. Our analysis also identifies a number of cytokines that are transcriptionally upregulated during late stages of infection and suggest that there is a Th2-skewed response to infection. When correlated with companion data describing the animal model from which our samples were collected, our results suggest that the innate immune response may contribute to overall pathogenesis.
INTRODUCTION
Marburg virus disease (MVD) is a rare and highly fatal disease that occurs following exposure to Marburg virus (MARV). MARV is an RNA virus in the family Filoviridae and has been associated with severe viral hemorrhagic fever in human and other primates, with a mortality rates of up to 90% (1–3). Before 2000, MVD was considered less lethal than another filoviral disease, Ebola virus disease (EVD). However, the high fatality rates (83%) during an outbreak in the Democratic Republic of the Congo (1998 to 2000) offered the first evidence that MARV can be as lethal as EBOV (4). In 2005, during an outbreak in Angola, a new strain of MARV resulted in a 90% fatality rate (5). More recent reports of MVD describe outbreaks in 2007, 2012, and 2014 in Uganda (6, 7), an imported case in the Netherlands in 2008 (8, 9), and a likely imported case in Colorado, USA, also in 2008 (10). Recent modeling data suggest that as many as 27 countries with more than 100 million people are at risk for Marburg virus infection (11).
Severe infection with MARV in humans is characterized by immune suppression and delayed antibody responses (2). Several animal models have been developed to aid research into the pathogenesis of MARV, from mice to macaques (12–14). MARV infection of mouse species (15), cynomolgus macaques (13), and rhesus macaques (16) suggests that there is an early loss of lymphocytes following infection. Interestingly, during the late stage of infection, the significant increase of double-positive (CD4 and CD8) T cells has been detected in macaques infected with MARV (17).
Dendritic cells (DCs) are suggested to be the major initial target of MARV infection (13). Infected DCs fail to produce cytokines such as alpha interferon (IFN-α), interleukin 1B (IL-1B), IL-6, IL-10, RANTES, IL-12, and IL-8. They fail to mature and do not support T cell proliferation (18). MARV can also infect and grow in human monocytes/macrophages (19, 20) and endothelial cells (20). However, unlike DCs, these infected cells secrete several chemokines and proinflammatory cytokines, such as tumor necrosis factor alpha (TNF-α), IL-6, IL-8, and growth-regulated oncogene alpha/CXCL1 (Gro-alpha/CXCL1) (21). One hypothesis for the induction of severe pathogenesis in Marburg-infected individuals is that the hyperactivation of immune cells results in the release of massive amounts of cytokines. This in turn results in the induction of a hemorrhagic, septic, shock-like response. A thorough classification of which cytokines and chemokines are released at the end stages of the disease has not been previously described, and it has been unclear whether innate responses are also a component of the host response to infection.
Because of the relatively small number of infections that occur with this virus, how Marburg virus infections are initiated remains poorly defined. There is a clear role for blood-based transmission, but in addition, recent infections with the Ebola filovirus have suggested that infection through airborne particles is possible, and animal model studies have suggested that filovirus infections that involve airway installation may lead to greater transmissibility (22). Against this background, there is little current analysis of Marburg virus infection through an airway route of infection.
Here we describe the transcriptomic response of the circulating immune response in a serial sacrifice primate model of aerosol infection with MARV, which is described in the accompanying paper (23). In this model, the circulating immune response to a fatal dose of MARV from an airway installation was investigated using high-density microarrays. Analysis over the entire disease course showed that there are specific genomic signatures of the immune response to MARV infection, including an early and sustained innate immune response, the upregulation of multiple signaling pathways, and a number of chemokines and cytokines that make up the late-phase cytokine storm.
MATERIALS AND METHODS
Animals.
Samples used for the study reported here were taken from a sequential sampling study that is described in the accompanying article (23), and a detailed explanation of the animal model and associated virological, clinical, and pathology data can be found therein. All experiments involving the use of MARV in animals were performed in a U.S. Army Research Institute of Infectious Diseases (USAMRIID) biosafety level 4 (BSL-4) laboratory. Briefly, rhesus macaques were obtained from licensed and approved vendors and assigned to groups prior to study initiation. During the acclimation to the BSL-4 containment suite, a prechallenge blood sample (at day −8) was collected to provide a baseline for further analyses. On day 0, nonhuman primates (NHPs) were anesthetized, and minute volumes were calculated by performing whole-body plethysmography (Buxco Research Systems, Wilmington, NC) just prior to MARV exposure. NHPs in a head-only chamber in a class III biological safety cabinet maintained under negative pressure were exposed to a target dose of 1,000 PFU of Marburg Angola virus. Aerosols were created by a 3-jet Collison nebulizer (BGI, Inc., Waltham, MA) and controlled by the automated bioaerosol exposure system. The virus preparation used to infect NHPs was free of contamination with endotoxin and mycoplasma. After challenge, blood samples were collected at various days postexposure (p.e.), based on approved collection allowances and at euthanasia. Groups of three NHPs were euthanized at days 1, 3, 5, 7, and 9 p.e., and peripheral blood mononuclear cells (PBMCs) were prepared from the blood that had been collected.
The study was carried out in accordance with standards of USAMRIID Institutional Animal Care and Use Committee (IACUC)-approved protocols in compliance with the regulations outlined in the U.S. Department of Agriculture Animal Welfare Act, Public Health Service Policy, and other federal statutes and regulations relating to animals and experiments involving animals. The USAMRIID facility is accredited by the Association for Assessment and Accreditation of Laboratory Animal Care, International, and all animal work done adheres to the conditions specified in the Guide for the Care and Use of Laboratory Animals (24). Animals were given enrichment regularly as recommended by the Guide for the Care and Use of Laboratory Animals (24). The animals were fed and checked at least daily according to the protocol. All efforts were made to minimize painful procedures; the attending veterinarian was consulted regarding painful procedures. Following the development of clinical signs, animals were checked multiple times daily. When clinical observations and scores of animals reached defined levels based on the approved IACUC protocol, animals were euthanized under anesthesia to minimize pain and distress.
RNA processing and DNA microarrays.
PBMCs were isolated from blood prediluted with saline using Accuspin system Histopaque-1077 tubes (Sigma-Aldrich, St. Louis, MO) as per the manufacturer's recommendations and were subsequently lysed in TRI Reagent LS (Sigma-Aldrich) at USAMRIID. PBMCs were processed for microarray analysis as described earlier (25). Briefly, total RNA was extracted from the TRI Reagent LS samples and then amplified using the low-input Quick Amp labeling kit (Agilent Technologies, Santa Clara, CA). Amplified RNA was hybridized to whole human genome oligonucleotide microarrays (Agilent) in a 2-color comparative format along with a reference pool of mRNA. Images were scanned using the Agilent high-resolution microarray scanner, and raw microarray images were processed using Agilent's feature extraction software. All changes in transcription from the pre-exposure samples were subtracted from the postexposure samples.
DNA microarray data processing.
Data were first background corrected to remove noise from background intensity levels and then normalized within the arrays using the Limma software package in R. After normalization, the reference and experimental samples were compared to generate log2 fold change values that represent a change in mRNA expression (either positive or negative). At this step, the internal array control probes were removed. Each array was then further normalized using the preexposure control array for that animal to remove monkey-specific expression changes from baseline. A comparison of gene expression for day −8 and day 0 samples revealed no differences in gene expression (data not shown), and day −8 gene expression was chosen as the pre-exposure control. The resulting data set was filtered for differential expression and annotated with gene names. The data set was hierarchically clustered using the Cluster 3.0 and visualized using Java Treeview. Functional annotations of gene clusters were assigned using the Database for Annotation, Visualization, and Integrated Discovery (DAVID) (http://david.abcc.ncifcrf.gov/). The P values reported are the values reported by DAVID and are based on the EASE score. The EASE score is an alternative name for Fisher exact statistics used in the DAVID system, referring to a one-tail Fisher exact probability value for gene enrichment analysis.
Cytokine detection by multiplex analysis.
Cytokines were assayed from the plasma of MARV-exposed NHPs using a NHP magnetic bead 23-plex multiplex assay (Millipore EMD, Billerica, MA) in accordance with manufacturer's instructions. Briefly, samples from both preexposure and postexposure time points were assayed in triplicate and washed using a Bio-Rad Bioplex Pro II wash station (Bio-Rad, Hercules, CA) equipped with a magnetic manifold. Data were acquired using a Bio-Rad Bioplex 3D system and analyzed using Bio-Plex Manager 6.0 software and a 5-parameter logarithmic fit. Cytokine concentrations in assayed samples were derived from the standards run for each assay plate. Cytokines/chemokines assayed included granulocyte-macrophage colony-stimulating factor (GM-CSF), interferon alpha (IFN-α), interferon gamma (IFN-γ), interleukin 1β (IL-1β), IL-1 receptor antagonist (IL-1RA), IL-2, IL-4, IL-5, IL-6, IL-8, IL-10, IL-12/23(p40), IL-13, IL-15, IL-17, IL-18, monocyte chemoattractant protein 1 (MCP-1), macrophage inflammatory protein 1α (MIP1α), MIP1β, transforming growth factor alpha (TGF-α), vascular endothelial growth factor (VEGF), sCD40L, and tumor necrosis factor alpha (TNF-α).
Validation of gene expression by RT-PCR.
RT-PCR assays were carried out to quality check and validate our findings on the DNA microarrays. An RT2 Profiler PCR array (Qiagen, Valencia, CA) was used to run the RT-PCR. One hundred twenty-five genes of interest were plated on the custom array along with control genes. RNA extracted from the PBMCs (as described in “RNA processing and DNA microarrays” above) was used for RT-PCR array. RNA samples collected at three different time points from each animal were run on one plate. In all, six custom plates (each with a copy of the same probes for 125 genes) with samples from six different animals were run in this experiment. The RT-PCR experiment was performed as directed by the manufacturer (Qiagen). Plates were then run on an Applied Biosystems 7900HT fast real-time quantitative PCR (qPCR) system (Life Technologies, Grand Island, NY) using the following cycling conditions: 10 min at 95°C, 15 s at 95°C, followed by 1 min at 60°C for 60 cycles. Following the PCR run for all 6 plates, the threshold was made uniform to be consistent among all the plates. Cycle threshold values for each sample were obtained. Results were interpreted using SDS software version 2.4 and data analysis software from the manufacturer (SA Biosciences). Finally, data from different animals on a given day were pooled and averaged. Data were then presented as fold change over day −8 expression (see Fig. S2 in the supplemental material).
Microarray data accession number.
The microarray data set was submitted to the Gene Expression Omnibus (GEO) database, under series record GSE58287.
RESULTS
Overview of samples in study data set.
Samples from 15 adult rhesus macaques infected with Marburg Angola virus (MARV) via the aerosol route (target of 1,000 PFU [23]) were used for analysis. Prior to infection, blood samples from each animal were taken for use as controls (8 samples at day −8 and 7 samples on day −7). At sequential days postexposure (p.e.), blood samples were collected and PBMCs were prepared from approximately 1 ml of whole blood. Table 1 illustrates the samples in the study sorted by day p.e. Samples were further divided into three general stages: early infection (1 to 3 days p.e.), midinfection (5 days p.e.), and late infection (7 to 9 days p.e.), which correspond roughly to presymptomatic, early symptomatic, and late symptomatic stages of infection (see reference 23 for supporting model information). RNA was prepared from the PBMCs, labeled, and hybridized to Agilent two-color microarray chips according to previously described methods (26). All arrays were computationally analyzed using the Limma software package in Bioconductor, a suite of packages in R (25).
TABLE 1.
PBMC samples obtained from NHPs exposed to Marburg virus via the aerosol routea
| Infection stage | Day | Sample from MARV-exposed nonhuman primate: |
||||||||||||||
|---|---|---|---|---|---|---|---|---|---|---|---|---|---|---|---|---|
| A | B | C | D | E | F | G | H | I | J | K | L | M | N | O | ||
| Preinfection | −8 | • | • | • | • | • | • | • | • | |||||||
| −7 | • | • | • | • | • | • | • | |||||||||
| Early infection | 1 | • | • | • | ||||||||||||
| 3 | • | • | • | |||||||||||||
| Mid-infection | 5 | • | • | • | ||||||||||||
| Late infection | 7 | • | • | • | ||||||||||||
| 9 | • | • | • | |||||||||||||
Samples from MARV-exposed NHPs (designated A through O) were sorted by the day the sample was collected postexposure and further divided into three general categories (early, middle, and late induction of infection) to ease interpretation. Pre-exposure samples (days −8 and −7) were collected prior to MARV exposure and were used to normalize data obtained from subsequent samples from the same animal.
Increases in cytokine mRNA from PBMCs match protein accumulation in serum.
In an effort to compare our microarray data to commonly accepted biomarkers already defined in Marburg virus infection, we evaluated changes in mRNA levels for several cytokines/chemokines that have previously been shown to accumulate to high levels in the serum of infected NHPs (13): IL-6, MIP-1α (CCL3), and MCP-1 (CCL2). IL-6 protein was detectable in the serum of MARV-exposed animals beginning at day 5 p.e. IL-6 mRNA increased in PBMCs at 1 to 2 days prior to the appearance of IL-6 in serum (Fig. 1A). MIP-1α and MCP-1 both showed an increase in expression in serum at day 7 p.e. (Fig. 1B and C). For each of these cytokines, mRNA levels increased at the same time. In a separate analysis, next-generation sequencing (NGS) of PBMCs (analyzed as described in reference 27) showed that virus mRNA accumulated on approximately the same time course in which viremia appeared (Fig. 1D) (27). These data supported the hypothesis that the PBMC transcriptome appreciably mimics the behavior of the overall immune response to viral infection and led us to further analyze the gene expression changes that followed exposure to MARV.
FIG 1.

Comparison of changes in PBMC cytokine mRNAs to serum cytokine protein levels during MARV infection. Changes (fold) in IL-6 (A), MCP-1 (B), and MIP-1α (C) mRNA induction from PBMCs and IL-6 (A), MCP-1 (B), and MIP-1α (C) protein induction from serum are shown. Error bars represent standard errors over three separate microarrays for each time point.
MARV infection results in a significant upregulation of immune response genes.
To identify genes that showed significant transcriptional regulation following exposure to Marburg virus, we used criteria similar to those previously used to analyze the transcriptional response in other filovirus infections (28–30). This analysis showed that when experimental arrays were compared to the preinfection controls, 1,754 probes (1,213 genes) showed at least a 2-log-fold change in their expression pattern in at least 3 arrays (see Fig. S1 in the supplemental material). Out of the 1,213 differentially expressed genes, 69% were upregulated and 31% were downregulated (see Fig. S1A in the supplemental material). Broadly, the most upregulated class of genes was the regulators of immune response (consistent with a robust and varied immune response) (see Fig. S1 in the supplemental material), and the downregulated group of genes contained many regulators of transcription and signal transduction (e.g., phosphatidylinositide 3-kinase [PI3K] signaling) (see Fig. S1B in the supplemental material).
Within the set of upregulated mRNAs, three major patterns of gene regulation were readily visible. These patterns roughly correlated with early, middle, and late stages of infection. When we raised our threshold of analysis to capture only genes that had at least a 3-log-fold differential expression following exposure to MARV, 295 differentially expressed genes were identified, and the same patterns were observed (Fig. 2A). Of these strongly upregulated genes, 265 (87%) were upregulated and 39 (13%) were downregulated. The upregulated genes are primarily associated with the host inflammatory and cytokine responses. The downregulated genes belong to regulators of kinase activity and the cell cycle. Most of the genes that were highly upregulated following exposure to MARV showed an increase in expression on day 5 or 7 p.e., and their expression was sustained throughout the course of disease. A large number of these genes showed slight downregulation early in infection prior to becoming upregulated.
FIG 2.

Strongly upregulated genes in MARV-exposed NHPs. (A) Heat map illustration showing 295 hierarchically clustered genes that showed at least a 3-log2-fold differential expression following challenge. Each row in the heat maps represents data from an individual gene, and each column represents the individual PBMC sample taken at a specific infection stage. Samples from the data set were grouped as in Table 1. Red and blue colors denote expression levels greater or less than baseline (white), respectively, and colored outlines (rust, green, and yellow) identify significant clusters of genes induced during early, middle, and late disease, respectively, and are labeled accordingly. (B) Expanded view of these gene clusters. The most significant functional groups (assigned by DAVID; P < 0.001) found in the respective clusters are listed to the right of the heat maps, along with the names of some representative genes.
Within this set of strongly regulated genes, upregulated genes showed the same three-phase temporal expression changes as were seen in the original set of genes (early-, middle-, and late-expressed gene clusters) (Fig. 2B). To validate that the changes seen by microarray analysis were reflective of mRNA levels, we selected more than 30 genes for validation by real time-PCR (RT-PCR). This analysis (see Fig. S2 in the supplemental material) showed that there was good agreement between RT-PCR and microarray fold changes, with the microarray data underestimating changes found by RT-PCR in several instances. These results gave us confidence that the changes in gene expression seen via microarray analysis were a true representation of changes in mRNA levels in the analyzed cell population.
Pathway analysis of genes stimulated by MARV infection.
From the set of 295 genes that were upregulated more than 3 log-fold following Marburg virus infection, we were interested in identifying gene networks that appeared to be coordinately regulated. As an initial method of analyzing these interactions, we looked for known connections between these genes using pathway analysis. A connection diagram generated by this approach highlighted cJun/Fos, nuclear factor κB (NF-κB), CCCAT enhancer-binding protein ε (C/EBPε), and innate immune signaling pathways (signal transducers and activators of transcription 1 [Stat1], interferon regulatory factor 3 [IRF3], and IRF7) as transcription factors whose activity is stimulated during infection (Fig. 3). Importantly, the transcription factor activity associated with interferon and pathogen-associated molecular pattern (PAMP) receptors (Stat1, IRF3, and IRF7) was observed early (day 1 to 3 p.e.) during infection, while the activation of NF-κB/REL, activator protein 1 (AP-1), and C/EBP, which are associated with regulating the production of inflammatory mediators in immune cells (31), showed a later upregulation (day 5 to 7 p.e.).
FIG 3.

Signaling network of genes that are strongly upregulated following MARV challenge of NHPs. By using Ingenuity Pathway Analysis (IPA) to map the genes which were found to be strongly upregulated following MARV challenge, 34 gene products (nodes with official gene symbols) were found to be directly or indirectly connected according to Ingenuity's database of published interactions. Edges without arrows indicate a direct interaction between two gene products, e.g., a protein-protein interaction. Edges with arrows represent a regulation of transcription, directed from the gene regulator to a regulated gene. Loops indicate self-regulation.
Evidence of an early innate immune response in MARV-infected macaques.
As was suggested by the identification of IRF3/7 and Stat1 transcription signatures in Fig. 3, many interferon-stimulated genes (ISGs) in PBMCs were upregulated following exposure to MARV. These genes, which included those encoding the interferon-induced tetratricopeptide repeat (IFIT) protein family, RNA helicases, and components of the ISG15 antiviral response pathway, were evident very early postexposure, beginning at days 1 to 3 p.e. (Fig. 4A). IFIT1 and the cytokines CCL2 and CXCL10 showed upregulation almost immediately (day 1 p.e.) (Fig. 4A), while other STAT1/IRF-responsive genes, such as those encoding ISG15, MX1 and many others, showed strong upregulation beginning at 3 days p.e. (Fig. 4A and B). This upregulation of innate immune response genes was restricted to these genes, as no significant expression changes were detected in genes involved in other innate defense genes, such as the complement pathway genes C1R and C1S, or antigen presentation genes, such as the gene for proteasome activator subunit 1 (PSME1) (Fig. 4C). These data show that an interferon or interferon-like signature is generated in the circulating immune system following exposure to Marburg virus and prior to viremia.
FIG 4.
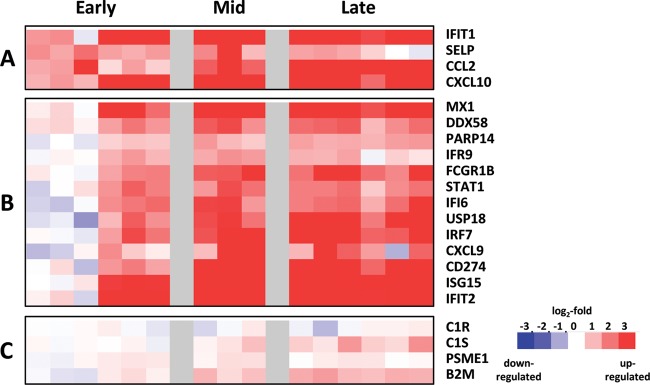
Innate immune response as indicated by mRNA expression following MARV challenge. Heat maps show the mRNA expression levels of a selection of day 1-responsive genes (A), genes upregulated beginning at day 3 postexposure (B), and complement-associated genes showing little change in gene expression (C). Red and blue colors denote expression levels greater or less than baseline (white), respectively.
Expression of inflammatory mediators in MARV-infected macaques.
As noted above, results of prior studies have demonstrated an upregulation of many inflammatory mediators, such as IL-6 and MIP-1α (13, 14, 17), in the plasma of MARV-infected macaques (13, 14, 17). While our data confirm the upregulation of these cytokines (Fig. 1), we also observed an upregulation of cytokine-associated transcripts, including IL-1A and -B, the IL-1 receptor, and the decoy receptor IL-1R2 (Fig. 5A), in a pattern similar to what was observed for the early mRNA expression of CCL2/MCP-1. This pattern of upregulation of both cytokine and its cognate receptor suggested that there was coordinated signaling and response in PBMCs at early times of infection. This pattern was distinct from the regulation of other cytokines such as IL-2RA, IL-8, CCL3, and CXCL1, which all showed little upregulation until late times postinfection.
FIG 5.

Expression of inflammatory mediators in MARV-exposed NHPs. Heat maps illustrate the expression of mRNAs from inflammation-associated genes. (A) Classical mediators, such as IL-6, IL-1β, and IL-8, and receptors, such IL-1R1 and -2, are upregulated. (B) Other inflammatory mediators, such as IL-4, IL-5, and CXCL10, are upregulated. (C) Downregulated mediators, such as CXCR4 and IL-23, are shown.
Results of our study also identified changes in a number of inflammatory mediators that have not been previously been analyzed during MARV infection (Fig. 5B). Transcripts of CCL8, CXCL10, CCR5, and CXCR6 were upregulated at early times postinfection. IL-27, IL-1RN, CCL17, CCL23, CXCL9, CCR1, CXCR1, and CXCR2 were upregulated beginning on day 5 p.e. IL-1RAP, CCL1, CCL3L3, CCL7, CCL18, and CXCL6 were seen during late infection. A number of cytokines were downregulated, including IL-23A, IL-1F6, and its receptor. Interestingly, transcripts of the fractalkine receptor CX3CR1 were upregulated early (day 1 through 5) during MARV infection and were significantly down-modulated during late-stage disease (Fig. 5C), a behavior similar to its downregulation in sepsis patients (32).
Appearance of Th2-associated cytokines.
We noted the appearance of transcripts for several Th2-associated cytokines, such as IL-5 and (to a lesser extent) IL-4. The mRNA for these cytokines increased beginning at day 3 p.e., peaked at day 7 p.e., and declined thereafter (Fig. 6A). In contrast, we did not see appreciable changes in transcripts for cytokines associated with a Th1 response such as IL-12, TNF-α, and CCL5 (RANTES) until very late times postexposure (see Fig. 6A). These changes suggest that the immune system in infected NHPs was responding in a manner that supported Th2 (humoral) and suppressed Th1 (cell-mediated) responses.
FIG 6.

Alteration of Th2-associated cytokines in animals exposed to MARV. (A) Average mRNA fold changes over time for IL-4, IL-5, IL-12, CCL5, and TNF-α. (B) Levels of IL-10, IL-5, and IL-4 protein in serum from animals infected with Marburg virus. Values were measured using a Bioplex 3D analyzer.
Analysis of cytokine protein concentrations in the serum of infected animals using Bioplex-based analysis provided supporting evidence that Th2 cytokines were expressed at early stages of MARV infection. This analysis showed a spike in IL-5 at day 3 p.e. (Fig. 6B), consistent with the increase in transcript expression. In addition, IL-10 also showed increased expression at early times postexposure, though there was no increase in transcript observed in PBMCs, suggesting that it originated from a different cellular compartment (Fig. 6B). Th1 cytokines TNF-α and IFN-γ showed little expression at early times postexposure but did begin to accumulate at late times of infection (23). These data suggest that early responses to Marburg virus infection were consistent with the generation of a Th2 response to infection.
DISCUSSION
Despite the high mortality associated with Marburg virus infection, there is little information on the nature of the systemic response to viral infection, especially when the infection is through an aerosol route. This study offers the first transcriptomic analysis of how the circulating immune system changes in response to lethal challenge with the Marburg virus. These efforts are complemented by companion studies that define the virus replication kinetics, tropism and pathology, cytokine profiles, and immunologic responses to infection in the animals at increasing times postinfection (23). Our analysis allows direct determination of when the circulating immune cells begin to respond to infection compared to where the virus has traveled through the animal.
Our analysis confirms that in PBMCs, increases in cytokine mRNA expression match the appearance of these cytokines in MARV-infected NHPs and humans (Fig. 1) (13, 14). This is consistent with the idea that the circulating immune system is either the source of these cytokines or an effective proxy marker of the overall immune response. Our results also highlight the fact that these known cytokine expression changes (i.e., IL-6 and MIP-1α) are a small part of an extensive and ordered transcriptomic response to infection.
In Marburg-virus infected NHPs, circulating immune cells have three readily classified stages (early, middle, and late) of response to infection that roughly correlate with disease progression as classified by traditional clinical approaches. The earliest transcriptional response that we observe in PBMCs following aerosol challenge with MARV is a stimulation of the innate immune response. This response is detected within 24 h postexposure, highlighting the rapid response of the circulating immune system following a respiratory challenge. This response is consistent with a strong early innate response seen in models of other virus infections (25, 26, 29, 33, 34). The cluster of genes stimulated during early infection (days 1 to 3 p.e.) following MARV challenge most closely resembles a type 1 IFN-stimulated response (35) (I. S. Caballero and J. H. Connor, unpublished data). Though it has been shown that MARV infection leads to IFN production in infected macaques (13, 17), we did not observe an appreciable IFN mRNA upregulation in PBMCs, leaving the stimulator of this innate response undefined.
An important aspect of this early innate response that we observed is that it is markedly different from what previous studies have predicted. Earlier microarray studies showed that MARV infection blocks the ability of cells to upregulate innate antiviral responses to IFN/Stat1 signaling (28) in an in vitro infection. In addition, other studies have shown that in Marburg virus-infected cells, IFN signaling can be blocked via the reduction of STAT1 activation (36). These earlier results have led to the hypothesis that Marburg virus actively suppresses innate immune responses during infection. Our results show that regardless of the ability of Marburg virus to repress interferon signaling in infected cells, there is a strong innate immune response induction in circulating PBMCs at a very early time postinfection. This response is very strong and is sustained throughout infection, suggesting a potential role in pathogenesis.
The appearance of an early innate immune response following infection is not unique to Marburg virus infection. It is observed as an early response in nonhuman primates infected with Lassa virus and with Ebola virus (26, 27, 29) and has also been noted in human influenza and RSV infections (29). The fact that virus replication continues and increases in the PBMC compartment (increasing) levels of virus-specific mRNA as infection progresses (Fig. 1) even after there is maximal expression of innate immune genes is consistent with MARV replication proceeding even after a systemic innate immune response has been induced. Our observations, while counter to current dogma, are consistent with results showing that exogenous treatment of infected NHPs with interferon to stimulate innate immune responses has only a modest effect on fatality rates (37). These results also suggest that initiating a strong innate immune response does not strongly limit Marburg virus infection.
Beyond the description of a strong early innate immune response and a coherent induction of known Marburg virus infection-responsive cytokines, our data also found that additional cytokines/chemokines, such CCL8 (MCP2) and CXCL10 (IP-10), show increased expression early in MARV infection and also found evidence for expression of IL-4 and IL-5 on both the mRNA and protein level at early points of infection. These findings suggest the potential for Th2 skewing of the early responses to MARV infection, but additional investigation of gene expression in circulating T cells will be needed to confirm this hypothesis. Further analysis of clinical data will be required to determine if these chemokines circulate in the serum of MARV-infected patients, but if they do, these chemokines could be used as early biomarkers of infection to trigger intervention with existing postexposure therapies (38).
Our analysis also highlighted an interesting parallel between the Marburg virus infection-induced changes in mRNA levels for the fractalkine receptor CX3CR1 and the changes seen in the same mRNA in patients with sepsis. CX3CR1 mRNA is downregulated in PBMCs from MARV-exposed animals at the late stage of infection. Studies of patients succumbing to septic shock found that CX3CR1 downregulation at both the mRNA and protein levels was associated with poor prognosis and immune exhaustion (32, 39). Our results suggest that this downregulation also occurs in Marburg virus infection and that CX3CR1 levels could be monitored in Marburg virus-infected patients as a prognostic marker.
Also consistent with the eventual disseminated intravascular coagulation (DIC) pathology associated with Marburg hemorrhagic fever, our results show strong late-stage expression of coagulation response genes in the PBMCs of MARV-infected animals. We observed increased expression in coagulation-associated genes, such as PLAU, PLAUR, and F8, that was largely confined to the late stage of infection (days 7 to 9) (data not shown), after changes in D-dimers and activated protein C were evident as serum markers (23). Expression of coagulation response genes following MARV infection is delayed compared to that observed in Ebola virus-infected NHPs, in which expression was observed as early as 4 days p.e. (25, 29). Compared with earlier experimental results, our data suggest that the involvement of PBMCs in the thrombotic dysregulation in MARV infection is similar but not identical to that seen in Ebola virus-infected animals (16, 29).
This analysis of the circulating immune system response to MARV infection adds to a growing body of information on how a number of viruses stimulate the host circulating immune system following infection. A detailed comparison of how different viral infections stimulate different immune responses can be done using data sets tracking the response of NHP PBMCs to Lassa virus infection (26) and influenza virus infection (40) and of human PBMCs to influenza virus infection (33, 34, 41). Already, preliminary direct analysis has shown that large parts of the initial response to each of these viruses are the same but that unique differences in initial gene expression during viral infections exist and can be predictive of specific infections (27). These distinct responses may also predict the different pathological changes of the diseases. Further investigation of these differences will lead to a better molecular understanding of the pathogenesis of Marburg virus infection and identify new strategies for decreasing fatality rates associated with these infections.
Supplementary Material
ACKNOWLEDGMENTS
We gratefully acknowledge the technical assistance of Carly Wlazlowski at USAMRIID, who assisted in the collection of PBMC samples. We also thank Elke Muhlberger and Lee Wetzler for helpful comments on the manuscript and Laura Bollinger for providing technical writing services.
This work was supported by contracts W81XWH 100-02-0008 and 11-02-0130.
Footnotes
Supplemental material for this article may be found at http://dx.doi.org/10.1128/JVI.01142-15.
REFERENCES
- 1.Feldmann H. 2006. Marburg hemorrhagic fever—the forgotten cousin strikes. N Engl J Med 355:866–869. doi: 10.1056/NEJMp068160. [DOI] [PubMed] [Google Scholar]
- 2.Brauburger K, Hume AJ, Muhlberger E, Olejnik J. 2012. Forty-five years of Marburg virus research. Viruses 4:1878–1927. doi: 10.3390/v4101878. [DOI] [PMC free article] [PubMed] [Google Scholar]
- 3.Martines RB, Ng DL, Greer PW, Rollin PE, Zaki SR. 2015. Tissue and cellular tropism, pathology and pathogenesis of Ebola and Marburg viruses. J Pathol 235:153–174. doi: 10.1002/path.4456. [DOI] [PubMed] [Google Scholar]
- 4.Bausch DG, Nichol ST, Muyembe-Tamfum JJ, Borchert M, Rollin PE, Sleurs H, Campbell P, Tshioko FK, Roth C, Colebunders R, Pirard P, Mardel S, Olinda LA, Zeller H, Tshomba A, Kulidri A, Libande ML, Mulangu S, Formenty P, Grein T, Leirs H, Braack L, Ksiazek T, Zaki S, Bowen MD, Smit SB, Leman PA, Burt FJ, Kemp A, Swanepoel R. 2006. Marburg hemorrhagic fever associated with multiple genetic lineages of virus. N Engl J Med 355:909–919. doi: 10.1056/NEJMoa051465. [DOI] [PubMed] [Google Scholar]
- 5.Towner JS, Khristova ML, Sealy TK, Vincent MJ, Erickson BR, Bawiec DA, Hartman AL, Comer JA, Zaki SR, Stroher U, Gomes da Silva F, del Castillo F, Rollin PE, Ksiazek TG, Nichol ST. 2006. Marburgvirus genomics and association with a large hemorrhagic fever outbreak in Angola. J Virol 80:6497–6516. doi: 10.1128/JVI.00069-06. [DOI] [PMC free article] [PubMed] [Google Scholar]
- 6.Adjemian J, Farnon EC, Tschioko F, Wamala JF, Byaruhanga E, Bwire GS, Kansiime E, Kagirita A, Ahimbisibwe S, Katunguka F, Jeffs B, Lutwama JJ, Downing R, Tappero JW, Formenty P, Amman B, Manning C, Towner J, Nichol ST, Rollin PE. 2011. Outbreak of Marburg hemorrhagic fever among miners in Kamwenge and Ibanda Districts, Uganda, 2007. J Infect Dis 204(Suppl 3):S796–S799. doi: 10.1093/infdis/jir312. [DOI] [PMC free article] [PubMed] [Google Scholar]
- 7.Albariño CG, Shoemaker T, Khristova ML, Wamala JF, Muyembe JJ, Balinandi S, Tumusiime A, Campbell S, Cannon D, Gibbons A, Bergeron E, Bird B, Dodd K, Spiropoulou C, Erickson BR, Guerrero L, Knust B, Nichol ST, Rollin PE, Ströher U. 2013. Genomic analysis of filoviruses associated with four viral hemorrhagic fever outbreaks in Uganda and the Democratic Republic of the Congo in 2012. Virology 442:97–100. doi: 10.1016/j.virol.2013.04.014. [DOI] [PMC free article] [PubMed] [Google Scholar]
- 8.Timen A, Isken LD, Willemse P, van den Berkmortel F, Koopmans MP, van Oudheusden DE, Bleeker-Rovers CP, Brouwer AE, Grol RP, Hulscher ME, van Dissel JT. 2012. Retrospective evaluation of control measures for contacts of patient with Marburg hemorrhagic fever. Emerg Infect Dis 18:1107–1114. [DOI] [PMC free article] [PubMed] [Google Scholar]
- 9.Timen A, Koopmans MP, Vossen AC, van Doornum GJ, Gunther S, van den Berkmortel F, Verduin KM, Dittrich S, Emmerich P, Osterhaus AD, van Dissel JT, Coutinho RA. 2009. Response to imported case of Marburg hemorrhagic fever, the Netherlands. Emerg Infect Dis 15:1171–1175. doi: 10.3201/eid1508.090015. [DOI] [PMC free article] [PubMed] [Google Scholar]
- 10.CDC. 2009. Imported case of Marburg hemorrhagic fever—Colorado, 2008. MMWR Morb Mortal Wkly Rep 58:1377–1381. [PubMed] [Google Scholar]
- 11.Pigott DM, Golding N, Mylne A, Huang Z, Weiss DJ, Brady OJ, Kraemer MUG, Hay SI. 2015. Mapping the zoonotic niche of Marburg virus disease in Africa. Trans R Soc Trop Med Hyg 109:366–378. doi: 10.1093/trstmh/trv024. [DOI] [PMC free article] [PubMed] [Google Scholar]
- 12.Bradfute SB, Warfield KL, Bray M. 2012. Mouse models for filovirus infections. Viruses 4:1477–1508. doi: 10.3390/v4091477. [DOI] [PMC free article] [PubMed] [Google Scholar]
- 13.Hensley LE, Alves DA, Geisbert JB, Fritz EA, Reed C, Larsen T, Geisbert TW. 2011. Pathogenesis of Marburg hemorrhagic fever in cynomolgus macaques. J Infect Dis 204(Suppl 3):S1021–S1031. doi: 10.1093/infdis/jir339. [DOI] [PubMed] [Google Scholar]
- 14.Alves DA, Glynn AR, Steele KE, Lackemeyer MG, Garza NL, Buck JG, Mech C, Reed DS. 2010. Aerosol exposure to the angola strain of marburg virus causes lethal viral hemorrhagic fever in cynomolgus macaques. Vet Pathol 47:831–851. doi: 10.1177/0300985810378597. [DOI] [PubMed] [Google Scholar]
- 15.Warfield KL, Bradfute SB, Wells J, Lofts L, Cooper MT, Alves DA, Reed DK, VanTongeren SA, Mech CA, Bavari S. 2009. Development and characterization of a mouse model for Marburg hemorrhagic fever. J Virol 83:6404–6415. doi: 10.1128/JVI.00126-09. [DOI] [PMC free article] [PubMed] [Google Scholar]
- 16.Geisbert TW, Daddario-DiCaprio KM, Geisbert JB, Young HA, Formenty P, Fritz EA, Larsen T, Hensley LE. 2007. Marburg virus Angola infection of rhesus macaques: pathogenesis and treatment with recombinant nematode anticoagulant protein c2. J Infect Dis 196(Suppl 2):S372–S381. doi: 10.1086/520608. [DOI] [PMC free article] [PubMed] [Google Scholar]
- 17.Fritz EA, Geisbert JB, Geisbert TW, Hensley LE, Reed DS. 2008. Cellular immune response to Marburg virus infection in cynomolgus macaques. Viral Immunol 21:355–363. doi: 10.1089/vim.2008.0023. [DOI] [PubMed] [Google Scholar]
- 18.Bosio CM, Aman MJ, Grogan C, Hogan R, Ruthel G, Negley D, Mohamadzadeh M, Bavari S, Schmaljohn A. 2003. Ebola and Marburg viruses replicate in monocyte-derived dendritic cells without inducing the production of cytokines and full maturation. J Infect Dis 188:1630–1638. doi: 10.1086/379199. [DOI] [PubMed] [Google Scholar]
- 19.Feldmann H, Klenk HD. 1996. Marburg and Ebola viruses. Adv Virus Res 47:1–52. doi: 10.1016/S0065-3527(08)60733-2. [DOI] [PubMed] [Google Scholar]
- 20.Schnittler HJ, Mahner F, Drenckhahn D, Klenk HD, Feldmann H. 1993. Replication of Marburg virus in human endothelial cells. A possible mechanism for the development of viral hemorrhagic disease. J Clin Invest 91:1301–1309. [DOI] [PMC free article] [PubMed] [Google Scholar]
- 21.Ströher U, West E, Bugany H, Klenk HD, Schnittler HJ, Feldmann H. 2001. Infection and activation of monocytes by Marburg and Ebola viruses. J Virol 75:11025–11033. doi: 10.1128/JVI.75.22.11025-11033.2001. [DOI] [PMC free article] [PubMed] [Google Scholar]
- 22.Wong G, Qiu X, Richardson JS, Cutts T, Collignon B, Gren J, Aviles J, Embury-Hyatt C, Kobinger GP. 2015. Ebola virus transmission in guinea pigs. J Virol 89:1314–1323. doi: 10.1128/JVI.02836-14. [DOI] [PMC free article] [PubMed] [Google Scholar]
- 23.Lin KL, Twenhafel NA, Connor JH, Cashman KA, Shamblin JD, Donnelly GC, Esham HL, Wlazlowski CB, Johnson JC, Honko AN, Botto MA, Yen J, Hensley LE, Goff AJ. 2015. Temporal characterization of Marburg virus Angola infection following aerosol challenge in rhesus macaques. J Virol 89:9875–9885. doi: 10.1128/JVI.01147-15. [DOI] [PMC free article] [PubMed] [Google Scholar]
- 24.National Research Council. 2011. Guide for the care and use of laboratory animals, 8th ed National Academies Press, Washington, DC. [Google Scholar]
- 25.Yen JY, Garamszegi S, Geisbert JB, Rubins KH, Geisbert TW, Honko A, Xia Y, Connor JH, Hensley LE. 2011. Therapeutics of Ebola hemorrhagic fever: whole-genome transcriptional analysis of successful disease mitigation. J Infect Dis 204(Suppl 3):S1043–S1052. doi: 10.1093/infdis/jir345. [DOI] [PubMed] [Google Scholar]
- 26.Malhotra S, Yen JY, Honko AN, Garamszegi S, Caballero IS, Johnson JC, Mucker EM, Trefry JC, Hensley LE, Connor JH. 2013. Transcriptional profiling of the circulating immune response to lassa virus in an aerosol model of exposure. PLoS Negl Trop Dis 7:e2171. doi: 10.1371/journal.pntd.0002171. [DOI] [PMC free article] [PubMed] [Google Scholar]
- 27.Caballero IS, Yen JY, Hensley LE, Honko AN, Goff AJ, Connor JH. 2014. Lassa and Marburg viruses elicit distinct host transcriptional responses early after infection. BMC Genomics 15:960. doi: 10.1186/1471-2164-15-960. [DOI] [PMC free article] [PubMed] [Google Scholar]
- 28.Kash JC, Muhlberger E, Carter V, Grosch M, Perwitasari O, Proll SC, Thomas MJ, Weber F, Klenk HD, Katze MG. 2006. Global suppression of the host antiviral response by Ebola- and Marburgviruses: increased antagonism of the type I interferon response is associated with enhanced virulence. J Virol 80:3009–3020. doi: 10.1128/JVI.80.6.3009-3020.2006. [DOI] [PMC free article] [PubMed] [Google Scholar]
- 29.Rubins KH, Hensley LE, Wahl-Jensen V, Daddario DiCaprio KM, Young HA, Reed DS, Jahrling PB, Brown PO, Relman DA, Geisbert TW. 2007. The temporal program of peripheral blood gene expression in the response of nonhuman primates to Ebola hemorrhagic fever. Genome Biol 8:R174. doi: 10.1186/gb-2007-8-8-r174. [DOI] [PMC free article] [PubMed] [Google Scholar]
- 30.Wahl-Jensen V, Kurz S, Feldmann F, Buehler LK, Kindrachuk J, DeFilippis V, da Silva Correia J, Fruh K, Kuhn JH, Burton DR, Feldmann H. 2011. Ebola virion attachment and entry into human macrophages profoundly effects early cellular gene expression. PLoS Negl Trop Dis 5:e1359. doi: 10.1371/journal.pntd.0001359. [DOI] [PMC free article] [PubMed] [Google Scholar]
- 31.Cloutier A, Guindi C, Larivee P, Dubois CM, Amrani A, McDonald PP. 2009. Inflammatory cytokine production by human neutrophils involves C/EBP transcription factors. J Immunol 182:563–571. doi: 10.4049/jimmunol.182.1.563. [DOI] [PubMed] [Google Scholar]
- 32.Pachot A, Cazalis MA, Venet F, Turrel F, Faudot C, Voirin N, Diasparra J, Bourgoin N, Poitevin F, Mougin B, Lepape A, Monneret G. 2008. Decreased expression of the fractalkine receptor CX3CR1 on circulating monocytes as new feature of sepsis-induced immunosuppression. J Immunol 180:6421–6429. doi: 10.4049/jimmunol.180.9.6421. [DOI] [PubMed] [Google Scholar]
- 33.Zaas AK, Chen M, Varkey J, Veldman T, Hero AO III, Lucas J, Huang Y, Turner R, Gilbert A, Lambkin-Williams R, Oien NC, Nicholson B, Kingsmore S, Carin L, Woods CW, Ginsburg GS. 2009. Gene expression signatures diagnose influenza and other symptomatic respiratory viral infections in humans. Cell Host Microbe 6:207–217. doi: 10.1016/j.chom.2009.07.006. [DOI] [PMC free article] [PubMed] [Google Scholar]
- 34.Huang Y, Zaas AK, Rao A, Dobigeon N, Woolf PJ, Veldman T, Oien NC, McClain MT, Varkey JB, Nicholson B, Carin L, Kingsmore S, Woods CW, Ginsburg GS, Hero AO III. 2011. Temporal dynamics of host molecular responses differentiate symptomatic and asymptomatic influenza a infection. PLoS Genet 7:e1002234. doi: 10.1371/journal.pgen.1002234. [DOI] [PMC free article] [PubMed] [Google Scholar]
- 35.Waddell SJ, Popper SJ, Rubins KH, Griffiths MJ, Brown PO, Levin M, Relman DA. 2010. Dissecting interferon-induced transcriptional programs in human peripheral blood cells. PLoS One 5:e9753. doi: 10.1371/journal.pone.0009753. [DOI] [PMC free article] [PubMed] [Google Scholar]
- 36.Basler CF, Amarasinghe GK. 2009. Evasion of interferon responses by Ebola and Marburg viruses. J Interferon Cytokine Res 29:511–520. doi: 10.1089/jir.2009.0076. [DOI] [PMC free article] [PubMed] [Google Scholar]
- 37.Smith LM, Hensley LE, Geisbert TW, Johnson J, Stossel A, Honko A, Yen JY, Geisbert J, Paragas J, Fritz E, Olinger G, Young HA, Rubins KH, Karp CL. 2013. Interferon-beta therapy prolongs survival in rhesus macaque models of Ebola and Marburg hemorrhagic fever. J Infect Dis 208:310–318. doi: 10.1093/infdis/jis921. [DOI] [PMC free article] [PubMed] [Google Scholar]
- 38.Thi EP, Mire CE, Ursic-Bedoya R, Geisbert JB, Lee AC, Agans KN, Robbins M, Deer DJ, Fenton KA, MacLachlan I, Geisbert TW. 2014. Marburg virus infection in nonhuman primates: therapeutic treatment by lipid-encapsulated siRNA. Sci Transl Med 6:250ra116. doi: 10.1126/scitranslmed.3009706. [DOI] [PMC free article] [PubMed] [Google Scholar]
- 39.Pachot A, Lepape A, Vey S, Bienvenu J, Mougin B, Monneret G. 2006. Systemic transcriptional analysis in survivor and non-survivor septic shock patients: a preliminary study. Immunol Lett 106:63–71. doi: 10.1016/j.imlet.2006.04.010. [DOI] [PubMed] [Google Scholar]
- 40.Baas T, Baskin CR, Diamond DL, Garcia-Sastre A, Bielefeldt-Ohmann H, Tumpey TM, Thomas MJ, Carter VS, Teal TH, Van Hoeven N, Proll S, Jacobs JM, Caldwell ZR, Gritsenko MA, Hukkanen RR, Camp DG II, Smith RD, Katze MG. 2006. Integrated molecular signature of disease: analysis of influenza virus-infected macaques through functional genomics and proteomics. J Virol 80:10813–10828. doi: 10.1128/JVI.00851-06. [DOI] [PMC free article] [PubMed] [Google Scholar]
- 41.Woods CW, McClain MT, Chen M, Zaas AK, Nicholson BP, Varkey J, Veldman T, Kingsmore SF, Huang Y, Lambkin-Williams R, Gilbert AG, Hero AO III, Ramsburg E, Glickman S, Lucas JE, Carin L, Ginsburg GS. 2013. A host transcriptional signature for presymptomatic detection of infection in humans exposed to influenza H1N1 or H3N2. PLoS One 8:e52198. doi: 10.1371/journal.pone.0052198. [DOI] [PMC free article] [PubMed] [Google Scholar]
Associated Data
This section collects any data citations, data availability statements, or supplementary materials included in this article.