Abstract
Background and Aims Reactive oxygen species (ROS), especially hydrogen peroxide, play a critical role in the regulation of plant development and in the induction of plant defence responses during stress adaptation, as well as in plant cell death. The antioxidant system is responsible for controlling ROS levels in these processes but redox homeostasis is also a key factor in plant cell metabolism under normal and stress situations. Thioredoxins (Trxs) are ubiquitous small proteins found in different cell compartments, including mitochondria and nuclei (Trxo1), and are involved in the regulation of target proteins through reduction of disulphide bonds, although their role under oxidative stress has been less well studied. This study describes over-expression of a Trxo1 for the first time, using a cell-culture model subjected to an oxidative treatment provoked by H2O2.
Methods Control and over-expressing PsTrxo1 tobacco (Nicotiana tabacum) BY-2 cells were treated with 35 mm H2O2 and the effects were analysed by studying the growth dynamics of the cultures together with oxidative stress parameters, as well as several components of the antioxidant systems involved in the metabolism of H2O2. Analysis of different hallmarks of programmed cell death was also carried out.
Key Results Over-expression of PsTrxo1 caused significant differences in the response of TBY-2 cells to high concentrations of H2O2, namely higher and maintained viability in over-expressing cells, whilst the control line presented a severe decrease in viability and marked indications of oxidative stress, with generalized cell death after 3 d of treatment. In over-expressing cells, an increase in catalase activity, decreases in H2O2 and nitric oxide contents and maintenance of the glutathione redox state were observed.
Conclusions A decreased content of endogenous H2O2 may be responsible in part for the delayed cell death found in over-expressing cells, in which changes in oxidative parameters and antioxidants were less extended after the oxidative treatment. It is concluded that PsTrxo1 transformation protects TBY-2 cells from exogenous H2O2, thus increasing their viability via a process in which not only antioxidants but also Trxo1 seem to be involved.
Keywords: Ascorbate, cell death, cell viability, glutathione, hydrogen peroxide, Nicotiana tabacum, over-expression, oxidative stress, reactive oxygen species, TBY-2 cells, thioredoxin o, tobacco
INTRODUCTION
Reactive oxygen species (ROS) are continuously produced in the cell as a result of aerobic metabolism, but production increases under biotic and abiotic stress conditions, provoking oxidative stress and activating diverse responses in the plant that are necessary to cope with the situation (Taylor et al., 2009; Martí et al., 2011, 2013). Activation of the antioxidant systems in the cell is one of the mechanisms involved in this response, and plant cells contain a set of non-enzymatic and enzymatic reaction systems responsible for the control of suitable levels of ROS, including the components of the so-called ascorbate–glutathione (ASC–GSH) cycle (Hernández et al., 2000; Caretto et al., 2002; Martí et al., 2009; Lázaro et al., 2013). On the other hand, ROS are also necessary for normal metabolism and are now being considered as second messengers in cellular signal transduction (De Gara et al., 2010; Mullineaux and Baker, 2010; Mittler et al., 2011). Among them, H2O2 has been implicated in the regulation of plant development, the cell cycle and the induction of plant defence responses during stress adaptation, as well as in plant cell death (Dat et al., 2003; Apel and Hirt, 2004; Locato et al., 2008; Díaz-Vivancos et al., 2010; Hakmaoui et al., 2012; Sgobba et al., 2014).
Programmed cell death (PCD) is a highly regulated physiological process that leads to selective elimination of damaged cells. It also plays a key role in plant development and responses to environmental changes (van Doorn and Woltering, 2005; Paradiso et al., 2012; Monetti et al., 2014). In plants, there is not just one type of PCD; there are different regulators and modes of death (Reape et al., 2008). An apoptotic-like PCD (AL-PCD) is described with different morphological features from autophagy and necrosis. Condensation of the protoplast away from the cell wall and DNA cleavage into multimers of around 180 kDa fragments are typical features of AL-PCD but not of necrosis (Burbridge et al., 2007). DNA fragmentation appears as a smear on agarose gels (McCabe et al., 1997) and seems to occur later than complete DNA degradation. Production of H2O2 is considered to be a key event during the action of different stress factors; production increases early in this process of PCD (Locato et al., 2008) and different concentrations of exogenous H2O2 induce cell death (Houot et al., 2001; de Pinto et al., 2006). In this process, the control of H2O2 by the defence system, including the enzymes ascorbate peroxidase (APX) and catalase, has been demonstrated to play a key role (Murgia et al., 2004; Locato et al., 2008, 2009; de Pinto et al., 2013).
Thioredoxins (Trxs) are ubiquitous small proteins located in different cell compartments. They are involved in the regulation of target proteins through reduction of disulphide bonds. This is a key factor in maintaining protein dithiol/disulphide homeostasis (Balmer et al., 2004; Martí et al., 2009; Meyer et al., 2012; Lázaro et al., 2013). The presence of Trxs in plant mitochondria has been shown in arabidopsis and more recently in pea, being classified as the Trxo type (Laloi et al., 2001; Martí et al., 2009). Pea Trxo1 has been located in both mitochondria and nucleus under normal conditions (Martí et al., 2009), while a nuclear Trxh has been found only under oxidative conditions in germinating wheat seeds (Serrato et al., 2001; Serrato and Cejudo, 2003; Pulido et al., 2009). Extensive work has revealed diverse aspects of Trxs in plants, but very little is known about mitochondrial Trxo1 function, although it has been related to redox regulation of proteins, including the respiratory component alternative oxidase (AOX) (Balmer et al., 2004; Gelhaye et al., 2004; Martí et al., 2009; Yoshida et al., 2013), and to the detoxification of ROS via mitochondrial peroxiredoxin (Prx) IIF (Barranco-Medina et al., 2008). Information about the involvement of this Trxo1 in the response to abiotic stress is quite scarce, and recent studies have shown its role under salinity (Martí et al., 2011). In mammalian cells, Trx is also involved in the progression of cell death, depending on its redox state, preventing apoptosis as reduced Trx when it binds to apoptosis signal-regulating kinase 1 (ASK1), or inducing it in the oxidized form, in which it is dissociated from the kinase (Lu and Holmgren, 2012). However, in plant PCD the involvement of redox proteins such as Trxs or Prxs is unknown. In this work, H2O2 was used as an inducer of oxidative stress and PCD in tobacco (Nicotiana tabacum) Bright Yellow-2 (TBY-2) cells that were transformed with PsTrxo1. Then, we investigated the effect of this treatment by studying the viability and growth of the cells as well as oxidative stress parameters, such as lipid peroxidation and protein carbonylation, and also the antioxidant status, measuring both the ASC and GSH redox state and H2O2 scavenger enzymes. Different hallmarks of PCD were also analysed in a non-over-expressing and a Trxo1-over-expressing line of TBY-2 cells in an attempt to analyse the effect of the over-expression of this Trx in the response to H2O2 as an inducer of cell death.
MATERIALS AND METHODS
Transformation of tobacco BY-2 cells
The complete cDNA encoding pea PsTrxo1, including the original targeting peptide for mitochondria (Martí et al., 2009), was amplified by PCR. The product was ligated into the entry vector pDONR ZEO (Invitrogen) and recombined with the destination vector pK7WG2D (Karimi et al., 2002), provided by Flanders Interuniversity Institute for Biotechnology (VIB), Gent University, using the Gateway site-specific recombinational cloning technology (Invitrogen). The construct contains the CaMV 35 S promoter and also harbours a constitutively expressed GFP gene targeted to the endoplasmic reticulum to facilitate the identification of transgenic calli. The plant expression vectors were introduced into Agrobacterium tumefaciens strain GV3101 (pMP90RK, GmR; KmR), RifR as described in Schinkel et al. (2005), using a Gene Pulser II electroporation system (Bio-Rad, Hercules, CA, USA) according to the manufacturer’s instructions. Stably transformed Nicotiana tabacum ‘Bright Yellow-2’ (TBY-2) suspension cells were generated by co-culture with recombinant A. tumefaciens. Transgenic TBY-2 cells were selected on kanamycin (100 mg L–1) containing Murashige and Skoog (MS) medium (Murashige and Skoog, 1962) agar plates. Transgenic callus tissue was used to initiate suspension cultures. The TBY-2 suspension cells were maintained in MS medium supplemented with minimal organics [0·47 % (w/v) MS salts, 0·15 mg mL–1 thiamine, 0·02 mg mL–1 KH2PO4 and 3 % (w/v) sucrose, pH 5·8] in an orbital shaker at 180 rpm and 26 °C in the dark. Cultures were subcultured every week with a 5 % (v/v) inoculum. Transgenic TBY-2 calli were tested for the presence of recombinant PsTrxo1 by immunoblot and those with the highest levels of expression were used to establish cell suspension cultures (referred to here as Trxo1 lines and/or over-expressing lines). The cultures were also checked for the presence of the GFP by fluorescence microscopy and the presence of Trxo1 protein by western blot, using a PsTrxo1 antibody as described in Martí et al. (2009). A GFP line was also produced in which GFP, but not Trxo1, was present in the transformation vector and used as control cells to be compared with the over-expressing PsTrxo1 cells.
Cell culture, growth conditions and H2O2 treatment
The TBY-2 cells were routinely propagated in MS medium supplemented with minimal organics as described above, plus 100 mg L–1 myoinositol and 0·2 mg L–1 2,4-dichlorophenoxyacetic acid. The medium was adjusted to pH 5·8 and sterilized by autoclaving at 121 °C for 15 min prior to use. The cells were subcultured to fresh culture medium at weekly intervals and were incubated on a rotary shaker at 130 rpm at 26 °C in darkness.
At the end of the normal 7-day growth period, a 4-mL aliquot of stationary phase cells was transferred to 100 mL of fresh medium and every day an aliquot of cells was taken for analysis.
Cells in the exponential growth phase were exposed to H2O2 at final concentrations of 15 and 35 mm. At the indicated time points, cell aliquots were collected for analysis either by filtration on Whatman 3 M paper or by centrifugation at 10 000g for 10 min at 25 °C.
Preparation of cell homogenate and subcellular fractions
Mitochondrial, nuclear and cytosolic fractions were isolated from lysed protoplasts essentially as described in de Pinto et al. (2000) but with some modifications. Briefly, TBY-2 cells (10–20 g) were washed with the preplasmolysis buffer consisting of 0·4 m mannitol and 25 mm Tris–MES (2-(N-morpholino)ethanesulfonic acid), pH 5·5. The cells were then incubated with 0·25 % (w/v) cellulase (Duchefa), 0·05 % (w/v) pectolyase (Sigma) and 0·1 % (w/v) pectinase (Sigma) in the same medium. Digestion of the cell wall proceeded for 2 h in the dark at 30 °C. The protoplasts were sedimented at 110 g for 5 min at 25 °C and washed twice with preplasmolysis buffer adjusted to pH 6·5. The protoplasts were then suspended in ice-cold lysis buffer (3 mL g–1 of cells) consisting of 0·4 mm mannitol, 20 mm Tris–HCl, 0·5 mm EDTA, 4 mm cysteine, protease inhibitors 1× (cOmplete, Roche, Germany) and 0·1 % (w/v) bovine serum albumin (BSA), and lysed on ice with a Potter homogenizer (19·5 × 2 cm). An enriched nuclear fraction was obtained by centrifuging the cell homogenate at 1500 g for 5 min at 4 °C. The supernatant was then centrifuged at 15 000g for 15 min at 4 °C to sediment the mitochondria, and the supernatant was centrifuged again at 82 000g for 20 min at 4 °C in order to obtain the cytosolic fraction.
Immunoblot analysis
Western blot analysis was performed on the different fractions as described in Vacca et al. (2006) using the antibody against PsTrxo1 and PsPrxIIF as described in Martí et al. (2009). Colorimetric detection was performed using alkaline phosphatase and NBT/BCIP reagent (Roche, Mannheim, Germany).
Cell viability and nuclear morphology
Cell viability was calculated as the percentage of cells that did not stain with trypan blue. An aliquot of cell suspension was transferred into a test tube with 50 % (v/v) trypan blue solution. After 5–10 min, the trypan blue cell suspension mixture was transferred to a microscope slide and viable (unstained) and non-viable (blue-stained) cells were counted. For each sample 1000 cells were scored.
For the analysis of nuclear morphology, TBY-2 cells were stained with 4,6-diamidino-2-phenylindole (DAPI), as described by de Pinto et al. (2002), and visualized using a fluorescence microscope (DMLS, Leica, Wetzlar, Germany) with an excitation filter of 340 nm and a barrier filter of 400 nm.
DNA fragmentation analysis
Total genomic DNA was isolated from the control and treated frozen cells (0·3 g), mechanically disrupted with a mortar and pestle in the presence of liquid nitrogen and solubilized in extraction buffer (1 m Tris–HCl pH 8, 0·5 m EDTA, 5 m NaCl). The cellular mixture was lysed at 65 °C for 10 min. After lysis, proteins and polysaccharides were salt-precipitated with 5 m potassium acetate and removed by centrifugation at 13 000g for 15 min at room temperature. Nucleic acids were precipitated with 100 % isopropyl alcohol and 3 m sodium acetate for 20 min on ice and recovered by centrifugation at 13 000g for 3 min at room temperature. The pellet was washed twice with 70 % cold ethanol. Clean DNA was resuspended in sterile water. The sample was then incubated with RNase H for 1 h at 37 °C in order to digest RNA.
Electrophoresis was carried out on 1 % (w/v) agarose gel with TAE (Tris base, acetic acid and EDTA) buffer. Six micrograms of DNA in Orange G loading buffer [6 % (v/v) glycerol, 0·05 % (v/v) bromophenol blue, 12 mm EDTA pH 8, 0·4 % (w/v) orange G] was transferred to each gel well in order to detect DNA fragmentation.
Measurement of H2O2 and nitric oxide
The H2O2 content was measured in the cellular extract using the eFox method (Bellincampi et al., 2000). Briefly, 1 mL of cell culture was harvested by centrifugation at 10 000g for 20 s at 25 °C and the H2O2 concentration was measured in the supernatant and pellet. The pellet was homogenized with acid acetone (v/v) and then frozen in liquid nitrogen and unfrozen. Finally, the cell mixture was centrifuged at 10 000g for 10 min at 4 °C, and an aliquot of supernatant (100 μL) was used as the pellet fraction. An aliquot of pellet was added to 500 μL of assay reagent (250 μm ferrous ammonium sulphate, 25 mm H2SO4, 100 μm xylenol orange, 100 mm sorbitol). After 45 min of incubation, peroxide-mediated oxidation of Fe2+ to Fe3+ was determined by measuring the absorbance at 560 nm of the Fe3+–xylenol orange complex.
Nitric oxide (NO) was measured with 4,5-diaminoflorescein diacetate (DAF2). Briefly, 2 mL of cells was centrifuged at 10 000g for 20 min. The cell pellet was broken in liquid nitrogen and resuspended in 50 mm HEPES buffer pH 7·5 (1:2 w/v). The cell mixture (50 μL) was diluted in 950 μL of 50 mm HEPES buffer and incubated with 0·005 μm of DAF2 for 1 h at 37 °C. Fluorescence intensity was measured using a Shimadzu RF-1501 luminescence spectrophotometer at 495 nm excitation and 515 nm emission (Locato et al., 2008).
Lipid peroxidation and protein oxidation measurements
The level of lipid peroxidation in the cells was measured in terms of malondialdehyde (MDA) content determined by the thiobarbituric acid reaction as described by Zhang and Kirkham (1996). The cells (0·3 g) were homogenized in 0·1 m potassium phosphate buffer pH 7 (1:2 w/v), 0·1 % (w/v) protease inhibitors (cOmplete) and 0·005 % (w/v) cysteine. The homogenate was centrifuged at 10 000g for 10 min and 200 μL of supernatant was collected to react with 1 mL of acid solution containing 15 % (w/v) trichloroacetic acid (TCA), 0·375 % (w/v) thiobarbituric acid, 0·010 % (w/v) butylated hydroxytoluene and 0·77 % (v/v) hydrochloric acid. The mixture was heated at 95 °C for 30 min and cooled in an ice bath, after which it was centrifuged at 3000 g for 10 min. The absorbance of the supernatant was read at 535 nm. The concentration of MDA was calculated using a calibration curve.
Protein oxidation was measured as carbonyl content in oxidatively modified proteins as described by Levine et al. (1990). Briefly, 0·3 g of cells were disrupted with liquid nitrogen and resuspended in a buffer containing 0·1 m potassium phosphate buffer, pH 7, plus 0·1 % (w/v) protease inhibitors (cOmplete) and 0·005 % (w/v) cysteine. The cell homogenate was centrifuged at 15 000g for 15 min at 4 °C and 400 μL of supernatant was recovered. Because DNA can cause interference with the measurement, we precipitated it with streptomycin sulphate 1:10 (v/v) and removed it by centrifugation at 12 000g for 10 min. Two hundred microlitres of supernatant of each sample was incubated with 20 mm 2,4-dinitrophenylhydrazine (DNPH) in 2 m HCl (1:2, v/v), which reacts with carbonyl groups. A parallel incubation with HCl without DNPH was used as a blank for each sample. Incubation was for 1 h at room temperature. Carbonyl proteins were precipitated with 20 % (w/v) TCA and rinsed three times with ethanol:ethylacetate (1:1, v/v). The final pellet was resuspended in 6 m guanidine hydrochloride and incubated for 15 min at 37 °C. Absorbance was measured at 360 nm (ε = 22 000 m–1 cm–1)
Ascorbate and glutathione measurements
Cells (0·3 g) were collected by filtration on Whatman 3MM paper and homogenized with 2 volumes of cold 5 % (w/v) metaphosphoric acid at 4 °C using a vortexer. The homogenate was centrifuged at 20 000g for 15 min at 4 °C and the supernatant was collected for analysis. The ASC and GSH contents were measured by HPLC–electrospray ionization (ESI)/MS trap analysis using an Agilent 1100 Series HPLC (Agilent Technologies, Santa Clara, CA) equipped with a thermostatized μ-well plate autosampler and a capillary pump, and connected to an Agilent Ion Trap XCT Plus Mass Spectrometer (Agilent Technologies) using an ESI interface as described in Martí et al. (2013).
Antioxidant enzymatic activities
Cells were ground in liquid N2 and homogenized at 4 °C in extraction buffer [50 mm Tris–HCl pH 7·8, 0·05 % (w/v) cysteine, 0·1 % (w/v) BSA]. The homogenate was centrifuged at 13 000g for 15 min at 4 °C and the supernatant was used for spectrophotometric analysis.
The activity of APX (l-ascorbate:hydrogen peroxide oxidoreductase, EC 1.11.1.11) was tested as described in Jiménez et al. (1997), by following the H2O2-dependent oxidation of ASC as decreasing absorbance at 290 nm (ε = 2·7 mm–1 cm–1).
Catalase (EC 1.11.1.6) activity was determined according to Aebi (1984) by measuring the decrease in A240 due to the disappearance of H2O2 (ε = 39·6 m–1 cm–1).
Protein measurement was performed according to Bradford (1976) using BSA as standard.
Statistical analysis
Each experiment was performed at least two times with three replicates per treatment. Values presented are mean ± s.e. When analysis of variance (ANOVA) showed significant effects, Tukey’s post hoc test was applied using SPSS software (IBM® SPSS® Statistics 19). Genotype and time were considered the main factors in non-treated conditions, at P < 0·05 (different lower case letters). Treatment with H2O2 was considered as the main factor when comparing with control conditions for each line.
RESULTS
Trxo1 is over-expressed in TBY-2 cells
The molecular function of the plant Trxo1 gene was investigated using the transgenic TBY-2 system. PsTrxo1 was placed under the control of the CaMV 35 S promoter and inserted in TBY-2 cells by A. tumefaciens-mediated transformation. About 100 primary transgenic BY-2 clones were generated and screened using GFP fluorescence as a scorable marker. Ten microcalli exhibiting high fluorescence were selected, expanded and screened for production of PsTrxo1 using ananti-PsTrxo1 antibody reactivity. Two clones (PsTrxo1-1 and PsTrxo1-2, Fig. 1A–D) with the highest PsTrxo1 protein accumulation (data not shown) were used to establish suspension cultures, which were tested again for anti-PsTrxo1 reactivity. Fluorescence staining for GFP was consistent with the described endoplasmic reticulum location of the protein (Karimi et al., 2002). Western blot analysis of protein extracts from control GFP line cell culture and transformed Trxo1-1 and Trxo1-2 lines revealed a major band with a molecular mass around 15 kDa, which was visualized only in the over-expressing lines (Fig. 1E). Consistent with previous reports, PsTrxo1 was efficiently targeted to mitochondria and nuclei, with no detectable cytosolic background staining (Fig. 1F), as shown by western blot analysis of mitochondrial, nuclear and cytoplasmic fractions from the control GFP (with no signal in these fractions; data not shown) and PsTrxo1 over-expressing cell cultures, using recombinant PsTrxo1 protein as positive control.
Fig. 1.
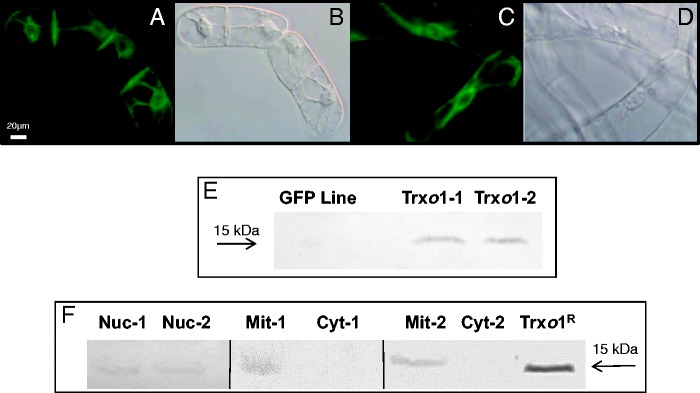
GFP visualization by fluorescence microscopy and phase contrast imaging in two lines of transformed TBY-2 cells: (A, B) Trxo1-1; (C, D) Trxo1-2. Scale bar = 20 µm. (E) Western blot analysis of cell extracts from GFP and PsTrxo1 lines of TBY-2 cells using 50 µg of soluble proteins separated by denaturing electrophoresis on a 12 % (w/v) polyacrylamide gel and hybridized with a rabbit anti-PsTrxo1 antibody in cell extracts of GFP and PsTrxo1 lines of TBY-2 cells. (F) Western blot analysis of 30 μg of soluble proteins from nuclear (Nuc), mitochondrial (Mit) and cytoplasmic (Cyt) fractions of two lines of Trxo1-over-expressing cells. PsTrxo1 recombinant protein was used as positive control. The molecular mass standard is shown on the right (kDa). The loading control of the blot in (F) using Ponceau staining is presented as Supplementary Data Fig. S1.
Effect of Trxo1 over-expression on cell growth
Growth kinetics were analysed by measuring the optical density (OD) of the cultures at 600 nm. The growth of the GFP cells and Trxo1-over-expressing cells (lines 1 and 2) was parallel, reaching a peak at day 7 of growth (Fig. 2).
Fig. 2.
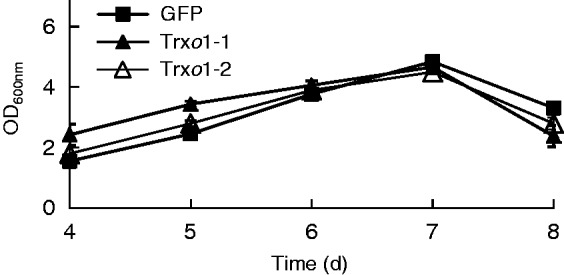
Optical density of cultures of GFP and Trxo1 lines 1 and 2 of TBY-2 cells. Values represent mean ± s.e. of ten experiments.
Effect of H2O2 on viability of cultured tobacco BY-2 cells
Tobacco BY-2 cells in the exponential phase were exposed to exogenous 15 and 35 mm H2O2. Cell viability was evaluated for different times in the following 72 h in the GFP line (Fig. 3A) and Trxo1-over-expressing lines 1 and 2 (Fig. 3B). Larger differences were found between GFP and over-expressing lines in the 35 mm than in the 15 mm treatment (data not shown), so we chose 35 mm for further assays. A decrease in viability occurred in all lines but was much higher in the GFP line than in the Trxo1 lines: 35 mm H2O2 provoked a decrease in viability of the GFP line of 43 % after 2 h, while in the over-expressing lines, interestingly, the decrease was only around 18 %. Subsequently, in the GFP line viability decreased progressively until becoming negligible at 72 h, while the Trxo1 lines maintained quite high viability (around 60 %) at this time.
Fig. 3.
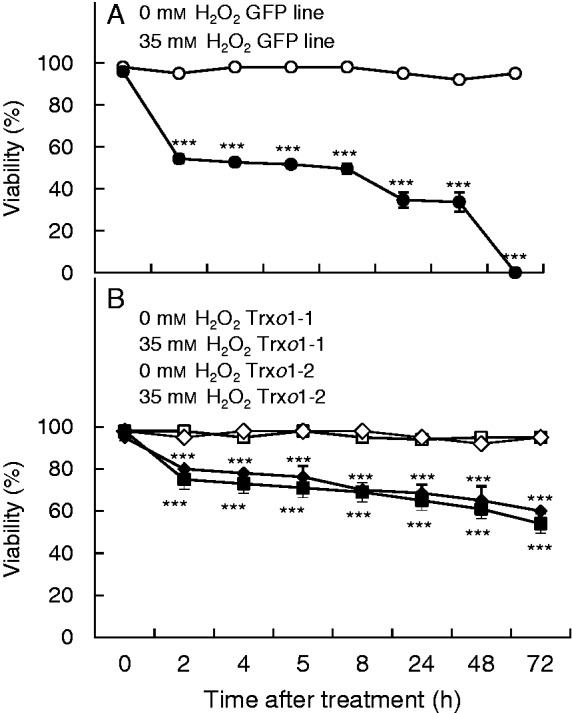
Effect of 35 mm H2O2 on cell viability of (A) GFP and (B) Trxo1 lines 1 and 2 of TBY-2 cells. H2O2 was added at day 5 of growth and cell viability was analysed over time. Values represent mean ± s.e. of ten experiments. ***Difference between non-treated and H2O2-treated sample of each line was significant at the 0·1 % level.
The over-expressing line Trxo1-1 was chosen for the following assays, in which it was compared with the GFP line as a control line.
Cytological markers in tobacco BY-2 cells treated with H2O2
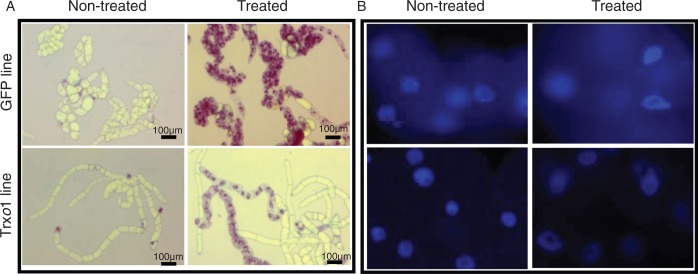
In order to verify whether the over-expression of Trxo1 altered the capability of TBY-2 cells to activate AL-PCD, some cytological markers were analysed after the H2O2 treatment of the GFP and Trxo1-1 lines (called the Trxo1 line from now on). The AL-PCD markers appeared in both lines in dead cells. Cell shrinkage, a hallmark of AL-PCD, was patent in both lines after 72 h in a high percentage of dead cells (Fig. 4A), although this marker was more evident in the Trxo1 cells. Staining with DAPI also showed the presence of apoptotic-like nuclei only in cells treated with 35 mm H2O2 (Fig. 4B) and not in non-treated cells of either line. The genomic DNA integrity of the cells was also examined. Analysis of DNA fragmentation revealed that in control non-treated cells DNA appeared as a single high-molecular weight band of >10 000 bp (Fig. 5). Treatment of the cells with 35 mm H2O2 provoked a different pattern of DNA oligonucleosomal fragment accumulation in the two lines as the cells died. At 72 h in the GFP line, a large band of DNA of low molecular weight appeared, probably because cell death was much more rapid, while in the Trxo1 line DNA laddering, consistent with internucleosomal fragments (∼180 bp multimers), was clearly present at 72 h of treatment.
Fig. 4.
Cytoplasm shrinkage (A) and nuclear morphology (B) induced by 35 mm H2O2 in GFP and Trxo1 lines of tobacco BY-2 cells after 72 h of treatment. Cells were stained with trypan blue (A) or DAPI (B). Scale bars = 100 µm.
Fig. 5.
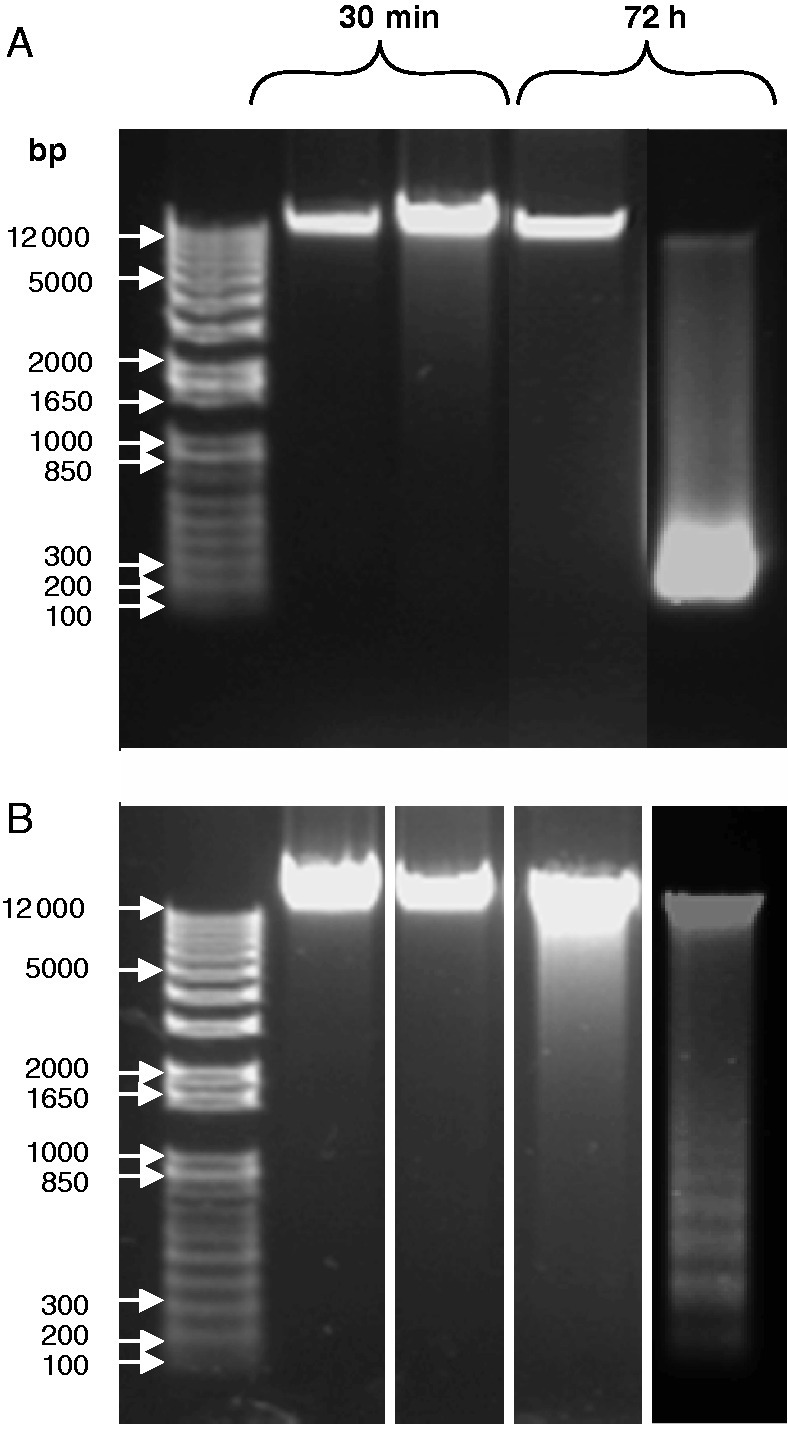
Analysis of DNA fragmentation. DNA was extracted from (A) the GFP line and (B) the Trxo1 line of tobacco BY-2 cells, non-treated (NT) and treated (T) with 35 mm H2O2 and collected after 30 min and 72 h of treatment. A representative electrophoretic run in which 100 μg DNA was loaded for each cell line is presented, and a size standard is shown on the left (bp).
Oxidative and nitrosative stress markers
To analyse the oxidative stress induced by H2O2 treatment, levels of both lipid peroxidation and protein oxidation, as well as H2O2 content, were measured in TBY-2 cells of the GFP and Trxo1 lines. No differences were found in these parameters between non-treated cells of the two lines except at 48 h, when the Trxo1 over-expressing line presented higher lipid peroxidation and H2O2 content (Fig. 6A–C). The effect of the H2O2 treatment revealed that, not only in the GFP line but also in the Trxo1 line, levels of lipid peroxidation as well as protein oxidation increased over time, although these differences disappeared in protein oxidation at 48 h (Fig. 6A, B). As regards H2O2 analysis, the oxidative treatment led to a significant increase in the GFP line. In contrast, the over-expressing line kept a similar content in both treated and non-treated cells, except at 4 h, when a relative increase in H2O2 was observed in the treated cells.
Fig. 6.
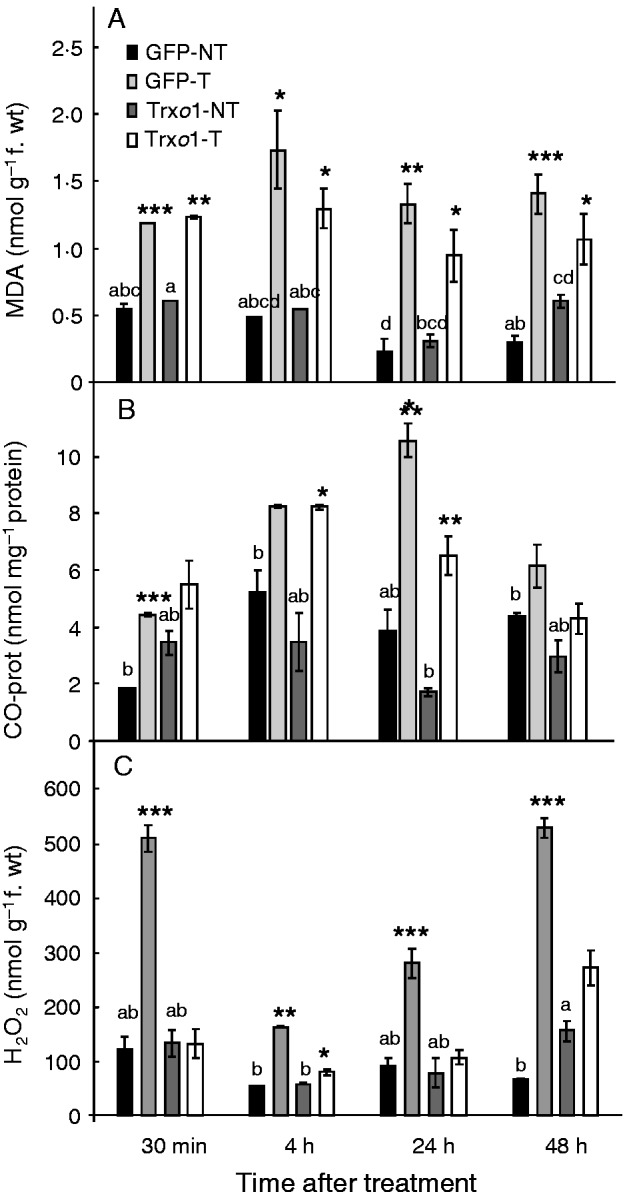
Changes over time in (A) lipid peroxidation measured as MDA content, (B) carbonyl (CO) proteins and (C) H2O2 in GFP and Trxo1 lines of tobacco BY-2 cells, non-treated (NT) and treated (T) with 35 mm H2O2. Values represent mean ± s.e. of five experiments. Means for each non-treated sample that do not a have common letter are significantly different by Tukey’s test at P < 0·05. *, **, *** indicate differences between non-treated and H2O2-treated sample that are significant at the 5, 1 and 0·1 % level, respectively.
In addition, the NO content was measured in the cellular extract of the control GFP and over-expressing cells after the 35 mm H2O2 treatment. In non-treated cells, the NO level in the over-expressing line was always significantly higher than in the GFP line, except at 30 min (Fig. 7A). After treatment, differences between treated and non-treated lines were higher in the GFP line than in the over-expressing line over time. The S-nitrosoglutathione (GSNO) content of the cells was also analysed, and although no significant differences were found between non-treated lines (except at 48 h), significant differences were found at relatively short periods of time after the oxidative treatment (30 min and 4 h) between non-treated and treated cells. The amount of GSNO was around 35-fold higher in treated than in non-treated cells at 30 min in both lines. However, this difference decreased by a half and a quarter in the GFP line and the over-expressing line, respectively, at 4 h, and showed a further, dramatic decrease at 24 and 48 h. At this time slot no differences were found in both lines, and GSNO was lower in treated than non-treated cells only in the GFP line at 48 h (Fig. 7B).
Fig. 7.
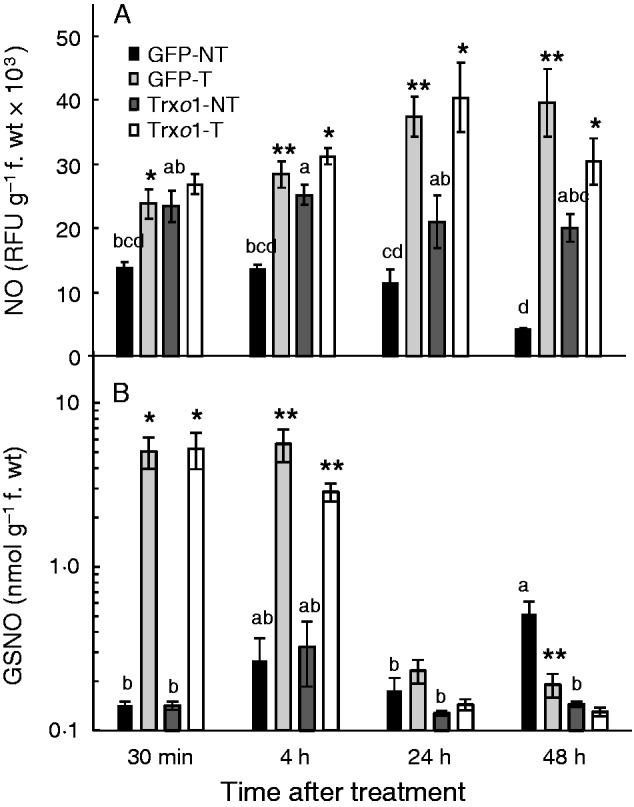
Content of (A) NO and (B) GSNO of GFP and Trxo1 lines of tobacco BY-2 cells, non-treated (NT) and treated (T) with 35 mm H2O2. Values represent mean ± s.e. of three experiments. Note log scale in (B). Means for each non-treated sample that do not have a common letter are significantly different by Tukey’s test at P < 0·05. *, **, *** indicate differences between non-treated and H2O2-treated samples that are significant at the 5, 1 and 0·1 % level, respectively. RFU, relative fluorescence units.
Cellular antioxidant metabolites and enzymes
To analyse the cellular redox state after H2O2 treatment of cells of the GFP and Trxo1 lines, the ASC and GSH pools were measured. Results revealed that, in non-treated conditions, the two lines presented similar total ASC contents [ASC plus dehydroascorbate (DHA)], but DHA was higher in line GFP at 24 h while in the Trxo1 line it was higher at 4 h (Fig. 8A, B). After H2O2 exposure, total ASC did not vary in either line (Fig. 8A) while a general increase in DHA was observed in the GFP line over time; this increase was not so evident in the Trxo1 line (Fig. 8B).
Fig. 8.
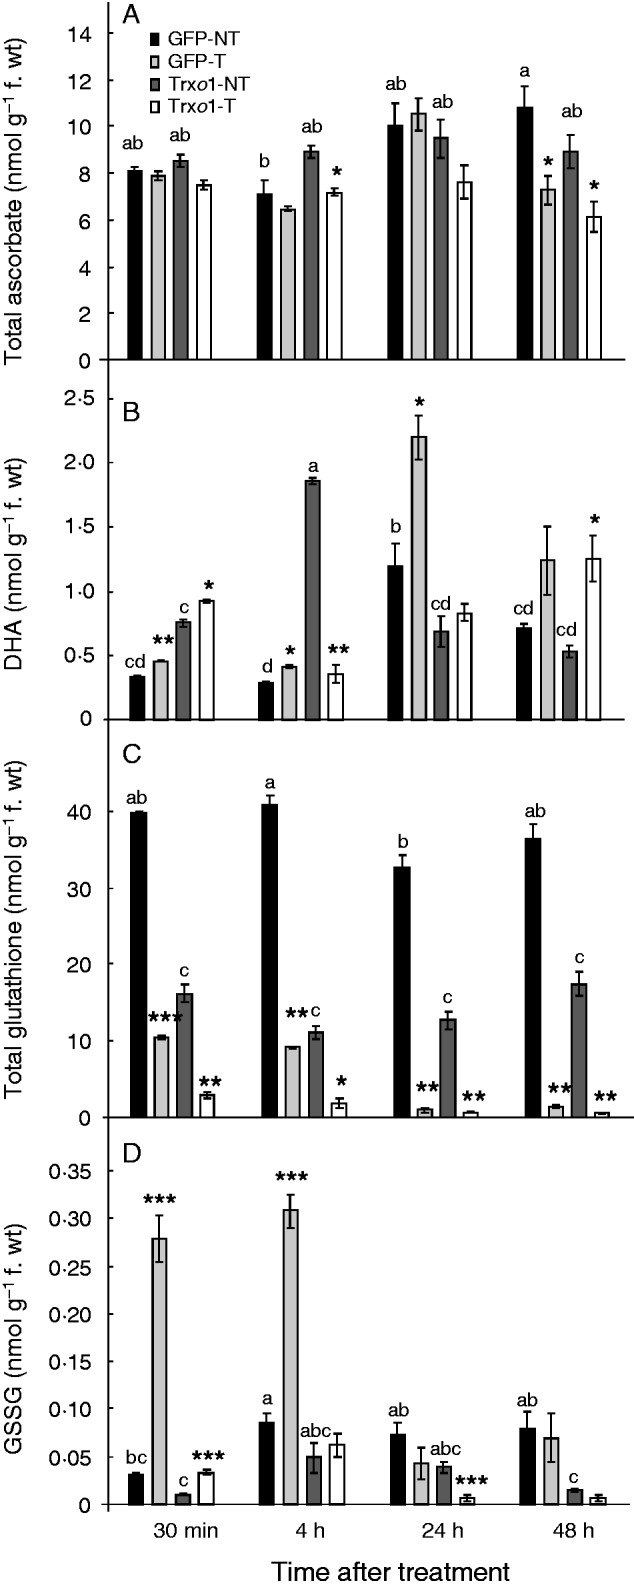
Content of (A) total ascorbate [ASC + dehydroascorbate (DHA)] and (B) DHA, (C) total glutathione [GSH + oxidized glutathione (GSSG)] and (D) GSSG in GFP and Trxo1 lines of tobacco BY-2 cells, non-treated (NT) and treated (T) with 35 mm H2O2. Values represent mean ± s.e. of three experiments. Means for each non-treated sample that do not have common letter are significantly different by Tukey’s test at P < 0·05. *, **, *** indicate differences between non-treated and H2O2-treated sample that are significant at the 5, 1 and 0·1 % level, respectively
In non-treated cells, total GSH content was more than 2-fold higher in the GFP line than in the Trxo1 line (Fig. 8C). This was mainly due to the increase in GSH, the reduced form of glutathione, since the amount of oxidized glutathione (GSSG) was much lower than that of GSH and was similar in the two lines, except at 48 h, when it was around 5-fold less in the Trxo1 line than in the GFP line (Fig. 8D). After H2O2 treatment, total GSH decreased to a similar extent in the two treated lines. Under this condition, GSSG content strongly increased in the GFP line at 30 min and 4 h. However, values in the Trxo1 line were similar to those in the GFP line at the later time points.
Regarding antioxidant enzymes, APX activity was similar in non-treated cells of the two lines, except at 48 h, when activity in the GFP line was 1·5-fold lower than in the over-expressing line. After 35 mm H2O2 treatment, a great decrease in APX activity was observed over the period of study. This decrease was similar in the two lines (Fig. 9A). Catalase activity was around 3-fold higher in the GFP line than in the over-expressing line at 30 min and 4 h in non-treated conditions, whereas it presented a similar value in the two lines at 48 h. The effect of H2O2 treatment was opposite in the two lines; whereas in the GFP line catalase activity was always lower throughout the period of study, in the over-expressing line this activity increased (Fig. 9B). Another enzyme involved in the removal of H2O2 from cells is mitochondrial PrxIIF, a reported target of Trxo1 (Martí et al., 2009). Its protein level was analysed in both lines under H2O2 treatment. It is worth highlighting that over-expression of Trxo1 in cells of the Trxo1 line was not accompanied by a change in the level of its target, PrxIIF, compared with the level in the GFP control line (Fig. 10). However, after 4 h of H2O2 treatment, PrxIIF content was reduced by 70 % in the GFP line, while in the Trxo1 line the reduction was less severe, at around 40 %.
Fig. 9.
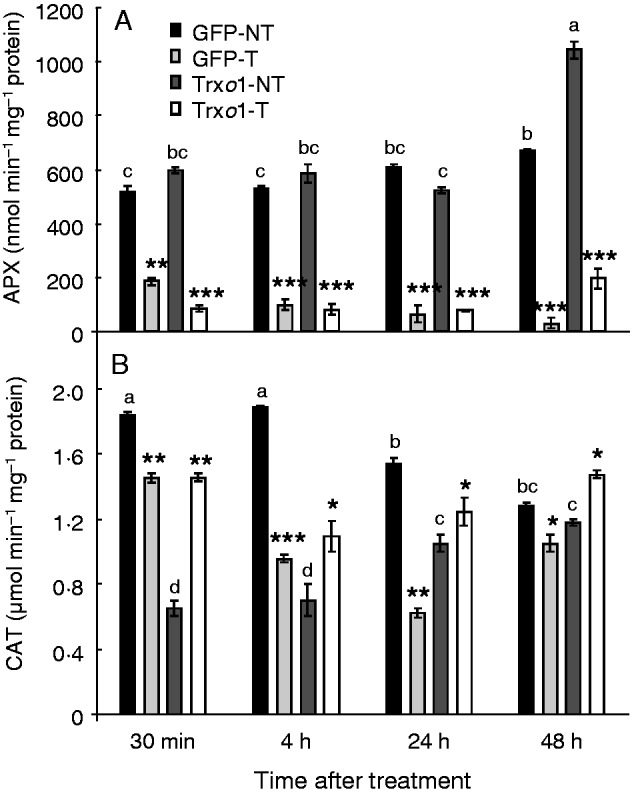
Changes over time in (A) APX and (B) catalase specific activities of GFP and Trxo1 lines of tobacco BY-2 cells, non-treated (NT) and treated (T) with 35 mm H2O2. Values represent mean ± s.e. of three experiments. Means for each non-treated sample that do not have common letter are significantly different by Tukey’s test at P < 0·05. *, **, *** indicate differences between non-treated and H2O2-treated samples that are significant at the 5, 1 and 0·1 % levels, respectively
Fig. 10.
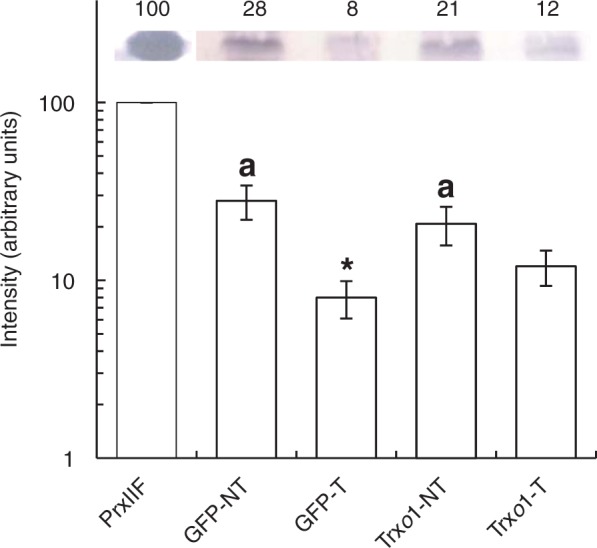
Western blot analysis of the protein level of PrxIIF in GFP and Trxo1 lines of tobacco BY-2 cells, non-treated (NT) and treated (T) with 35 mm H2O2, after 4 h. A representative blot is shown for recombinant PsPrxIIF as positive control (100 %). Band intensity (arbitrary units; note log scale) is represented in the graph after quantification using image analysis software (GeneTools, Syngene, Cambridge, UK).
DISCUSSION
The expression of PsTrxo1 cDNA, a Pisum sativum thioredoxin o1, in transgenic tobacco cells was associated with the appearance of a peptide of apparent molecular mass close to that predicted for the mature PsTrxo1 protein (Martí et al., 2009), which reacted with an antibody directed against an epitope at the C-terminus of the amino acid sequence of PsTrxo1. Mitochondrial and nuclear-enriched fractions of cells of the Trxo1 line showed the presence of the PsTrxo1 protein, which was absent in control GFP line cells and in the cytoplasm of Trxo1 line cells. This result confirmed that this protein reached the target organelles in TBY-2-over-expressing cells, in agreement with the subcellular localization described for this Trxo1 in pea (Martí et al., 2009). GFP and GFP variants have been used widely for protein location or over-expression studies in cellular cultures (Sack et al., 2007; Voitsekhovskaja et al., 2014), and they are appropriate markers for positive transformed calli of TBY-2 (Karimi et al., 2002).
The presence of PsTrxo1 provoked some changes in the over-expressing cells, although it did not affect their rate of growth, which was similar to that of the control GFP cells. Levels of oxidative stress measured as lipid and protein oxidation were generally similar over time in the two lines, as were also H2O2 content and antioxidants, such as ASC and APX activity. However, in the GFP line the higher NO content and catalase activity and lower GSH content probably pointed to cross-talk between Trx, ROS and reactive nitrogen species, which could influence cellular responses to an oxidative situation such as that provoked by H2O2 treatment. In fact, cells over-expressing Trxo1 have been shown to delay and decrease the extent of cell death induced by H2O2, and in this work we investigated the possible role of Trxo1 protein in the response to this oxidative situation. ROS signalling has been described as being related to the chemical characteristics of the species and dose, with H2O2 in particular being a prominent signalling molecule that is relatively stable and mobile among compartments and cells (Vranova et al., 2002; Op den Camp et al., 2003; Gadjev et al., 2008). In general, low concentrations of H2O2 are reported to protect against oxidative and abiotic stress, by activating defence responses aimed at maintaining cellular redox homeostasis; concentrations in a narrow range of concentrations trigger PCD, while higher concentrations can cause necrosis (Van Breusegem and Dat, 2006; Laloi et al., 2006; de Pinto et al., 2006). In fact, previous work has shown that when H2O2 is produced above certain levels, cell death is induced in a concentration-dependent manner (Houot et al., 2001; de Pinto et al., 2002; Dubovskaya et al., 2007). Hydrogen peroxide is known to be able to provoke necrosis or PCD, although both processes are considered to be two extremes of the same phenomenon, namely necrapoptosis (Casolo et al., 2005). In this paper we report for the first time the effect of the over-expression of a Trxo1 in an oxidative situation, inducing PCD. In fact, the analysis of the effect of H2O2 on our TBY-2 cell cultures evidenced the presence of dead cells with some features of AL-PCD, such as cell shrinkage, apoptotic-like nuclei (Houot et al., 2001) and DNA fragmentation, which in the case of the over-expressing Trxo1 line was in the form of DNA laddering at the time analysed. Interestingly, over-expressing cells presented very high viability after the treatment in comparison with control cells, being protected from the death inducer H2O2, and in this work we asked whether Trxo1 protein is involved in the response through the antioxidant metabolism.
Analysis of oxidative stress induced by the treatment revealed that 35 mm H2O2 provoked similar oxidative damage in the Trxo1-over-expressing and GFP control lines in terms of protein oxidation and lipid peroxidation, although the difference between untreated and treated cells was lower in the over-expressing line at 24 and 48 h of treatment than at other time points. Consistently, differences in intracellular H2O2 content were observed between the two lines when they were subjected to oxidative treatment, which provoked a general increase in the content of H2O2 in cellular extracts of the GFP line, while in Trxo1 cells the levels of H2O2 were maintained at similar levels in the treated and untreated cells; this behaviour was consistent with a higher protective capability against oxidative stress in Trxo1 cells than in GFP cells, which could be related to higher catalase activity in Trxo1 cells than in GFP cells after exposure to H2O2 and the higher viability found in over-expressing cells than in GFP line cells. It has been suggested that exposure of cultured plant cells to H2O2 and accumulation of hydroperoxides results in PCD processes (Houot et al., 2001; de Pinto et al., 2006). The level of lipid peroxidation in TBY-2 cells has been reported to remain constant in PCD induced by narciclasine and heat shock treatment, before the onset of loss of cell viability while increasing in the late stages, implying that MDA accumulation is related to cell death (Locato et al., 2008; Lu et al., 2012).
The different amounts of H2O2 found in the cell contents of the two lines after H2O2 treatment led us to examine some components of the antioxidant system of the cells. Added H2O2 was quickly removed by cell metabolism from the culture medium in which TBY-2 cells were cultured: almost 80 % of added 50 mm H2O2 disappeared within a few minutes (Houot et al., 2001; de Pinto et al., 2006). It has been reported that some of the components of the ROS-scavenging system in plants are involved in PCD. In fact, H2O2-mediated induced resistance to death in tobacco seems to depend on downregulation of the antioxidant system, and this has been related to a more intense hypersensitive response (or death) during pathogen infection (Király et al., 2002). The ASC–GSH cycle is part of the antioxidant network controlling H2O2 levels and has been implicated in the transduction signal that triggers PCD, in which NO and ROS also play an essential role (de Pinto et al., 2002). Several papers underline that ROS activate NO biosynthesis and vice versa, and that these two classes of reactive species act in synergy to promote PCD (Delledonne et al., 1998; de Pinto et al., 2012). Induction of PCD by NO and H2O2 together requires a decrease in the antioxidants, such as APX, as a first stage and subsequently an alteration in the redox state and levels of ASC and GSH towards the oxidized forms (de Pinto et al., 2002, 2006, 2013). Moreover, an increase in S-nitrosylating agents such as GSNO and NO has recently been reported to occur during PCD induced by H2O2 in TBY-2 cells (de Pinto et al., 2013). In our cells, the difference in H2O2 content, rather than NO and GSNO, seemed to influence the difference in progression of PCD after oxidative treatment in GFP and Trxo1 cells. Together with peroxidases, in particular APX, another important H2O2 scavenger is the enzyme catalase. Both APX and catalase activities have been reported to decrease during treatments that induce PCD, with an earlier response of APX (de Pinto et al., 2006; Locato et al., 2008, 2009; Lu et al., 2012). Consistently, even under our conditions, APX decreased very rapidly after PCD induction in both cell lines, thus confirming APX involvement in the redox impairment occurring during PCD. On the other hand, the behaviour of catalase was different in the two cell lines both in the control and the treated condition. Indeed, under the control condition, catalase had lower activity in Trxo1-over-expressing cells than in GFP line cells, whereas when cells were exposed to H2O2 catalase activity decreased in GFP cells undergoing PCD, which is consistent with literature data (Locato et al., 2008), but increased in Trxo1-over-expressing cells. This could suggest that, under control conditions, the decrease in catalase activity was balanced in Trxo1 over-expressing cells by the presence of Trxo1 protein. The behaviour of catalase under H2O2 treatment was also consistent with the alteration in endogenous H2O2 content. Indeed, H2O2 increased in GFP cells but remained at control levels in Trxo1-over-expressing cells, pointing to catalase as mainly influencing the endogenous level of H2O2 in the these cells. Peroxiredoxin IIF, one of the Trxo1 targets, is also involved in the control of hydroperoxides, including H2O2 (Dietz et al., 2006; Martí et al., 2009). In spite of the lower PrxIIF content in the line over-expressing Trxo1 than in the GFP line, when cells were exposed to H2O2 treatment this protein decreased markedly in the GFP line but to a much lesser extent in the Trxo1 line. In previous work in which a proteomic study was performed in TBY-2 cells exposed to H2O2 treatment, Prxs as well as Trxh were found to be differentially expressed (Vannini et al., 2012), with a general decrease in the amounts of the proteins. This was related to increased cellular oxidation and decreased protein stability due to inhibition of the Prx–chaperone function in this situation, in which PCD hallmarks were also evidenced. Over-expression of Trxo1 would lead to the opposite situation, delaying the cell death induced by H2O2, probably by a regulatory action on Trxo1 target proteins. Among these, mitochondrial PrxIIF, at least, seems to decrease under H2O2 treatment, but to a lesser extent in Trxo1-over-expressing cells than in GFP line cells. Due to the peroxidase activity of PrxIIF, this difference could contribute to the higher tolerance of H2O2 treatment characterizing the Trxo1-over-expressing cells. However, we cannot exclude the possibility that levels of other H2O2-scavenging enzymes must be increased in Trxo1-over-expressing cells.
The cellular redox balance is controlled by the Trx and ASC–GSH systems, which regulate the ROS content in the cell and, directly or indirectly, the redox status of a plethora of metabolites. Cysteine oxidation is one of the post-translational modifications due to oxidative stress. It is known that the oxidation of cysteine affects enzyme activity when the oxidized amino acid is localized in the active site of the protein (Camejo et al., 2013), but alteration of enzyme activity could also occur when the oxidized cysteine is localized in a structural part of the protein (Holmgren and Bjornstedt,1995). Plant Trxo1 lacks structural cysteine, and for this reason it has been considered more resistant than other proteins to oxidative stress, as described for prokaryotic Trx and mammalian mitochondrial Trx-2 (Miranda-Vizuete et al., 1997; Spyrou et al., 1997). An increase in intracellular ROS has been described in Trx-2-deficient cells: the cells entered apoptosis while total GSH decreased. These deficient cells, when treated with buthionine sulphoximine (BSO), augmented cell death, possibly by increasing the number of necrotic cells (Tanaka et al., 2002). In the present work, the over-expressing Trxo1 cells had lower amounts of GSH than GFP control cells, but they did not show higher levels of GSH oxidation or conjugation to NO as GSNO. This could indicate that GSH biosynthesis may be affected in over-expressing cells. It has been reported that the reduced cytoplasmic Trx1 and Trx2 in yeast double mutants produces an increase in total GSH content, mainly in the oxidized form, by an unknown underlying mechanism of adjusting GSH levels in response to Trx deficiency (Muller, 1996). Also, an inverse relation has been reported between GSH level and Trx expression: mRNAs encoding two Trxh types were found to be increased by GSH depletion in a GSH-deficient root meristemless mutant (Schnaubelt et al., 2015). In agreement with this, as mentioned above, our Trxo1 over-expressing cells presented lower levels of GSH than the control cells. They showed less change in this antioxidant after H2O2 treatment, suggesting that over-expression was able to compensate for the decreased GSH content and to reduce its oxidation. It was previously reported that elevated transcription of yeast Trx2, mediated by YAP1, conferred resistance to H2O2, pointing to this Trx as a crucial part of the oxidative stress response (Kuge and Jones, 1994), similar to the feasible role found for Trxo1 in this work.
In conclusion, over-expression of PsTrxo1 caused significant differences in the response of TBY-2 cells to high concentrations of H2O2, consisting of higher and maintained viability in over-expressing cells, while the control line presented a severe decrease in viability and marked oxidative stress, with generalized cell death after 3 d of H2O2 treatment (Fig. 11). In over-expressing cells, the increase in catalase activity, the decreased H2O2 and NO contents and maintenance of the GSH redox state, as well as the levels of PrxIIF and Trxo1, might sustain the delay in cell death (AL-PCD) in relation to control cells. The similar changes in the contents of ASC, APX, GSNO and the oxidative parameters measured point mainly to Trxo1 as a pivotal factor responsible for the delay in H2O2-induced PCD, not only as an antioxidant. Further work in this direction would give us the opportunity to elucidate new functional roles of Trxo1 in plant development and responses to stress leading to cell death.
Fig. 11.
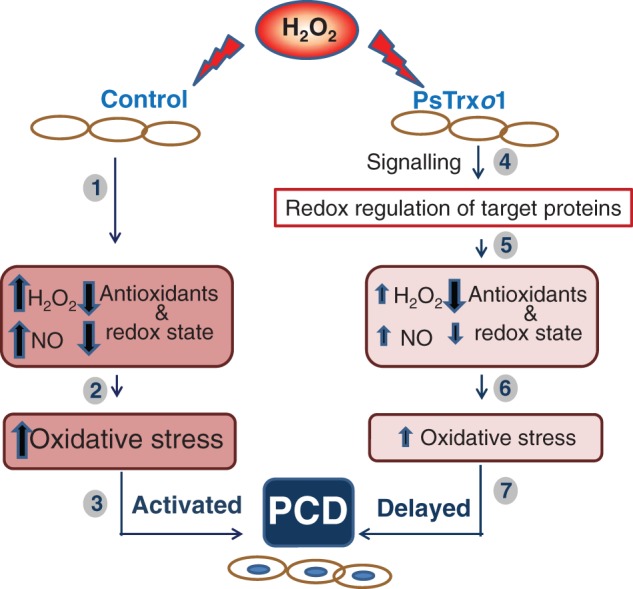
Role of PsTrxo1 in TBY-2 cell death after treatment with 35 mm H2O2. A differential response in control cells and cells over-expressing PsTrxo1 was observed after this treatment. In control cells a decrease in the levels of antioxidants (APX and catalase) and in the redox state of ASC and GSH is accompanied by an increase in H2O2 and NO. This situation causes oxidative stress in the cell, with increased lipid peroxidation (2) and a PCD process (3). In over-expressing PsTrxo1 cells, H2O2 treatment induces a signalling response that implies the redox regulation of target proteins (4). This situation causes a decrease in antioxidant components, such as APX and PrxIIF, and an increase in catalase, accompanied by a decrease in the redox state of ASC and GSH (5). These changes contribute to less oxidative stress than in control cells, evidenced by smaller changes in NO and H2O2 and decreased lipid peroxidation (6). Nevertheless, as a consequence of this situation, PCD occurs but is delayed (7).
SUPPLEMENTARY DATA
Supplementary data are available online at www.aob.oxfordjournals.org and consist of Figure S1: loading control of the western blot in Fig. 1F using Ponceau staining of the membrane.
ACKNOWLEDGEMENTS
The authors thank Sandra Correa from CEBAS-CSIC and Flora Schuster from the Institute of Molecular Biotechnology, RWTH University, Aachen, Germany, for their technical assistance. The authors also thank Stephen Hasler for correction of the written English in the manuscript. This work was supported by MICINN, Spain (BFU2011-28716) and Séneca Foundation, Murcia, Spain (04553/GERM/06). D.C. was supported by JAE-CSIC Research programme.
LITERATURE CITED
- Aebi H. 1984. Catalase in vitro. Methods in Enzymology 105: 121–126. [DOI] [PubMed] [Google Scholar]
- Apel K, Hirt H. 2004. Reactive oxygen species: metabolism, oxidative stress, and signal transduction. Annual Review of Plant Biology 55: 373–399. [DOI] [PubMed] [Google Scholar]
- Balmer Y, Vensel WH, Tanaka CK, et al. 2004. Thioredoxin links redox to the regulation of fundamental processes of plant mitochondria. Proceedings of the National Academy of Sciences of the USA 101: 2642–2647. [DOI] [PMC free article] [PubMed] [Google Scholar]
- Barranco-Medina S, Krell T, Bernier-Villamor L, Sevilla F, Lázaro JJ, Dietz KJ. 2008. Hexameric oligomerization of mitochondrial peroxiredoxin PrxIIF and formation of an ultrahigh affinity complex with its electron donor thioredoxin Trx-o. Journal of Experimental Botany 59: 3259–3269. [DOI] [PMC free article] [PubMed] [Google Scholar]
- Bellincampi D, Dipierro N, Salvi G, Cervone F, De Lorenzo G. 2000. Extracellular H2O2 induced by oligogalacturonides is not involved in the inhibition of the auxin-regulated rolB gene expression in tobacco leaf explants. Plant Physiology 122: 1379–1386. [DOI] [PMC free article] [PubMed] [Google Scholar]
- Bradford MM. 1976. A rapid and sensitive method for the quantitation of microgram quantities of protein utilizing the principle of protein-dye binding. Analytical Biochemistry 72: 248–254. [DOI] [PubMed] [Google Scholar]
- Van Breusegem F, Dat J. 2006. Reactive oxygen species in plant cell death. Plant Physiology 141: 384–390. [DOI] [PMC free article] [PubMed] [Google Scholar]
- Burbridge E, Diamond M, Dix PJ, McCabe PF. 2007. Use of cell morphology to evaluate the effect of a peroxidase gene on the cell death induction thresholds in tobacco. Plant Science 172: 853–860. [Google Scholar]
- Camejo D, Romero-Puertas MC, Rodríguez-Serrano M, et al. 2013. Salinity-induced changes in S-nitrosylation of pea mitochondrial proteins. Journal of Proteomics 79: 87–99.. [DOI] [PubMed] [Google Scholar]
- Caretto S, Paradiso A, D'Amico L, de Gara L. 2002. Ascorbate and glutathione metabolism in two sunflower cell lines of differing α-tocopherol biosynthetic capability. Plant Physiology and Biochemistry 40: 509–513. [Google Scholar]
- Casolo V, Petrussa E, Krajnáková J, Macri F, Vianello A. 2005. Involvement of the mitochondrial K+-ATP channel in H2O2- or NO-induced programmed death of soybean suspension cell cultures. Journal of Experimental Botany 56: 997–1006. [DOI] [PubMed] [Google Scholar]
- Dat JF, Pellinen R, Beeckman T, et al. 2003. Changes in hydrogen peroxide homeostasis trigger an active cell death process in tobacco. Plant Journal 33: 621–632. [DOI] [PubMed] [Google Scholar]
- Delledonne M, Xia Y, Dixon RA, Lamb C. 1998. Nitric oxide functions as a signal in plant disease resistance. Nature 394: 585–588. [DOI] [PubMed] [Google Scholar]
- Díaz-Vivancos P, Dong Y, Ziegler K, et al. 2010. Recruitment of glutathione into the nucleus during cell proliferation adjusts whole-cell redox homeostasis in Arabidopsis thaliana and lowers the oxidative defence shield. Plant Journal 64: 825–838. [DOI] [PubMed] [Google Scholar]
- Dietz KJ, Jacob S, Oelze ML, et al. 2006. The function of peroxiredoxin in plant organelle redox metabolism. Journal of Experimental Botany 57: 1697–1709. [DOI] [PubMed] [Google Scholar]
- Van Doorn WG, Woltering EJ. 2005. Many ways to exit? Cell death categories in plants. Trends in Plant Science 10: 117–122. [DOI] [PubMed] [Google Scholar]
- Dubovskaya LV, Kolesneva EV, Knyazev DM, Volotovskii ID. 2007. Protective role of nitric oxide during hydrogen peroxide-induced oxidative stress in tobacco plants. Russian Journal of Plant Physiology 54: 755–762. [Google Scholar]
- Gadjev I, Stone JM, Gechev TS. 2008. Programmed cell death in plants: new insights into redox regulation and the role of hydrogen peroxide. International Review of Cell and Molecular Biology 270: 87–144. [DOI] [PubMed] [Google Scholar]
- De Gara L, Locato V, Dipierro S, de Pinto MC. 2010. Redox homeostasis in plants. The challenge of living with endogenous oxygen production. Respiratory Physiology & Neurobiology 173: S13–S19. [DOI] [PubMed] [Google Scholar]
- Gelhaye E, Rouhier N, Gérard J, et al. 2004. A specific form of thioredoxin h occurs in plant mitochondria and regulates the alternative oxidase. Proceedings of the National Academy of Sciences of the USA 101: 14545–14550. [DOI] [PMC free article] [PubMed] [Google Scholar]
- Hakmaoui A, García-Fontana B, Jiménez A, Camejo D, Sevilla F, Barón M. 2012. Analysis of the antioxidant response of Nicotiana benthamiana to infection with two strains of Pepper mild mottle virus. Journal of Experimental Botany 63: 5487–5496. [DOI] [PMC free article] [PubMed] [Google Scholar]
- Hernández JA, Jiménez A, Mullineaux P, Sevilla F. 2000. Tolerance of pea (Pisum sativum L.) to long-term salt stress is associated with induction of antioxidant defenses. Plant, Cell & Environment 23: 853–862. [Google Scholar]
- Holmgren A, Bjornstedt M. 1995. Thioredoxin and thioredoxin reductase. Methods in Enzymology 252: 199–208. [DOI] [PubMed] [Google Scholar]
- Houot V, Etienne P, Petitot AS, Barbier S, Blein JP, Suty L. 2001. Hydrogen peroxide induces programmed cell death features in cultured tobacco BY-2 cells in a dose-dependent manner . Journal of Experimental Botany 52: 1721–1730. [PubMed] [Google Scholar]
- Jiménez A, Hernández JA, del Río LA, Sevilla F. 1997. Evidence for the presence of the ascorbate-glutathione cycle in mitochondria and peroxisomes of pea leaves. Plant Physiology 114: 275–284. [DOI] [PMC free article] [PubMed] [Google Scholar]
- Karimi M, Inzé D, Depicker A. 2002. GATEWAY™ vectors for Agrobacterium-mediated plant transformation. Trends in Plant Science 7: 193–195. [DOI] [PubMed] [Google Scholar]
- Király Z, Barna B, Kecskés A, Fodor J. 2002. Down-regulation of antioxidative capacity in a transgenic tobacco which fails to develop acquired resistance to necrotization caused by tobacco mosaic virus. Free Radical Research 36: 981–991. [DOI] [PubMed] [Google Scholar]
- Kuge S, Jones N. 1994. YAP1 dependent activation of TRX2 is essential for the response of Saccharomyces cerevisiae to oxidative stress by hydroperoxides. EMBO Journal 13: 655–664. [DOI] [PMC free article] [PubMed] [Google Scholar]
- Laloi C, Rayapuram N, Chartier Y, Grienenberger JM, Bonnard G, Meyer Y. 2001. Identification and characterization of a mitochondrial thioredoxin system in plants. Proceedings of the National Academy of Sciences of the USA 98: 14144–14149. [DOI] [PMC free article] [PubMed] [Google Scholar]
- Laloi C, Przybyla D, Apel K. 2006. A genetic approach towards elucidating the biological activity of different reactive oxygen species in Arabidopsis thaliana. Journal of Experimental Botany 57: 1719–1724. [DOI] [PubMed] [Google Scholar]
- Lázaro JJ, Jiménez A, Camejo D, et al. 2013. Dissecting the integrative antioxidant and redox systems in plant mitochondria. Effect of stress and S-nitrosylation. Frontiers in Plant Science 4: 460. [DOI] [PMC free article] [PubMed] [Google Scholar]
- Levine RL, Garland D, Oliver CN, et al. 1990. Determination of carbonyl content in oxidatively modified proteins. Methods in Enzymology 86: 464–478. [DOI] [PubMed] [Google Scholar]
- Locato V, Gadaleta C, De Gara L, de Pinto MC. 2008. Production of reactive species and modulation of antioxidant network in response to heat shock: a critical balance for cell fate. Plant, Cell & Environment 31: 1606–1619. [DOI] [PubMed] [Google Scholar]
- Locato V, de Pinto MC, De Gara L. 2009. Different involvement of the mitochondrial, plastidial and cytosolic ascorbate-glutathione redox enzymes in heat shock responses. Physiologia Plantarum 135: 296–306. [DOI] [PubMed] [Google Scholar]
- Lu H, Wan Q, Wang H, Na X, Wang X, Bi Y. 2012. Oxidative stress and mitochondrial dysfunctions are early events in narciclasine-induced programmed cell death in tobacco Bright Yellow-2 cells. Physiologia Plantarum 144: 48–58. [DOI] [PubMed] [Google Scholar]
- Lu J, Holmgren A. 2012. Thioredoxin system in cell death progression. Antioxidants & Redox Signaling 17: 1738–1748. [DOI] [PubMed] [Google Scholar]
- McCabe PF, Levine A, Meijer PJ, Tapon NA, Pennell RI. 1997. A programmed cell death pathway activated in carrot cells cultured at low cell density. Plant Journal 12: 267–280. [Google Scholar]
- Martí MC, Olmos E, Calvete JJ, et al. 2009. Mitochondrial and nuclear localization of a novel pea thioredoxin: identification of its mitochondrial target proteins. Plant Physiology 150: 646–657. [DOI] [PMC free article] [PubMed] [Google Scholar]
- Martí MC, Florez-Sarasa I, Camejo D, et al. 2011. Response of the mitochondrial antioxidant redox system and respiration to salinity in pea plants. Journal of Experimental Botany 62: 3863–3874. [DOI] [PMC free article] [PubMed] [Google Scholar]
- Martí MC, Florez-Sarasa I, Camejo D, et al. 2013. Response of mitochondrial antioxidant system and respiratory pathway to reactive nitrogen species in pea leaves. Physiologia Plantarum 147: 194–206. [DOI] [PubMed] [Google Scholar]
- Meyer Y, Belin C, Delorme-Hinoux V, Reichheld JP, Riondet C, Meyer Y. 2012. Thioredoxin and glutaredoxin systems in plants: molecular mechanisms, crosstalks, and functional significance. Antioxidant & Redox Signaling 17: 1124–1160. [DOI] [PubMed] [Google Scholar]
- Miranda-Vizuete A, Damdimopoulos AE, Gustafsson JA, Spyrou G. 1997. Cloning, expression and characterization of a novel Escherichia coli thioredoxin. Journal of Biological Chemistry 272: 30841–30847. [DOI] [PubMed] [Google Scholar]
- Mittler R, Vanderauwera S, Suzuki N, et al. 2011. ROS signaling: the new wave? Trends in Plant Science 16: 300–309. [DOI] [PubMed] [Google Scholar]
- Monetti E, Kadono T, Tran D, et al. 2014. Deciphering early events involved in hyperosmotic stress-induced programmed cell death in tobacco BY-2 cells. Journal of Experimental Botany 65: 1361–1375. [DOI] [PMC free article] [PubMed] [Google Scholar]
- Muller EGD. 1996. A glutathione reductase mutant of yeast accumulates high levels of oxidized glutathione and requires thioredoxin for growth. Molecular and Cellular Biology 7: 1805–1813. [DOI] [PMC free article] [PubMed] [Google Scholar]
- Mullineaux PM, Baker NR. 2010. Oxidative stress: antagonistic signaling for acclimation or cell death? Plant Physiology 154: 521–525. [DOI] [PMC free article] [PubMed] [Google Scholar]
- Murashige T, Skoog F. 1962. A revised medium for rapid growth and bio assays with tobacco tissue cultures. Physiologia Plantarum 15: 473–497. [Google Scholar]
- Murgia I, de Pinto MC, Delledonne M, Soave C, De Gara L. 2004. Comparative effects of various nitric oxide donors on ferritin regulation, programmed cell death and cell redox state in plant cells. Journal of Plant Physiology 161: 777–783. [DOI] [PubMed] [Google Scholar]
- Op Den Camp RGL, Przybyla D, Ochsenbein C, et al. 2003. Rapid induction of distinct stress responses after the release of singlet oxygen in Arabidopsis. Plant Cell 5: 2320–2332. [DOI] [PMC free article] [PubMed] [Google Scholar]
- Paradiso A, de Pinto MC, Locato V, De Gara L. 2012. Galactone-γ-lactone-dependent ascorbate biosynthesis alters wheat kernel maturation. Plant Biology 14: 652–658. [DOI] [PubMed] [Google Scholar]
- de Pinto MC, Tommasi F, De Gara L. 2000. Enzymes of the ascorbate biosynthesis and ascorbate-glutathione cycle in cultured cells of tobacco Bright-Yellow 2. Plant Physiology and Biochemistry 38: 541–550. [Google Scholar]
- de Pinto MC, Tommasi L, de Gara L. 2002. Changes in the antioxidant systems as part of the signaling pathway responsible for the programmed cell death activated by nitric oxide and reactive oxygen species in tobacco Bright-Yellow 2 cells. Plant Physiology 130: 698–708. [DOI] [PMC free article] [PubMed] [Google Scholar]
- de Pinto MC, Paradiso A, Leonetti P, De Gara L. 2006. Hydrogen peroxide, nitric oxide and cytosolic ascorbate peroxidase at the crossroad between defence and cell death. Plant Journal 48: 784–795. [DOI] [PubMed] [Google Scholar]
- de Pinto MC, Locato V, De Gara L. 2012. Redox regulation in plant programmed cell death. Plant, Cell & Environment 35: 234–244. [DOI] [PubMed] [Google Scholar]
- de Pinto MC, Locato V, Sgobba A, et al. 2013. S-nitrosylation of ascorbate peroxidase is part of programmed cell death signaling in tobacco Bright Yellow-2 cells. Plant Physiology 163: 1766–1775. [DOI] [PMC free article] [PubMed] [Google Scholar]
- Pulido P, Cazalis R, Cejudo FJ. 2009. An antioxidant redox system in the nucleus of wheat seed cells suffering oxidative stress. Plant Journal 57: 132–145. [DOI] [PubMed] [Google Scholar]
- Reape TJ, Molony EM, McCabe PF. 2008. Programmed cell death in plants: distinguishing between different modes. Journal of Experimental Botany 59: 435–444. [DOI] [PubMed] [Google Scholar]
- Sack M, Paetz A, Kunert R, et al. 2007. Functional analysis of the broadly neutralizing human anti-HIV-1 antibody 2F5 produced in transgenic BY-2 suspension cultures. FASEB Journal 21: 1655–1664. [DOI] [PubMed] [Google Scholar]
- Schinkel H, Schiermeyer A, Soeur R, Fischer R, Schillberg S. 2005. Production of an active recombinant thrombomodulin derivative in transgenic tobacco plants and suspension cells. Transgenic Research 14: 251–259. [DOI] [PubMed] [Google Scholar]
- Schnaubelt D, Queval G, Dong Y, et al. 2015. Low glutathione regulates gene expression and the redox potentials of the nucleus and cytosol in Arabidopsis thaliana. Plant, Cell & Environment 38: 266–279. [DOI] [PubMed] [Google Scholar]
- Serrato AJ, Cejudo FJ. 2003. Type-H thioredoxins accumulate in the nucleus of developing wheat seed tissues suffering oxidative stress. Planta 217: 392–399. [DOI] [PubMed] [Google Scholar]
- Serrato AJ, Crespo JL, Florencio FJ, Cejudo FJ. 2001. Characterization of two thioredoxins h with predominant localization in the nucleus of aleurone and scutellum cells of germinating wheat seeds. Plant Molecular Biology 46: 361–371. [DOI] [PubMed] [Google Scholar]
- Sgobba A, Paradiso A, Dipierro S, De Gara L, de Pinto MC. 2014. Changes in antioxidants are critical in determining cell responses to short- and long-term heat stress . Physiologia Plantarum 153: 68–78. [DOI] [PubMed] [Google Scholar]
- Spyrou G, Enmark E, Miranda-Vizuete A, Gustafsson J. 1997. Cloning and expression of a novel mammalian thioredoxin. Journal of Biological Chemistry 272: 2936–2941. [DOI] [PubMed] [Google Scholar]
- Tanaka T, Hosoi F, Yamaguchi-Iwai Y, et al. 2002. Thioredoxin-2 (TRX-2) is an essential gene regulating mitochondria-dependent apoptosis. EMBO Journal 21: 1695–1703. [DOI] [PMC free article] [PubMed] [Google Scholar]
- Taylor NL, Tan YF, Jacoby RP, Millar AH. 2009. Abiotic environmental stress induced changes in the Arabidopsis thaliana chloroplast, mitochondria and peroxisome proteomes . Journal of Proteomics 72: 367–378. [DOI] [PubMed] [Google Scholar]
- Vacca RA, Valenti D, Bobba A, Merafina RS, Passerella S, Marra E. 2006. Cytochrome c is released in a reactive oxygen species-dependent manner and is degraded via caspase-like proteases in tobacco Bright-Yellow 2 cells en route to heat shock-induced cell death. Plant Physiology 141: 208–219. [DOI] [PMC free article] [PubMed] [Google Scholar]
- Vannini C, Marsoni M, Cantara C, et al. 2012. The soluble proteome of tobacco Bright Yellow-2 cells undergoing H2O2-induced programmed cell death. Journal of Experimental Botany 63: 3137–3155. [DOI] [PMC free article] [PubMed] [Google Scholar]
- Voitsekhovskaja OV, Schiermeyer A, Reumann S. 2014. Plant peroxisomes are degraded by starvation-induced and constitutive autophagy in tobacco BY-2 suspension-cultured cells. Frontiers in Plant Science 5: 629. [DOI] [PMC free article] [PubMed] [Google Scholar]
- Vranova E, Atichartpongkul S, Villarroel R, Van Montagu M, Inzé D, Van Camp W. 2002. Comprehensive analysis of gene expression in Nicotiana tabacum leaves acclimated to oxidative stress. Proceedings of the National Academy of Sciences of the USA 99: 10870–10875. [DOI] [PMC free article] [PubMed] [Google Scholar]
- Yoshida K, Noguchi K, Motohashi K, Hisabori T. 2013. Systematic exploration of thioredoxin target proteins in plant mitochondria. Plant and Cell Physiology 54: 875–892. [DOI] [PubMed] [Google Scholar]
- Zhang J, Kirkham MB. 1996. Antioxidant responses to drought in sunflower and sorghum seedlings. New Phytologist 132: 361–373. [DOI] [PubMed] [Google Scholar]
Associated Data
This section collects any data citations, data availability statements, or supplementary materials included in this article.


