Abstract
Background/Aims:
In assigning patients with chronic obstructive pulmonary disease (COPD) to subgroups according to the updated guidelines of the Global Initiative for Chronic Obstructive Lung Disease, discrepancies have been noted between the COPD assessment test (CAT) criteria and modified Medical Research Council (mMRC) criteria. We investigated the determinants of symptom and risk groups and sought to identify a better CAT criterion.
Methods:
This retrospective study included COPD patients seen between June 20, 2012, and December 5, 2012. The CAT score that can accurately predict an mMRC grade ≥ 2 versus < 2 was evaluated by comparing the area under the receiver operating curve (AUROC) and by classification and regression tree (CART) analysis.
Results:
Among 428 COPD patients, the percentages of patients classif ied into subgroups A, B, C, and D were 24.5%, 47.2%, 4.2%, and 24.1% based on CAT criteria and 49.3%, 22.4%, 8.9%, and 19.4% based on mMRC criteria, respectively. More than 90% of the patients who met the mMRC criteria for the ‘more symptoms group’ also met the CAT criteria. AUROC and CART analyses suggested that a CAT score ≥ 15 predicted an mMRC grade ≥ 2 more accurately than the current CAT score criterion. During follow-up, patients with CAT scores of 10 to 14 did not have a different risk of exacerbation versus those with CAT scores < 10, but they did have a lower exacerbation risk compared to those with CAT scores of 15 to 19.
Conclusions:
A CAT score ≥ 15 is a better indicator for the ‘more symptoms group’ in the management of COPD patients.
Keywords: Pulmonary disease, chronic obstructive; Symptoms; Classification; COPD assessment test; Modified Medical Round Council
INTRODUCTION
The updated guidelines of the Global Initiative for Chronic Obstructive Lung Disease (GOLD) categorize patients with chronic obstructive pulmonary disease (COPD) into subgroups (A to D) using symptoms based on either their modified Medical Research Council (mMRC) grade or COPD assessment test (CAT) score, and risk is based on the forced expiratory volume in 1 second (FEV1) or exacerbation history [1]. According to the guidelines, a patient who shows an mMRC grade ≥ 2 or a CAT score ≥ 10 is categorized into the ‘more symptoms group.’ This classification system was accepted in the Korean guidelines [2]. An individual’s CAT score is generally correlated with his/her mMRC grade; however, discrepancies have been noted between mMRC grades and CAT scores [3]. For example, Han et al. [4] reported that the choice of symptom measure influenced category assignment. When mMRC was chosen as the symptom measure, 58.5% of COPD patients were categorized into the more symptoms group. In contrast, when a St. George Respiratory Questionnaire (SGRQ) score of 25, which has been shown previously to be comparable to a CAT score of 10, was used as the measure, 65.7% of patients were classified into the more symptoms group. This suggests that a CAT cut-off value of 10 could overestimate the symptom severity compared with an mMRC cut-off value of 2. In fact, the average SGRQ score among patients with an mMRC grade of 2 was 39 (standard deviation [SD], 14) corresponding to a CAT score of 15.6. Those individuals with an mMRC grade of 1 had an SGRQ score of 26 (SD, 13) corresponding to a CAT score of 10.4.
It is also unclear whether there could be racial differences in the association between CAT scores and mMRC grades [5,6]. It has been reported that there are racial differences in the polymorphisms of genes that may be important in the pathogenesis [7,8] of and susceptibility [9] to COPD. In fact, Asians showed a much slower rate of decline in FEV1 than Caucasians (–30.6 mL/yr vs. –48.1 mL/yr in the TOwards a Revolution in COPD Health [TORCH] trial) [10], and African-Americans have less emphysema than non-Hispanic whites (13.1% vs. 16.1%) [11]. Symptom distribution may also differ according to ethnicity.
We conducted this study to evaluate the determinants of symptom and risk groups and to determine a more accurate cut-off level for the CAT score to predict an mMRC grade ≥ 2 among Korean patients.
METHODS
Study design
Since the GOLD guidelines were revised in 2011, most patients with COPD visiting our hospital have been evaluated using the CAT and mMRC questionnaires. This retrospective study included COPD patients aged 40 years or older who visited the pulmonology outpatient clinic at Seoul National University Hospital and completed questionnaires that included the CAT, mMRC, and exacerbation history between June 20, 2012, and December 5, 2012. COPD was defined as a post-bronchodilator FEV1 to forced vital capacity ratio < 0.7. Those who had no spirometric measurements taken after bronchodilator use within the previous year, and those who had other respiratory diseases, including asthma, tuberculosis sequelae, and bronchiectasis involving one or more segments, fibrothorax, lung cancer, or a history of lung resection, were excluded. The Korean version of the CAT questionnaire is available online (http://www.catestonline.org/) and has been validated for Asian patients [12]. Exacerbation in the past year was defined as the self-reported experience of an unexpected visit to an outpatient clinic or emergency room due to aggravation of dyspnea within 1 year from the date of the questionnaire. Three well-trained nurses were responsible for checking the questionnaires in the outpatient clinic. Exacerbation during follow-up was defined as the worsening of a respiratory symptom requiring treatment with antibiotics or systemic corticosteroids, or hospitalization.
This study was approved by the Institutional Review Board (IRB) of Seoul National University Hospital (IRB no. H-1212-113-453).
Analysis
First, we evaluated the distribution of COPD subgroups based on the spirometric measurements and questionnaires, determinants of the risk and symptom groups, and relationship between mMRC grade and CAT score using descriptive statistics. Second, the cut-off level for CAT that could more accurately predict an mMRC grade ≥ 2 versus < 2, was evaluated by comparing the area under the receiver operating curve (AUROC) and using classification and regression tree (CART) analysis. CART modeling identifies variables that delineate subgroups of patients with distinct patterns of mMRC grade ≥ 2. The overall probability of the outcome (mMRC grade ≥ 2) was estimated. Next, the patients were divided into two subgroups based on the categories chosen and the CART algorithm in the case of continuous variables (e.g., CAT score) that best reflected the probability of the outcome. This process was continued with each subgroup until the added level of complexity could not be justified by the effort required at validation [13,14]. Kaplan-Meier estimates and the log-rank test were used to compare the time to first exacerbation during follow-up according to the CAT score among patients with at least 1 year of follow-up. All statistical analyses were conducted using STATA software version 12.1 (STATA Corp., College Station, TX, USA). A p < 0.05 was considered to indicate statistical significance.
RESULTS
Among 1,049 patients screened, 790 patients with COPD aged 40 years or older who answered questionnaires, including the CAT and mMRC, were enrolled. After excluding patients who had other lung diseases (n = 182) or had not undergone spirometry within the previous year (n = 180), 428 patients were included in the analysis. The mean age of the patients was 69.5 ± 8.0 years, and males were predominant (88.1%). Their mean body mass index was 23.1 ± 8.0 kg/m2 and 84.5% were current or former smokers. Their mean mMRC and CAT scores were 1.47 ± 0.81 and 14.3 ± 7.1, respectively. Among the patients, 13.8% had experienced two or more exacerbations in the past year. Their mean FEV1 was 70.0% ± 21.3% of the predicted value, and 17.6% of the patients were classified into GOLD stage 3 or 4. Of these patients, the distribution of subgroups was 22.0% (94; A), 49.8% (213; B), 3.0% (13; C), and 25.2% (108; D) (Table 1). While about 30% of stage 1 to 2 patients had fewer symptoms (subgroup A or C), less than 10% of stage 3 to 4 patients had fewer symptoms. The percentage of patients classified into subgroup D was more than 10%, even in stage 1 to 2. Of the patients classified into the high-risk group (who had either an FEV1 ≥ 50% of the predicted value [FEV1 criterion] or two or more exacerbations in the past year [exacerbation criterion]), 62 (51.2%) met only the FEV1 criterion, 46 (38.0%) met only the exacerbation criterion, and 13 (10.7%) met both (Fig. 1). Of the patients classified into the more symptoms group (who had an mMRC grade ≥ 2 [mMRC criterion] or a CAT score < 10 [CAT criterion]), 142 (44.2%) met only the CAT criterion, 16 (5.0%) met only the mMRC criterion, and 163 (50.8%) met both. Thus, more than 90% of the patients who met the mMRC criterion for the more symptoms group also met the CAT criteria, indicating that the CAT criterion was ‘easier’ to meet than the mMRC criterion for the more symptoms group (Fig. 2).
Table 1.
Baseline characteristics and the distribution of subgroups
| Variable | Value |
|---|---|
| No. of patients included | 428 |
| Age, yr | 69.5 ± 8.0 |
| Male sex | 377 (88.1) |
| Height, cm | 164.8 ± 8.9 |
| Weight, kg | 62.1 ± 9.8 |
| Body mass index, kg/m2 | 23.1 ± 7.2 |
| Smoking | |
| Current | 104 (24.4) |
| Former | 256 (60.1) |
| Never | 66 (15.5) |
| Pack-years | 36 (0–174) |
| Chronic bronchitis | 38 (13.9) |
| Modified Medical Research Council | |
| Mean ± SD | 1.47 ± 0.81 |
| Median (IQR) | 1 (1–2) |
| CAT score | |
| Mean ± SD | 14.3 ± 7.1 |
| Median (IQR) | 14 (9–19) |
| History of exacerbations in the past year | |
| Unexpected visit to outpatient clinic (no./yr) | 0 (0–30) |
| Unexpected visits to emergency room (no./yr) | 0 (0–5) |
| ≥ 2 Events in the past year | 59 (13.8) |
| FEV1/FVC | 0.50 ± 0.13 |
| FVC, L | 3.41 ± 0.78 |
| FVC, % | 96.2 ± 17.6 |
| FEV1, L | 1.70 ± 0.58 |
| FEV1, % | 70.0 ± 21.3 |
| GOLD stage | |
| 1 (FEV1 > 80% of predicted) | 130 (30.3) |
| 2 (FEV1 50%–79% of predicted) | 223 (52.1) |
| 3 (FEV1 30%–49% of predicted) | 70 (16.4) |
| 4 (FEV1 < 30% of predicted) | 5 (1.2) |
| GOLD subgroup | |
| A | 94 (22.0) |
| B | 213 (49.8) |
| C | 13 (3.0) |
| D | 108 (25.2) |
Values are presented as mean±SD, number (%), or median (interquartile range).
SD, standard deviation; IQR, interquartile range; CAT, chronic obstructive pulmonary disease (COPD) assessment test; FEV1, forced expiratory volume in 1 second; FVC, forced vital capacity; GOLD, Global Initiative for Chronic Obstructive Lung Disease.
Figure 1.
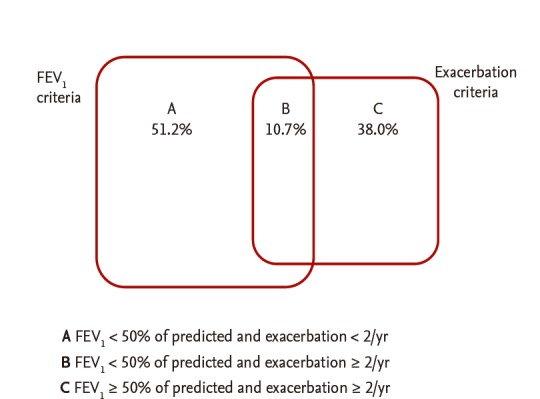
Venn diagram of the determinants for high-risk group classification. FEV1, forced expiratory volume in 1 second.
Figure 2.
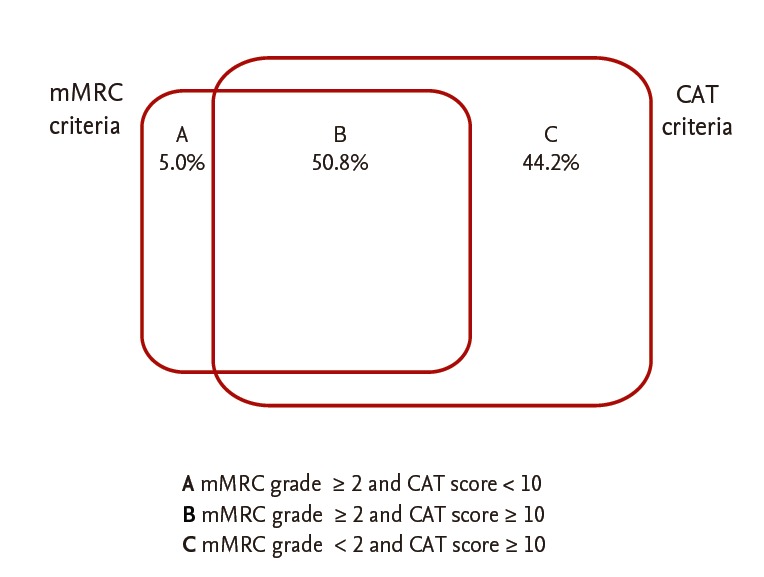
Venn diagram of the determinants for symptom group classification. mMRC, modified Medical Research Council; CAT, chronic obstructive pulmonary disease (COPD) assessment test.
The mean CAT scores were 5.6 ± 4.3, 11.9 ± 5.3, 17.0 ± 6.5, 22.5 ± 5.8, and 23.3 ± 3.6 among patients with an mMRC grade of 0, 1, 2, 3, and 4, respectively (Table 2). If a CAT score of ≥ 10 versus < 10 was used as the cut-off criterion, based on the GOLD recommendations, the prediction of an mMRC ≥ 2 had a sensitivity of 91.1% and a specificity of 43.0%. If a CAT score ≥ 15 versus < 15 (the ‘new CAT criterion’) was used as the cut-off criterion, both the sensitivity and specificity were greater than 70% (data not shown).
Table 2.
CAT scores according to modified Medical Research Council grade
| CAT score | Mean | SD | MIN | 25th percentile | Median | 75th percentile | MAX |
|---|---|---|---|---|---|---|---|
| mMRC 0 | 5.6 | 4.3 | 0 | 3 | 4 | 8 | 21 |
| mMRC 1 | 11.9 | 5.3 | 1 | 8 | 12 | 16 | 28 |
| mMRC 2 | 17.0 | 6.5 | 5 | 13 | 16 | 21 | 37 |
| mMRC 3 | 22.5 | 5.8 | 9 | 18 | 22.5 | 27 | 33 |
| mMRC 4 | 23.3 | 3.6 | 18 | 21 | 24.5 | 25.5 | 26 |
CAT, chronic obstructive pulmonary disease (COPD) assessment test; SD, standard deviation; MIN, minimum; MAX, maximum; mMRC, modified Medical Research Council.
By CART analysis, a CAT score ≥ 15 (the new CAT criterion suggested above) was the best predictor of an mMRC ≥ 2 (relative hazard risk, 1.59) (Fig. 3). Even after adjusting for age, sex, pack-years, height, weight, the presence of a history of tuberculosis, the presence of symptoms compatible with chronic bronchitis, and FEV1 , a CAT score ≥ 15 was the best predictor of an mMRC ≥ 2 (data not shown).
Figure 3.
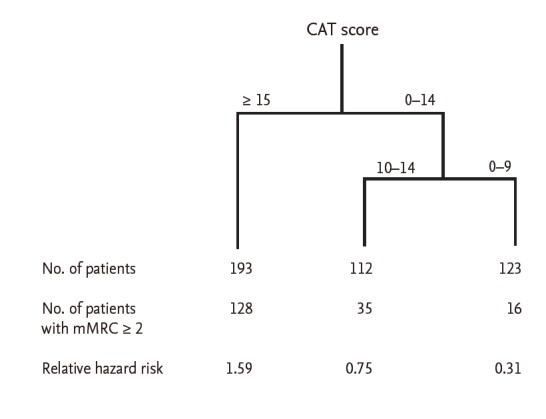
Classif ication and regression tree analysis to evaluate good predictors of an modified Medical Research Council (mMRC) grade ≥ 2. CAT, chronic obstructive pulmonary disease (COPD) assessment test.
Using the AUROC, a CAT score ≥ 15 showed better discriminant power to predict an mMRC grade ≥ 2 than a CAT score ≥ 10 (AUROC, 0.727 ± 0.022 vs. 0.670 ± 0.019, p = 0.007) (Fig. 4).
Figure 4.
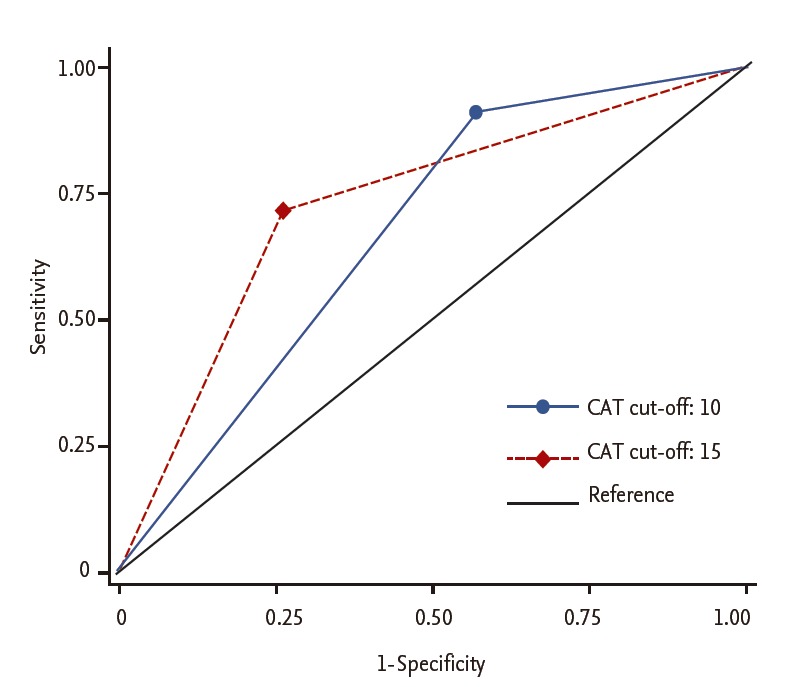
The area under the receiver operating curve to compare the prediction of modif ied Medical Research Council grade 2 according to chronic obstructive pulmonary disease (COPD) assessment test (CAT) criterion cut-off level.
Application of the new criterion resulted in an increase in the percentage of patients classified into the more symptoms group versus application of the mMRC criteria from 5.0% to 20.9% (Table 3), and an increase in the percentage of patients classified into subgroups A and C (22.0% to 37.4% in subgroup A, and 3.0% to 5.6% in subgroup C) (Table 4). During the follow-up period, patients with an initial CAT score of 10 to 14 had a significantly lower exacerbation risk than those with CAT scores of 15 to 19 or ≥ 20 (log-rank test, p < 0.001), but there was no significant difference in exacerbation risk between patients with CAT scores of 10 to 14 and < 10 (Fig. 5)
Table 3.
Cross-tabulation of the old and new symptom groups when the new CAT criterion was applied
| Variable | mMRC grade < 2 andCAT score < 15 | mMRC grade < 2 and CAT score ≥ 15 | mMRC grade ≥ 2 and CAT score < 15 | mMRC grade ≥ 2 and CAT score ≥ 15 | Total |
|---|---|---|---|---|---|
| mMRC grade < 2 & CAT score < 10 | 107 | 0 | 0 | 0 | 107 (25.0a, 100.0b) |
| mMRC grade < 2 & CAT score ≥ 10 | 77 | 65 | 0 | 0 | 142 (33.2a, 44.2c) |
| mMRC grade ≥ 2 & CAT score < 10 | 0 | 0 | 16 | 0 | 16 (3.7a, 5.0c) |
| mMRC grade ≥ 2 & CAT score ≥ 10 | 0 | 0 | 35 | 128 | 163 (38.1a, 50.8c) |
| Total | 184 (43.0a, 100.0b) | 65 (15.2a, 26.6c) | 51 (11.9a, 20.9c) | 128 (29.9a, 52.5c) | 428 (100.0) |
Values are presented as number (%).
CAT, chronic obstructive pulmonary disease (COPD) assessment test; mMRC, modified Medical Research Council.
Percentage among all of the patients.
Percentage among the less symptoms group.
Percentage among the more symptoms group.
Table 4.
Cross-tabulation of the GOLD subgroup (current) and the new GOLD subgroup when the new CAT criterion was applied
| New A | New B | New C | New D | Total | |
|---|---|---|---|---|---|
| Current A | 94 | 0 | 0 | 0 | 94 (22.0) |
| Current B | 66 | 147 | 0 | 0 | 213 (49.8) |
| Current C | 0 | 0 | 13 | 0 | 13 (3.0) |
| Current D | 0 | 0 | 11 | 97 | 108 (25.2) |
| Total | 160 (37.4) | 147 (34.4) | 24 (5.6) | 97 (22.7) | 428 (100.0) |
Values are presented as number (%).
GOLD, Global Initiative for Chronic Obstructive Lung Disease; CAT, chronic obstructive pulmonary disease (COPD) assessment test.
Figure 5.
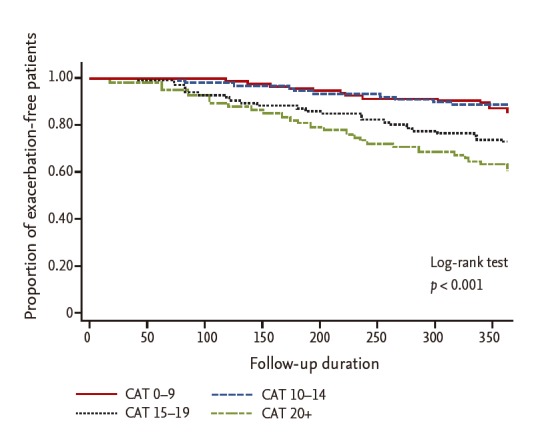
Exacerbation risk during the follow-up period until 1 year according to chronic obstructive pulmonary disease (COPD) assessment test (CAT) score categories.
DISCUSSION
In this study, there were discrepancies between the mMRC criterion (≥ 2 as an indicator of more symptoms) and the CAT criterion (≥ 10 as an indicator of more symptoms) to classify a patient into a symptom group (fewer vs. more symptoms). The CAT criterion was the overwhelming determinant of symptom group classification; only 5.0% of the patients were classified into the more symptoms group based on the mMRC criterion alone, although the FEV1 criterion and exacerbation criterion had comparable roles in determining the risk group (among high-risk patients, 62.0% met the FEV1 criterion and 48.8% met the exacerbation criterion). Thus, the CAT criterion classified more patients into the more symptoms group than the mMRC criterion. This result is consistent with those of other studies. We did not identify any racial difference, although the distribution varied. Among 1,508 COPD patients from the Adelphi Respiratory Disease Specific group, the proportions of patients in subgroups A, B, C, and D when evaluated by CAT were 10%, 49%, 1%, and 40%, and when evaluated by mMRC were 39%, 20%, 13%, and 28%, respectively [15], showing an extremely small fraction for subgroup C when using the CAT criterion. Among 1,817 patients from the Health-Related Quality of Life in European COPD study, the proportions of patients in subgroups A, B, C, and D when evaluated by CAT were 8.1%, 19.2%, 9.1%, and 63.3%, and when evaluated by mMRC were 20.5%, 6.8%, 36.7%, and 35.9%, respectively [16]. These two cohort studies had substantial discrepancies in the distribution of subgroups according to classification by CAT and mMRC criteria, which were similar to those in our study. In our study, in which patients also answered CAT questionnaires, the percentages of patients classified into subgroups A, B, C, and D were 24.5%, 47.2%, 4.2%, and 24.1% by the CAT criterion and 49.3%, 22.4%, 8.9%, and 19.4% by the mMRC criterion, respectively. Although, the COPD Gene study revealed a relatively small difference in subgroup distribution, this study did not use the CAT questionnaire but used SGRQ as a surrogate for CAT instead. Among 4,484 patients, the percentages of patients in subgroups A, B, C, and D were 29.4%, 24.7%, 4.9%, and 41.0% when evaluated by SGRQ (a surrogate for CAT), and 33.6%, 20.5%, 7.9%, and 38.0%, respectively, when evaluated by the mMRC criterion [4]. It is concerning that classification by SGRQ versus CAT produced different results.
To resolve the discrepancy between the mMRC and CAT criteria, there are two possible approaches. First, the cut-off level of the mMRC grade used in categorizing the risk group can be lowered to 1 instead of 2. However, it is well-known that the prognosis between patients with an mMRC grade of 2 and those with an mMRC grade of 0 to 1 differs in large cohort studies (BODE cohort, Swiss Barmelweid cohort, and Spanish Phenotype and Course of COPD cohort) [17,18], suggesting that an mMRC grade of 2 is a more appropriate cut-off level than an mMRC grade of 1. Second, the cut-off level for the CAT score can be raised while keeping the mMRC criterion the same. In fact, the importance of a CAT score of 10 is somewhat arbitrary [19]. In this study, we proposed a new CAT criterion: a patient with a CAT score ≥ 15 was classified into the more symptoms group. This is based on the results of this study, as follows: (1) the CAT score corresponding to a mMRC grade of 2 was 17, which is higher than the former CAT criterion of 10 (Table 2); (2) when the cut-off level of the CAT score was 15, both the sensitivity and specificity were above 70% to predict an mMRC grade ≥ 2 (Fig. 4); (3) decision tree and CART analyses showed that a CAT score ≥ 15 versus < 15 was the best predictor of an mMRC grade ≥ 2 versus < 2 (Fig. 1); and (4) the new criterion revealed a higher discriminant power to predict an mMRC grade ≥ 2 than the former criterion (Fig. 2). Furthermore, during follow-up, patients with CAT scores of 10 to 14 did not have a different risk of exacerbation versus those with a CAT score < 10, while there was a statistically significant difference in exacerbation risk between those with CAT scores of 10 to 14 and those with CAT scores of 15 to 19 (Fig. 5). This also suggests that a CAT score ≥ 15 versus < 15 was a better predictor than a CAT score ≥ 10 versus < 10.
In this study, we used AUROC and CART analyses. CART analysis, a decision-tree methodology, is a non-parametric statistical procedure that identifies mutually exclusive and exhaustive subgroups of a population whose members share common characteristics that influence the dependent variable of interest. It is regarded as a promising research tool for the identification of atrisk persons [20].
The proposed new CAT criterion increased the utility of the mMRC criteria. If the current criterion is applied, the CAT criterion is superior to the mMRC criterion in determining the symptom group. However, when the new CAT criterion was applied, the percentage of patients classified into the more symptoms group based on only the mMRC criterion increased from 5.0% to 20.9% (Table 3). Additionally, the percentage of patients classified into subgroup C increased from 3.0% to 5.6% (Table 4). In the current subgroup classification, a small percentage of patients were classified into subgroup C, suggesting the uselessness of dividing subgroups C and D.
The point could be raised that the new CAT criterion results in underestimating the classification of COPD patients (that is, from B to A and D to C), which might lead to insufficient treatment. In fact, the treatment for early-stage COPD has been highlighted recently [21], and application of the new CAT criterion could cause some patients with early-stage COPD to lose the opportunity for regular treatment. However, unfortunately, it is also true that there is no definite evidence that any regular treatment can modify the disease course in COPD patients, including early-stage, except for smoking cessation [22], although there have been some promising reports [10,23]. It is important to determine when a patient with COPD should be treated. Above all, patients with poorer prognostic factors should be considered for treatment. As mentioned above, there were differences in prognosis between patients with an mMRC grade of 2 and those with an mMRC grade of 0 to 1 [17,18]. However, it has not been recognized whether there is a difference in clinical outcome between patients with an mMRC grade < 2 but a CAT score ≥ 10 and those with an mMRC < 2 and a CAT score < 10. Thus, an mMRC grade of 2 should be considered a more important factor than a CAT score of 10. In addition, over-classification could result in over-estimating the classification and increasing medical costs.
Our study has several limitations. First, the data were reviewed retrospectively. Many patients had not undergone spirometry within the previous year, which led us to exclude about one-fourth of the patients. Second, we did not evaluate the clinical outcome and prognosis among these patients due to the lack of a follow-up period. Third, the history of exacerbation was self-reported, which could raise concerns about recall bias and inaccuracy.
In conclusion, there are discrepancies between mMRC and CAT criteria in identifying patients with more symptoms, and the CAT criterion was the overwhelming determinant of symptom group classification. A CAT score ≥ 15 predicted an mMRC grade ≥ 2 more accurately than the current CAT cut-off, and it predicted the risk of exacerbation during the follow-up period more precisely. When the cut-off level of the CAT criterion was increased from the current level of 10 to 15, this discrepancy was reduced.
KEY MESSAGE
1. There were discrepancies between the modified Medical Research Council (mMRC) criterion and the current chronic obstructive pulmonary disease (COPD) assessment test (CAT) criterion to classify a patient into a symptom group.
2. A CAT score ≥ 15 versus < 15 was a good predictor of a mMRC grade ≥ 2 versus < 2 based on classification and regression tree analysis and area under the receiver operating curve.
3. A CAT score ≥ 15 versus < 15 was a better predictor of severe exacerbation of COPD than a CAT score ≥ 10 versus < 10.
Acknowledgments
Sung-Jun Ko, Nakwon Kwak, Joohae Kim, Won Bae, Ha Youn Lee, Soo Jung Kim, Junghyun Kim, Ju-Hee Park, Ae-Ra Lee, Jung-Kyu Lee, Kyoung Hee Kim, Eun Sun Kim, Tae Yun Park, Keun Bum Chung, Hyo Jae Kang, Seung Jun Lee, Yungjeong Jeong, Sun Mi Choi, Seo Yun Kim, and Yeon Joo Lee contributed to the acquisition, handling, and analysis of the data.
Footnotes
No potential conflict of interest relevant to this article was reported.
REFERENCES
- 1.Global Initiative for Chronic Obstructive Lung Disease Global strategy for the diagnosis, management, and prevention of chronic obstructive pulmonary disease (updated) [Internet]. GOLD. 2013 [cited 2015 Jul 28]. Available from: http://www.goldcopd.org/uploads/users/files/GOLD_Report_2013_Feb20.pdf.
- 2.The Korean Academy of Tuberculosis and Respiratory Diseases . Seoul (KR): KATRD; c2007. Guidelines for chronic obstructive pulmonary disease 2012 [Internet] [cited 2015 Jul 28]. Available from: http://www.lungkorea.org. [Google Scholar]
- 3.Zhou QT, Mei JJ, He B, et al. Chronic obstructive pulmonary disease assessment test score correlated with dyspnea score in a large sample of Chinese patients. Chin Med J (Engl) 2013;126:11–15. [PubMed] [Google Scholar]
- 4.Han MK, Muellerova H, Curran-Everett D, et al. GOLD 2011 disease severity classification in COPDGene: a prospective cohort study. Lancet Respir Med. 2013;1:43–50. doi: 10.1016/S2213-2600(12)70044-9. [DOI] [PMC free article] [PubMed] [Google Scholar]
- 5.Kirkpatrick d P, Dransfield MT. Racial and sex differences in chronic obstructive pulmonary disease susceptibility, diagnosis, and treatment. Curr Opin Pulm Med. 2009;15:100–104. doi: 10.1097/MCP.0b013e3283232825. [DOI] [PubMed] [Google Scholar]
- 6.Dransfield MT, Bailey WC. COPD: racial disparities in susceptibility, treatment, and outcomes. Clin Chest Med. 2006;27:463–471. doi: 10.1016/j.ccm.2006.04.005. [DOI] [PubMed] [Google Scholar]
- 7.Barnes PJ. Genetics and pulmonary medicine. 9. Molecular genetics of chronic obstructive pulmonary disease. Thorax. 1999;54:245–252. doi: 10.1136/thx.54.3.245. [DOI] [PMC free article] [PubMed] [Google Scholar]
- 8.Hegab AE, Sakamoto T, Uchida Y, et al. CLCA1 gene polymorphisms in chronic obstructive pulmonary disease. J Med Genet. 2004;41: doi: 10.1136/jmg.2003.012484. [DOI] [PMC free article] [PubMed] [Google Scholar]
- 9.Ho LI, Harn HJ, Chen CJ, Tsai NM. Polymorphism of the beta(2)-adrenoceptor in COPD in Chinese subjects. Chest. 2001;120:1493–1499. doi: 10.1378/chest.120.5.1493. [DOI] [PubMed] [Google Scholar]
- 10.Celli BR, Thomas NE, Anderson JA, et al. Effect of pharmacotherapy on rate of decline of lung function in chronic obstructive pulmonary disease: results from the TORCH study. Am J Respir Crit Care Med. 2008;178:332–338. doi: 10.1164/rccm.200712-1869OC. [DOI] [PubMed] [Google Scholar]
- 11.Hansel NN, Washko GR, Foreman MG, et al. Racial differences in CT phenotypes in COPD. COPD. 2013;10:20–27. doi: 10.3109/15412555.2012.727921. [DOI] [PMC free article] [PubMed] [Google Scholar]
- 12.Kwon N, Amin M, Hui DS, et al. Validity of the COPD assessment test translated into local languages for Asian patients. Chest. 2013;143:703–710. doi: 10.1378/chest.12-0535. [DOI] [PubMed] [Google Scholar]
- 13.Breiman L, Friedman JH, Olshen RA, Stone CJ. Classification and Regression Trees. Belmont: Wadsworth International Group; 1984. [Google Scholar]
- 14.Pilote L, Miller DP, Califf RM, Rao JS, Weaver WD, Topol EJ. Determinants of the use of coronary angiography and revascularization after thrombolysis for acute myocardial infarction. N Engl J Med. 1996;335:1198–1205. doi: 10.1056/NEJM199610173351606. [DOI] [PubMed] [Google Scholar]
- 15.Small M, Broomfield S, Higgins V. Quantification and treatment patterns of real-world patients classified by the GOLD 2011 strategy. Thorax. 2012;67:A144–A145. [Google Scholar]
- 16.Adamek L, Jones P, Nadeau G, Banik N. GOLD 2011: combined COPD assessment of patients from the European health-related quality of life study. Eur Respir J. 2012;40(Suppl 56):1644. [Google Scholar]
- 17.Celli BR, Cote CG, Marin JM, et al. The body-mass index, airflow obstruction, dyspnea, and exercise capacity index in chronic obstructive pulmonary disease. N Engl J Med. 2004;350:1005–1012. doi: 10.1056/NEJMoa021322. [DOI] [PubMed] [Google Scholar]
- 18.Puhan MA, Garcia-Aymerich J, Frey M, et al. Expansion of the prognostic assessment of patients with chronic obstructive pulmonary disease: the updated BODE index and the ADO index. Lancet. 2009;374:704–711. doi: 10.1016/S0140-6736(09)61301-5. [DOI] [PubMed] [Google Scholar]
- 19.Jones PW, Tabberer M, Chen WH. Creating scenarios of the impact of COPD and their relationship to COPD Assessment Test (CAT) scores. BMC Pulm Med. 2011;11:42. doi: 10.1186/1471-2466-11-42. [DOI] [PMC free article] [PubMed] [Google Scholar]
- 20.Lemon SC, Roy J, Clark MA, Friedmann PD, Rakowski W. Classification and regression tree analysis in public health: methodological review and comparison with logistic regression. Ann Behav Med. 2003;26:172–181. doi: 10.1207/S15324796ABM2603_02. [DOI] [PubMed] [Google Scholar]
- 21.Decramer M, Miravitlles M, Price D, et al. New horizons in early stage COPD: improving knowledge, detection and treatment. Respir Med. 2011;105:1576–1587. doi: 10.1016/j.rmed.2010.12.015. [DOI] [PubMed] [Google Scholar]
- 22.Anthonisen NR, Connett JE, Kiley JP, et al. Effects of smoking intervention and the use of an inhaled anticholinergic bronchodilator on the rate of decline of FEV1: the Lung Health Study. JAMA. 1994;272:1497–1505. [PubMed] [Google Scholar]
- 23.Decramer M, Celli B, Kesten S, et al. Effect of tiotropium on outcomes in patients with moderate chronic obstructive pulmonary disease (UPLIFT): a prespecified subgroup analysis of a randomised controlled trial. Lancet. 2009;374:1171–1178. doi: 10.1016/S0140-6736(09)61298-8. [DOI] [PubMed] [Google Scholar]


