Abstract
Genetic and environmental factors affect white matter connectivity in the normal brain, and they also influence diseases in which brain connectivity is altered. Little is known about genetic influences on brain connectivity, despite wide variations in the brain's neural pathways. Here we applied the “DICCCOL” framework to analyze structural connectivity, in 261 twin pairs (522 participants, mean age: 21.8 y ± 2.7SD). We encoded connectivity patterns by projecting the white matter (WM) bundles of all “DICCCOLs” as a tracemap (TM). Next we fitted an A/C/E structural equation model to estimate additive genetic (A), common environmental (C), and unique environmental/error (E) components of the observed variations in brain connectivity. We found 44 “heritable DICCCOLs” whose connectivity was genetically influenced (a2>1%); half of them showed significant heritability (a2>20%). Our analysis of genetic influences on WM structural connectivity suggests high heritability for some WM projection patterns, yielding new targets for genome-wide association studies.
Keywords: DICCCOL, heritability
1. INTRODUCTION
Genetic and environmental factors contribute to individual differences in brain connectivity, and understanding their contributions is of fundamental importance in neuroscience. For two decades, a large number of studies [2–3, 5–10] have shown moderately high heritability for many brain measures derived from magnetic resonance imaging (MRI), diffusion tensor imaging (DTI) [1], and other neuroimaging methods. Early genetic studies of brain MRI examined gray matter (GM) similarities in pairs of monozygotic (MZ) and dizygotic (DZ) twins [2], and white matter (WM) integrity in the corpus callosum [3]. More recently, genome-wide association studies of over 30,000 individuals [16] have revealed common genetic variants that consistently affect brain structure worldwide. Similar large-scale genetic analyses are also now focusing on DTI [5], relating imaging differences to clinical diagnosis for a range of neuropsychiatric diseases [17–19]. Even so it is crucial to discover which brain measures show significant heritability, to prioritize them for in-depth genetic screens. Some studies have shown moderate to strong genetic effects on DTI derived measures such as FA [5, 10], but we still know little about genetic influences on the structural connectivity of the brain's major neural pathways, which we examine here.
In prior work, we introduced the “tracemap” (TM) model [11] and DICCCOL [12] - novel methods to represent and discover WM connectivity. The tracemap is a computational model that transforms the directional information in the trajectory of an arbitrary WM bundle to a standard spherical surface, for quantitative comparison of structural connectivity patterns. The DICCCOL method identifies a group of cortical surface landmarks in each individual's coordinate space, and a correspondence across different individuals based on WM structural similarity, measured by TM distance. Here we combine the TM approach with the DICCCOL model, to investigate genetic influences on WM pathways in 522 twins. As illustrated in Fig. 1, after preprocessing (section 2.1), 358 DICCCOLs were identified in the twin dataset (section 2.2). Then we calculated the TM offset (section 2.3), defined as the difference between individual TM and the model TM. Finally, we performed an ACE analysis [21] (section 2.4) to estimate the additive genetic (A), common environmental (C), and unique environmental (E) components of variance for the computed TM measures. We detected 44 “heritable DICCCOLs” displaying underlying genetic influences (a2 >1%, p<0.037 after FDR). These DICCCOLs were spread over the whole cortical surface, and included landmarks in the superior, middle and inferior frontal gyri, orbital gyri, sensorimotor areas, temporal lobe and visual cortex. Half of them showed significant heritability (a2>20%) and these were primarily located in the temporal lobes and visual cortices. WM tracts connecting to the “heritable DICCCOLs” with the largest a2 came from the inferior fronto-occipital fasciculus (IFOF). This study offers a new approach to explore genetic influences on brain connectivity, by considering the connection patterns of WM pathways. It also provides promising targets for genome-wide association analyses.
Fig.1.
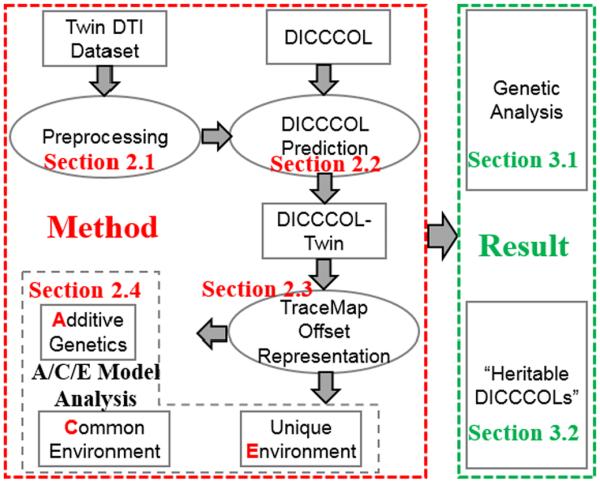
Flowchart of the proposed study.
2. METHODS
2.1. Data acquisition
We analyzed brain DTI data from 261 twin pairs (522 participants, M/F: 196/326, MZ/DZ: 214/308, mean age: 21.8 y ± 2.7SD). Diffusion-weighted images were collected with a 4T Siemens Bruker Medspec MRI scanner, using single-shot echo planar imaging with a twice-refocused spin echo sequence to reduce eddy-current induced distortions. Scan parameters were: 23 cm FOV, TR/TE 6090/91.7 ms, 2-mm axial slice thickness and 1.79 ×1.79 mm2 in-plane resolution. More information on acquisition and preprocessing may be found in [6, 12].
2.2. DICCCOL prediction
DICCCOL is an acronym that stands for Dense Individualized and Common Connectivity-based Cortical Landmarks [12]. It includes 358 cortical landmarks defined in the individual space; each represents the locations that share the most consistent WM wiring patterns across different individuals. Several studies [13–15] have shown that this is an effective and robust ROI modeling framework, which may offer advantages compared to other registration methods [12]. DICCCOL prediction is very similar to the DICCCOL optimization procedure [12] as the cost function also aims to minimize the group-wise variation in structural connectivity, measured by TM [11]. The difference is that we only optimize the locations of DICCCOL candidates that need to be predicted in individual subject. This process may be summarized as:
| (1) |
SM represents the DICCCOL models, SN is the new brain that needs to be predicted, TMDMN is defined as the tracemap distance. We applied the above prediction to all of the 522 twin participants; each of the predicted DICCCOLs yields an automatically computed correspondence across all subjects.
2.3. TraceMap offset representation
After we computed DICCCOLs (locations) on every twin participant, we extracted the WM bundle connecting to each DICCCOL and transformed it as a TM, which may be represented as a vector describing a specific points-distribution. Then we calculated the mean TM () from the model and computed the offset (difference) between twin participants and (Fig. 2). The TM offset (TMO) can be defined as:
| (2) |
S and d are the indices of the participant and DICCCOLs. The calculation of TMO is conducted for each DICCCOL independently. Note that if two participants have similar WM wiring patterns for some DICCCOLs, their TMO will also be similar.
Fig.2.
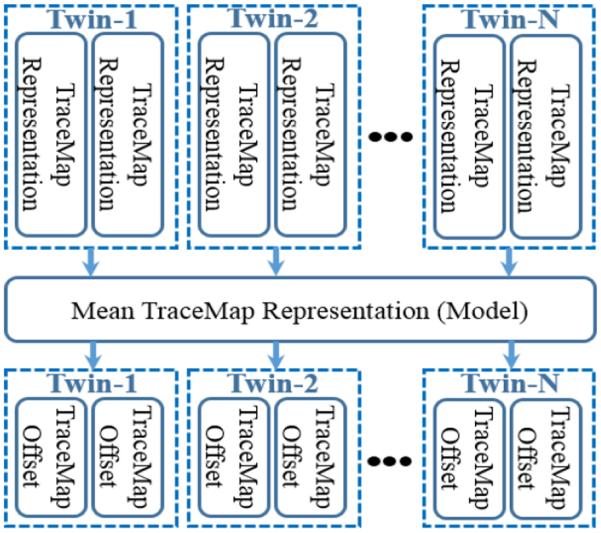
Illustration of tracemap offset for single DICCCOL.
Compared to other DTI-derived scalar measures, such as FA and MD (mean diffusivity), the TM representation can effectively capture the overall wiring patterns in the WM. At the same time, it is not over-sensitive to small variations or noise introduced by tractography errors (i.e., false positive fibers). Hence, it is a promising approach to characterize brain WM connection patterns for genetic analysis.
2.4. Genetic analysis
The classical A/C/E model assumes that the variance in a brain measure (F) can be partitioned into three components: variance due to additive genetic factors (A), shared environment (C), and unshared environment (E) or measurement errors:
| (3) |
In the above formula, a, c and e are the weights of each factor and the total variance of F (a2c2e2) should be one. As we know, MZ twins share all the same genetic variants and the DZ twins, on average, share 50% of their genetic polymorphisms. Both MZ and DZ twins share the same environment (C). Because of this, we can estimate how much additive genetic factors (A) contribute to the variance in the observed variable (F).
The full A/C/E structural equation model, or its simpler sub models (i.e., AE or CE) can be preferred based on their relative goodness-of-fit. Here we modelled the TMO measures (section 2.3) using the full A/C/E model to estimate genetic effects.
Prior studies have shown genetic influences on the volumes of GM [2] and WM structures [5, 10] in the brain. Here, DICCCOL derived TMO measures provide a novel approach to study WM heritability in two respects: 1) the TMO reflects the similarity of WM wiring patterns in 3D space; and 2) DICCCOLs are defined on cortical surface, but they are closely related to the underlying WM structures. Therefore, DICCCOL derived measures (i.e., TMO) have the potential to link the GM and WM features together.
3. RESULTS
3.1. Genetic analysis
We predicted 358 DICCCOLs (Section 2.2) on all the 512 twin participants. For each pair of twins we calculated the tracemap offset (TMO) for each DICCCOL with Eq. 2 (Section 2.3). Then we performed the A/C/E variance components analysis on the TMO. The classical ACE model estimates the proportion of different factors contributing to the observed phenotype measure (here, TMO). We compared the full model (A/C/E) to the simpler AE model, as in [5, 10, 20]. At almost 1/3 of the DICCCOLs (100+), the ACE model showed a better fit than the AE model (p<0.05). That means for those 100+ DICCCOLs, the shared environmental (C) factor was detectable. As such, we chose the full A/C/E model to report our results. To adjust for multiple hypothesis testing, all p-values used to screen DICCCOLs were corrected using the false discovery rate (FDR) [22] (0.037 after correction) at the 5% significance level. We also considered the goodness-of-fit of A/C/E to all DICCCOLs: in structural equation models (SEM), the χ2 (goodness-of-fit) term determines a significance value, which indicates whether the model is a good fit to the data. Hence, we screened all DICCCOLs and only those with good fit (P>0.05) were considered. In total, 44 DICCCOLs were found to be heritable (a2>1%, 95% CI (0–0.03, 0.33–0.72)), and these are subsequently referred to as “heritable DICCCOLs”.
Fig. 3 summarizes the results of the A/C/E analysis. The proportions of A/C/E, a2, c2 and e2, for 44 “heritable DICCCOLs” are shown in Fig. 3(a) as red, orange and blue columns, respectively. Even though unshared environment (E) has significant contributions to many “heritable DICCCOLs”, the additive genetic factor (A) and shared environment (C) also play critical roles. We also showed the a2 and the corresponding 95% confidence interval (CI) as the white triangle and shadow in Fig. 3(b). No CI included zero, but for some of them the lower bounds were close to zero. The distribution of a2 is shown in Fig. 3(c). From the distribution, we can see that the a2 for half of the “heritable DICCCOLs” is larger than 0.2, so they are substantially influenced by genetic factors.
Fig.3.
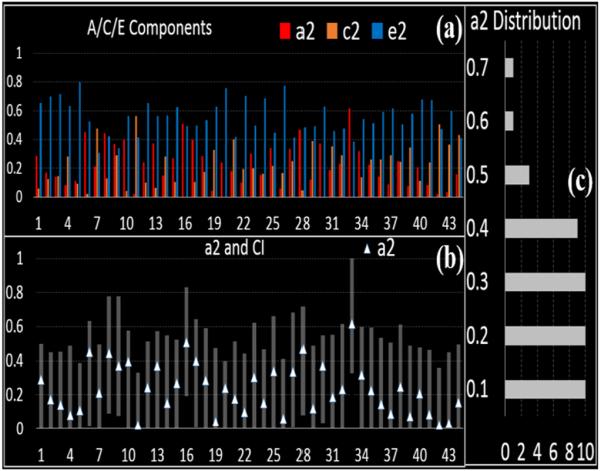
(a) A/C/E components of 44 “heritable DICCCOLs”. (b) The white triangles and the ranges shown represent a2 and the corresponding 95% confidence interval (CI). (c) The distribution of a2 for “heritable DICCCOLs”.
3.2. Visualization of “Heritable DICCCOLs”
As mentioned already, we identified 44 “heritable DICCCOLs” that were influenced by genetic factors (a2>0.1). We projected them onto the cortical surface as shown in Fig. 4(a). The bubbles represent “heritable DICCCOLs” and the colors show the value of a2. In general, these “heritable DICCCOLs” are spread over the whole cortical surface, including superior, middle and inferior frontal gyri, orbital gyri, sensorimotor areas, temporal lobes and the visual cortex. This result is consistent with prior reports that volumes of frontal, sensorimotor and temporal brain regions are significantly influenced by genetic factors [2]. From the color information, we can see that the “heritable DICCCOL” with the highest a2 is located on the middle frontal gyrus (DICCCOL# 255, highlighted by the black arrow) and this DICCCOL is part of the emotional regulation network [12]. Other “heritable DICCCOLs” with relatively high a2 are mainly located in the temporal lobe and visual cortices (highlighted with yellow circles).
Fig.4.
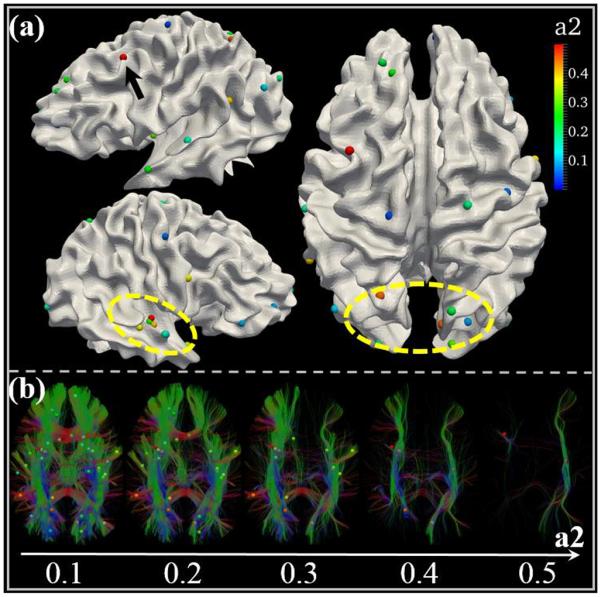
(a) The spatial distribution of “heritable DICCCOLs”. The bubbles represent “heritable DICCCOLs” and the colors reflect the value of a2. The “heritable DICCCOLs” with larger a2 are highlighted with black arrows and yellow circles. (b) A visualization of WM tracts, according to different a2 of “heritable DICCCOLs” they are connected to.
To examine the underlying WM structures, we extracted the WM tracts connecting to these “heritable DICCCOLs”. In Fig. 4(b), we show fiber tracts according to the different a2 for the “heritable DICCCOLs” that they are connected to. For example, the left subfigure shows WM tracts connecting to the “heritable DICCCOLs” with a2 larger than 0.1. The middle WM tracts belong to those with a2 larger than 0.3. The “heritable DICCCOLs” are also displayed accordingly. From this figure, we can clearly identify different WM tracts based on the hierarchy of “heritable DICCCOLs”. The final WM tracts are connected to the “heritable DICCCOLs” with the largest a2 (>0.5). Most of the fibers are from inferior fronto-occipital fasciculus (IFOF). Interestingly, this result is surprisingly consistent with the previous finding that IFOF may be the most heritable tract when considering FA- derived measures [10].
For better understanding the “heritable DICCCOLs” and the corresponding WM bundles, we randomly picked one “heritable DICCCOL” as an example to illustrate its structural connectivity profile, in Fig. 5. This DICCCOL is located at the junction of the temporal and parietal lobes. Each column shows two members of the same twin pair. Based on the figure, we have two observations: first, since we are showing the WM fibers extracted from the same DICCCOL, their overall shape and patterns are very similar. Second, even though there are some differences due to individual structural variability and the tractography method, the WM structural connectivity patterns within the same twin pair (same column) are more consistent compared to the members of other twin pairs. Of course, this cross-twin structural similarity may also be influenced by non-genetic factors. However, for these identified “heritable DICCCOLs”, additive genetic effects clearly play a critical role in influencing WM structural similarity.
Fig. 5.
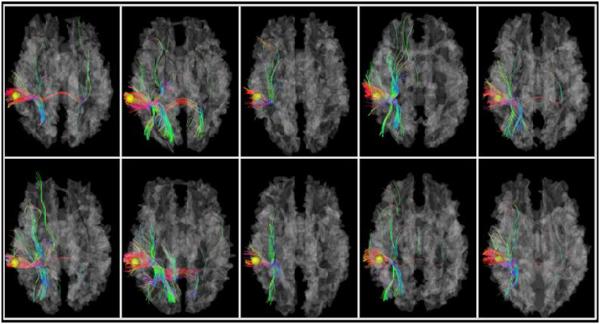
WM structural connectivity profiles for 10 twin participants. The yellow bubbles represent the selected “heritable DICCCOL”, which is located at the junction of the temporal and parietal lobes. Each column shows two subjects who belong to the same twin pair; there are 5 twin pairs in total.
4. CONLUSION
In this paper, we used a novel method to investigate white matter connectivity and its heritability. By applying DICCCOL as the structural foundation, we proposed a new DTI derived measure, TMO, and assessed the extent that genetic and environmental factors that influence it using structural equation modeling (the classical A/C/E twin model). We identified 44 “heritable DICCCOLs” exhibiting significant heritability. Both the spatial distribution patterns of these “heritable DICCCOLs”, and the WM tracts that they connect, are consistent with prior reports of moderately high heritability for GM and WM volumes. Therefore, the proposed method has the potential to link GM and WM features together and further provide promising targets for genome-wide association studies.
ACKNOWLEDGMENTS
This work was supported in part by NIH Big Data to Knowledge (BD2K) Center of Excellence grant U54 EB020403, funded by a cross-NIH consortium including NIBIB and NCI. Data collection was supported by R01 HD050735 and the National Health and Medical Research Council (NHMRC 486682, 1009064).
5. REFERENCES
- [1].Basser PJ, et al. “MR Diffusion Tensor Spectroscopy and Imaging,”. Biophys. J. 1994;66:259–267. doi: 10.1016/S0006-3495(94)80775-1. [DOI] [PMC free article] [PubMed] [Google Scholar]
- [2].Thompson PM, Cannon TD, Narr KL, van Erp T, Poutanen VP, Huttunen M, Lonnqvist J, Standertskjold-Nordenstam CG, Kaprio J, Khaledy M, Dail R, Zoumalan CI, Toga AW. “Genetic influences on brain structure,”. Nat Neurosci. 2001;4:1253–1258. doi: 10.1038/nn758. [DOI] [PubMed] [Google Scholar]
- [3].Pfefferbaum A, Sullivan EV, Carmelli D. “Genetic regulation of regional microstructure of the corpus callosum in late life,”. Neuroreport. 2001;12:1677–1681. doi: 10.1097/00001756-200106130-00032. [DOI] [PubMed] [Google Scholar]
- [4].Stein JL, et al. “Identification of common variants associated with human hippocampal and intracranial volumes,”. Nat Genet. 2012;44:552–561. doi: 10.1038/ng.2250. [DOI] [PMC free article] [PubMed] [Google Scholar]
- [5].Jahanshad N, et al. “Multi-site genetic analysis of diffusion images and voxelwise heritability analysis: a pilot project of the ENIGMA-DTI working group,”. NeuroImage. 2013;81:455–69. doi: 10.1016/j.neuroimage.2013.04.061. [DOI] [PMC free article] [PubMed] [Google Scholar]
- [6].Daianu M, et al. “Left versus right hemisphere differences in brain connectivity: 4-Tesla HARDI tractography in 569 twins,”. IEEE International Symposium on Biomedical Imaging (ISBI) 2012:526–529. doi: 10.1109/ISBI.2012.6235601. [DOI] [PMC free article] [PubMed] [Google Scholar]
- [7].Chiang MC, Barysheva M, Shattuck DW, Lee AD, Madsen SK, Avedissian C, Klunder AD, Toga AW, McMahon KL, de Zubicaray GI, Wright MJ, Srivastava A, Balov N, Thompson PM. “Genetics of brain fiber architecture and intellectual performance,”. J. Neurosci. 2009;29(7):2212–2224. doi: 10.1523/JNEUROSCI.4184-08.2009. [DOI] [PMC free article] [PubMed] [Google Scholar]
- [8].Bohlken MM, Mandl RC, Brouwer RM, van den Heuvel MP, Hedman AM, Kahn RS, Hulshoff Pol HE. “Heritability of structural brain network topology: a DTI study of 156 twins,”. Hum Brain Mapping. 2014;35(10):5295–305. doi: 10.1002/hbm.22550. [DOI] [PMC free article] [PubMed] [Google Scholar]
- [9].Chiang MC, McMahon KL, de Zubicaray GI, Martin NG, Hickie I, Toga AW, Wright MJ, Thompson PM. “Genetics of White Matter Development: A DTI Study of 705 Twins and Their Siblings Aged 12 to 29,”. NeuroImage. 2011;54:2308–2317. doi: 10.1016/j.neuroimage.2010.10.015. [DOI] [PMC free article] [PubMed] [Google Scholar]
- [10].Jahanshad N, Lee AD, Barysheva M, McMahon KL, de Zubicaray GI, Martin NG, Wright MJ, Toga AW, Thompson PM. “Genetic influences on brain asymmetry: a DTI study of 374 twins and siblings,”. Neuroimage. 2010;52:455–469. doi: 10.1016/j.neuroimage.2010.04.236. [DOI] [PMC free article] [PubMed] [Google Scholar]
- [11].Zhu D, Li K, Faraco C, Deng F, Zhang D, Guo L, Miller LS, Liu T. “Optimization of functional brain ROIs via maximization of consistency of structural connectivity profiles,”. NeuroImage. 2011;59(2):1382–1393. doi: 10.1016/j.neuroimage.2011.08.037. [DOI] [PMC free article] [PubMed] [Google Scholar]
- [12].Zhu* D, Li* K, Guo L, Jiang X, Zhang T, Zhang D, Chen H, Deng F, Faraco C, Jin C, Wee C, Yuan Y, Lv P, Yin Y, Hu X, Duan L, Hu X, Han J, Wang L, Shen D, Miller LS, Li L, Liu T. “DICCCOL: Dense Individualized and Common Connectivity-based Cortical Landmarks,”. Cerebral Cortex. 2012;23(4):786–800. doi: 10.1093/cercor/bhs072. [DOI] [PMC free article] [PubMed] [Google Scholar]
- [13].Zhu D, Li K, Terry DP, Puente AN, Wang L, Shen D, Miller LS, Liu T. “Connectome-scale Assessments of Structural and Functional Connectivity in MCI,”. Human Brain Mapping. 2013;35(7):2911–23. doi: 10.1002/hbm.22373. [DOI] [PMC free article] [PubMed] [Google Scholar]
- [14].Li* K, Zhu* D, Guo L, Li Z, Lynch ME, Coles C, Hu** X, Liu** T. “Connectomics Signatures of Prenatal Cocaine Exposure Affected Adolescent Brains,”. Human Brain Mapping. 2012;34(10):2494–510. doi: 10.1002/hbm.22082. [DOI] [PMC free article] [PubMed] [Google Scholar]
- [15].Zhu D, Zhang T, Jiang X, Hu , Yang N, Lv J, Han J, Guo L, Liu T. “Fusing DTI and FMRI Data: A Survey of Methods and Applications,”. NeuroImage. 2013;102(1):184–191. doi: 10.1016/j.neuroimage.2013.09.071. [DOI] [PMC free article] [PubMed] [Google Scholar]
- [16].Hibar D, et al. “Common genetic variants influence human subcortical brain structures”. Nature. 2014 doi: 10.1038/nature14101. in press. [DOI] [PMC free article] [PubMed] [Google Scholar]
- [17].Thompson PM, et al. “The ENIGMA Consortium: large-scale collaborative analyses of neuroimaging and genetic data,”. Brain Imaging and Behavior. 2014;8(2):153–182. doi: 10.1007/s11682-013-9269-5. [DOI] [PMC free article] [PubMed] [Google Scholar]
- [18].Medland SE, Jahanshad N, Neale BM, Thompson PM. “Whole-genome analyses of whole-brain data: working within an expanded search space,”. Nature Neuroscience. 2014;17:791–800. doi: 10.1038/nn.3718. [DOI] [PMC free article] [PubMed] [Google Scholar]
- [19].Hibar D, et al. “Robust subcortical volumetric abnormalities in bipolar disorder: findings from the ENIGMA Bipolar Disorder Working Group.”. Submitted to Molecular Psychiatry. 2014 [Google Scholar]
- [20].Prasad G, et al. “Automatic clustering and population analysis ofwhite matter tracts using maximum density paths,”. NeuroImage. 2014;97:284–95. doi: 10.1016/j.neuroimage.2014.04.033. [DOI] [PMC free article] [PubMed] [Google Scholar]
- [21].Neale M, Baker S, Xie G, Maes H. “Mx: Statistical modeling,”. 6th ed. 2002. [Google Scholar]
- [22].Benjamini Y, Hochberg Y. “Controlling the false discovery rate - a practical and powerful approach to multiple testing,”. J Roy Stat Soc B Met. 1995;57:289–300. [Google Scholar]


