

Abstract
Aims/Introduction
We investigated impacts of the Great East Japan Earthquake on diabetic patients and characterized those with disaster-susceptible diabetes.
Materials and Methods
We enrolled 497 diabetic patients who had been followed at hospitals in devastated areas. We collected metabolic parameters prospectively, 1 and 3 months after the earthquake, and retrospectively for pre-earthquake time-points. Questionnaire surveys were carried out regarding earthquake-related damage and post-earthquake lifestyle alterations. Available data were analyzed to examine associations with post-earthquake glycosylated hemoglobin alterations.
Results
The mean glycosylated hemoglobin level of the participants was not elevated at 1 month, and was significantly decreased at 3 months as compared with the pre-earthquake glycosylated hemoglobin. There were no significant differences in earthquake-related damage or lifestyle alterations between the improved and worsened glycemic control groups according to the data obtained from the questionnaire survey. As reported, fasting serum C-peptide levels were significantly lower in the worsened glycemic control group (P < 0.05). Notably, plasma noradrenaline levels were significantly higher in the worsened glycemic control group (P < 0.05). Furthermore, at 1 month after the earthquake, the plasma noradrenaline level was significantly higher in the low C-peptide group (fasting serum C-peptide <1.0 ng/mL) than in the high C-peptide group (fasting serum C-peptide ≥1.0 ng/mL), but this difference had disappeared by 3 months after the earthquake. These findings show that post-earthquake plasma noradrenaline levels were temporarily increased in the low C-peptide group.
Conclusions
Sympathetic nerve activation might be elicited more easily in subjects with lower endogenous insulin secretory capacity, and could be involved in the mechanism underlying post-earthquake worsening of glycemic control.
Keywords: Glycemic control, Natural disaster, Sympathetic activation
Introduction
In March 2011, the Tohoku district of Japan suffered from a mega-earthquake, the Great East Japan Earthquake, and the region of the Tohoku district facing the Pacific Ocean was struck by a huge tsunami triggered by this earthquake. Miyagi and Fukushima prefectures were extensively damaged by this calamity, and more than 18,000 people died or remain missing and more than 400,000 people had to be evacuated. Furthermore, severe shortages of food and other daily supplies as a result of transport disruptions occurred after the earthquake.
Previous reports have shown that, after natural disasters, glycemic control of diabetic patients deteriorates1–6. However, when we treated a large diabetic outpatient population affected by the Great East Japan Earthquake, we noticed that alterations of glycemic control after the earthquake varied markedly among patients. To identify the population of diabetic patients whose glycemic control is vulnerable in the aftermath of a natural disaster, we recently carried out a prospective study. We prospectively examined alterations in metabolic parameters including blood glucose, glycosylated hemoglobin (HbA1c), bodyweight, clinical systolic blood pressure and fasting serum C-peptide levels, at 1 and 3 months after the Great East Japan Earthquake, in 497 diabetic outpatients treated in hospitals located in devastated areas of Miyagi and Fukushima prefectures. In addition, we carried out questionnaire surveys of the study participants regarding earthquake-related damage and post-earthquake lifestyle alterations, including flooding from the tsunami, damage to homes, evacuation, loss of relatives and alterations in food intake, exercise, alcohol consumption, tobacco smoking, and sleep time, and we analyzed the relationship of each of these items with post-earthquake alterations in glycemic control. By using this Great East Japan Earthquake database, we clarified that post-earthquake worsening of glycemic control correlated strongly with the endogenous insulin secretory capacity of diabetic patients, indicating serum C-peptide levels to be a biological marker predicting those who have disaster-susceptible diabetes7. Herein, we further analyzed a large amount of detailed data from the Great East Japan earthquake database to characterize disaster-susceptible diabetic patients with impaired insulin secretory capacity.
Materials and Methods
Study Population
The present study was approved by the ethics committees of Tohoku University Hospital, Tohoku Pharmaceutical University Hospital, Osaki Citizen Hospital, Minami Tohoku Hospital, South Miyagi Medical Center, Sendai Teisin Hospital, JR Sendai Hospital, Kurihara Central Hospital, Izumi Hospital, Shiogama City Hospital, Saka General Hospital, Kanagami Hospital, Marumori Hospital, Ayashi Heart Clinic, Sendai Red Cross Hospital, Soma Central Hospital and Ohta General Hospital, all of which are located in devastated areas of Miyagi and Fukushima prefectures (Figure 1a). Informed consent was obtained from each participant. The participants of the present study were enrolled from patients who had been followed at the Department of Diabetes and Metabolism in Tohoku University Hospital and the other participating hospitals.
Figure 1.
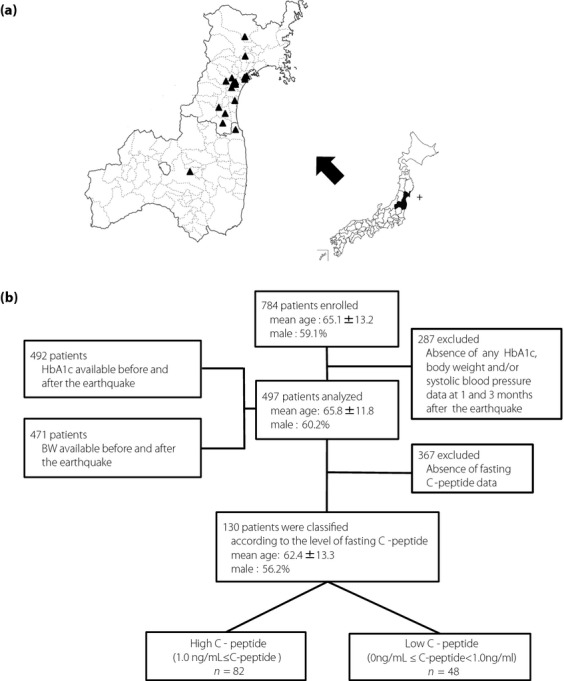
(a) Map showing the epicenter of the earthquake and hospitals participating in the present study. +, Epicenter; ▲, hospitals participating in the present study. (b) Study population. HbA1c, glycosylated hemoglobin.
We excluded subjects who were under the age of 20 years at the time of the earthquake, with interruption of hospital visits during the study period and/or who had received treatment for a severe mental disorder. Ultimately, 784 eligible subjects were enrolled. The mean age of these participants was 65.1 ± 13.2 years, and 59.1% were male. We examined parameters in these participants before (the latest time-point during the period from January through March of 2011) 1 month after (from 4 April to 15 April of 2011) and 3 months after (from June through July of 2011) the earthquake. Of these subjects, 287 were excluded due to lack of HbA1c, bodyweight and/or clinical systolic blood pressure data at 1 month and/or 3 months after the earthquake. As a consequence, data from 497 participants including 3.8% of type 1 diabetic patients were available for statistical analysis. The HbA1c levels both before and after the earthquake were available for 492 participants, and bodyweight data both before and after the earthquake were available for 471. We classified the 497 participants into two groups in which post-earthquake glycemic control showed improvement or worsening as compared with pre-earthquake levels. Participants whose HbA1c values were increased (ΔHbA1c > 0) and decreased (or were unchanged; ΔHbA1c ≤ 0) at 1 month after the earthquake as compared with pre-earthquake levels were defined as the worsened and improved glycemic control groups, respectively. Among 497 participants, fasting serum C-peptide levels were available for 130 including 14.6% of type 1 diabetic patients. We classified these participants into high and low C-peptide groups according to their fasting serum C-peptide levels (Figure 1b).
Laboratory and Physical Examinations
We prospectively monitored HbA1c, bodyweight, clinical systolic blood pressure, several blood parameters including C-peptide, cortisol, catecholamines, hematological values, liver enzymes, lipids, markers of renal functions, uric acid, serum proteins, electrolytes and C-reactive protein, and urinary albumin excretion in these participants at 1 and 3 months after the earthquake, and compared the values obtained with those measured during pre-earthquake periods; that is, at the latest examination time-point during the period from January to March 2011. To compare HbA1c and bodyweight alterations between the pre- and post-earthquake time-points, we retrospectively collected the HbA1c and bodyweight data for pre-earthquake time-points from medical records. HbA1c values were converted from the Japanese Diabetes Society values into National Glycohemoglobin Standardization Program equivalent values.
Questionnaires
We carried out questionnaire surveys of the study participants regarding earthquake-related damage and post-earthquake lifestyle alterations.
Statistical Analysis
Continuous variables were expressed as means ± standard deviation, and categorical variables were expressed as percentages. Post-earthquake alterations in HbA1c, bodyweight and clinical systolic blood pressure, as compared with pre-earthquake values, were analyzed using Student's t-tests. Each parameter was compared between the worsened and improved glycemic control groups using Student's t-tests. Each of these parameters was also compared between the high and low C-peptide groups by Student's t-tests. We carried out analysis of covariance after adjustment for factors including sex, age and pre-earthquake bodyweight to compare post-earthquake alterations in HbA1c and clinical systolic blood pressure, vs pre-earthquake levels, between the high and low C-peptide groups. The questionnaire results were analyzed using the χ2-test. All statistical analyses were carried out using Statistical Analysis System version 9.3 (SAS Institute Inc., Cary, NC, USA). Differences were considered to be statistically significant at P < 0.05.
Results
Comparison of Pre- and Post-Earthquake Parameters
We studied 784 patients followed at hospitals located in devastated areas of Miyagi and Fukushima prefectures. We prospectively monitored HbA1c and bodyweight in these participants at 1 and 3 months after the earthquake, and compared the values obtained with those measured during pre-earthquake periods; that is, at the latest examination time-point during the period from January to March 2011. Of these participants, both HbA1c and bodyweight 1 and 3 months after the earthquake were available in 497 (Figure 1b). Table 1 shows the pre- and post-earthquake parameters examined in these 497 participants. As we collected the pre-earthquake HbA1c and bodyweight data retrospectively, data were lacking for a number of pre-earthquake parameters. In particular, the available clinical blood pressure and fasting C-peptide level data before the earthquake were limited. Among all 497 study participants, 60.2% were male and their mean age was 65.8 ± 11.8 years. Of these 497 patients, 464 received medications for diabetes and 330 were receiving medications for hypertension. Unexpectedly, the mean HbA1c level of the participants was not elevated at 1 month, and was significantly decreased at 3 months as compared with the pre-earthquake HbA1c value. Pre-earthquake bodyweight was 65.9 ± 14.3 kg, and showed significant reductions to 65.3 ± 14.0 and 65.3 ± 14.2 kg at 1 and 3 months after the earthquake, respectively. Fasting serum C-peptide levels at 1 and 3 months after the earthquake were available for 130 of the 497 participants (Figure 1b), and were 1.7 ± 1.5 and 1.7 ± 1.6 ng/mL, respectively. Thus, there were no significant alterations in fasting serum C-peptide levels during the study period.
Table 1.
Characteristics of 497 participants before the earthquake, and time-courses of glycosylated hemoglobin, bodyweight, clinical systolic blood pressure and fasting serum C-peptide levels
| n = 497 | Before the earthquake | One month after the earthquake | Three months after the earthquake |
|---|---|---|---|
| Male (%) | 60.2 | ||
| Age (years) | 65.8 ± 11.8 | ||
| HbA1c (%) | 7.3 ± 1.1 (n = 492) | 7.3 ± 1.0 | 7.2 ± 1.0**,† |
| BW (kg) | 65.9 ± 14.3(n = 471) | 65.3 ± 14.0* | 65.3 ± 14.2** |
| Clinical SBP (mmHg) | 134.2 ± 15.9 | 130.3 ± 15.2† | |
| Medication for diabetes (%) | 93.6 | ||
| Medication for hypertension (%) | 66.7 | ||
| Fasting serum C-peptide level, ng/mL (n = 130) | 1.7 ± 1.5 | 1.7 ± 1.6 |
Data are presented as means ± standard deviation or ratios (%). The paired test was used for analysis of continuous variables.
P < 0.05, before vs 1 month after the earthquake.
P < 0.05, before vs 3 months after the earthquake.
P < 0.05, 1 month vs 3 months after the earthquake.
BW, bodyweight; SBP, systolic blood pressure.
Evaluation of Earthquake-Related Damage and Post-Earthquake Lifestyle Alterations
To estimate the impact of the earthquake on our participants, we carried out a questionnaire survey to ascertain earthquake-related damage and post-earthquake lifestyle alterations, followed by analyzing the available responses to each question. To assess earthquake-related damage, we asked questions about flooding from the tsunami, damage to homes, evacuation to refuges and the loss of relatives. As to post-earthquake lifestyle alterations, we asked whether there had been changes in meal quantities, meal compositions, amounts of exercise, amounts of alcohol consumed and tobacco smoking, and sleep time, as well as whether or not drug treatments had been interrupted (Table 2). Of all study participants, 9.8% were exposed to brine from the tsunami, 49.3% experienced damage to their homes including 25.0% with massive damage, 12.2% were forced to evacuate to places of refuge, 28.9% experienced the loss of relatives and 2.8% lost their jobs. Meal quantities were reported to have decreased by 33.6% of participants, and 40.4% felt that meal compositions had been altered after the earthquake (Table 2). The amount of exercise was decreased for 21.1% of the participants. It should be noted that just 8.6% of the participants had experienced an interruption in their antidiabetes medication regimens in the present study population.
Table 2.
Questionnaire results for 497 participants
| Flooding from the tsunami, % (n = 366) | Yes 9.8 | No 90.2 | |
| Home loss/damage, % (n = 349) | Yes 49.3 More than half 25.0 Half or less 75.0 | No 50.7 | |
| Evacuation to refuge, % (n = 361) | Yes 12.2 | No 87.8 | |
| Loss of relatives, % (n = 367) | Yes 28.9 | No 71.1 | |
| Job loss, % (n = 357) | Yes 2.8 | No 97.2 | |
| Change in meal amount, % (n = 357) | Increase 5.3 | Decrease 33.6 | Unchanged 61.1 |
| Change in meal composition, % (n = 366) | Yes 40.4 | None 59.6 | |
| Change in exercise amount, % (n = 361) | Increase 15.5 | Decrease 21.1 | Unchanged 63.4 |
| Change in drinking amount, % (n = 361) (Non-drinker, n = 197) | Increase 1.7 | Decrease 12.2 | Unchanged 31.6 |
| Change in smoking amount, % (n = 352) (Non-smoker, n = 276) | Increase 1.7 | Decrease 5.1 | Unchanged 14.8 |
| Change in sleep time, % (n = 361) | Increase 4.4 | Decrease 35.2 | Unchanged 60.4 |
| Interruption of drug(s), % (n = 360) | Yes 8.6 | None 91.4 |
Data are presented as ratios (%).
Comparison of Questionnaire Items and Metabolic Parameters Between the Improved and Worsened Glycemic Control Groups
Next, to identify factors involved in worsening glycemic control, we divided these participants into two groups; that is, the improved and worsened glycemic control groups, based on changes in HbA1c. We compared earthquake-related damage and lifestyle alterations between these two groups using data collected with the questionnaire. Antidiabetes medication interruption ratios were similar in the two groups of participants. Unexpectedly, we failed to detect any significant differences in earthquake-related damage or lifestyle alterations between the improved and worsened glycemic control groups (Table 3).
Table 3.
Questionnaire results for the improved and worsened glycemic control groups
| ΔHbA1c ≤ 0 | ΔHbA1c > 0 | P | |
|---|---|---|---|
| n | 290 | 207 | |
| Flooding from the tsunami, % (n = 366) | 11.4 | 7.5 | 0.3 |
| Home loss/damage (over half), % (n = 349) | 13.5 | 10.6 | 0.5 |
| Evacuation to refuge, % (n = 361) | 12.1 | 12.3 | 1.0 |
| Loss of relatives, % (n = 367) | 27.4 | 31.1 | 0.5 |
| Job loss, % (n = 357) | 4.1 | 0.7 | 0.1 |
| Reduction of meal amount, % (n = 357) | 30.2 | 38.7 | 0.1 |
| Change in meal composition, % (n = 366) | 39.7 | 41.5 | 0.7 |
| Reduction of exercise, % (n = 361) | 21.3 | 20.7 | 1.0 |
| Reduction of alcohol consumption, % (n = 361) (Non-drinker, n = 197) | 12.7 | 11.5 | 0.9 |
| Reduction of smoking, % (n = 352) (Non-smoker, n = 276) | 4.3 | 6.3 | 0.5 |
| Reduction of sleep time, % (n = 361) | 36.5 | 33.1 | 0.6 |
| Interruption of drug(s), % (n = 360) | 8.4 | 9.0 | 0.9 |
Data are presented as ratios (%). A χ2-test was applied for analysis of categorical variables. ΔHbA1c, the amount of glycosylated hemoglobin change at 1 month after the earthquake vs before the earthquake; ΔHbA1c ≤ 0, improved glycemic control group; ΔHbA1c > 0, worsened glycemic control group.
We also compared other parameters, including sex, age, pre-earthquake HbA1c, pre-earthquake bodyweights, ratios of the participants receiving medications for diabetes and/or hypertension, and blood metabolic parameters, including serum lipids and hormones, at 1 month after the earthquake between the improved and worsened glycemic control groups (Table 4). As we previously reported7, C-peptide levels were significantly lower in the worsened glycemic control group. Further analysis showed that pre-earthquake bodyweights were significantly lower in the worsened glycemic control group, which is consistent with the previously documented correlation between low fasting serum C-peptide levels and low bodyweights8. Male-to-female ratios, age, and ratios of the participants receiving medications for diabetes and/or hypertension were similar. Importantly, ratios of the participants receiving insulin treatments were also similar in the two groups. Pre-earthquake HbA1c values were significantly higher in the improved glycemic control group. Notably, plasma noradrenaline levels were significantly higher in the worsened than in the improved glycemic control group.
Table 4.
Comparison of blood and urinary parameters at 1 month after the earthquake between the improved and worsened glycemic control groups
| ΔHbA1c ≤ 0 | ΔHbA1c > 0 | P | |
|---|---|---|---|
| n | 290 | 207 | |
| Male (%) | 60.0 | 60.4 | 1.0 |
| Age (years) | 65.3 ± 12.4 | 66.6 ± 11.0 | 0.2 |
| HbA1c, %† (n = 492) | 7.5 ± 1.1 | 7.1 ± 1.0 | <0.05 |
| Medication for diabetes, % (n = 496) | 93.8 | 93.2 | 0.9 |
| Receiving insulin treatments, % (n = 468) | 42.2 | 42.5 | 1.0 |
| Medication for hypertension, % (n = 495) | 69.2 | 63.1 | 0.2 |
| BW, kg† (n = 471) | 67.5 ± 15.0 | 63.7 ± 13.0 | <0.05 |
| Fasting serum C-peptide level, ng/mL (n = 130) | 2.1 ± 1.6 | 1.3 ± 1.2 | <0.05 |
| Serum cortisol, μg/dL (n = 102) | 9.5 ± 4.0 | 9.9 ± 3.4 | 0.6 |
| Plasma adrenaline, ng/mL (n = 102) | 0.04 ± 0.03 | 0.05 ± 0.03 | 0.3 |
| Plasma noradrenaline, ng/mL (n = 102) | 0.43 ± 0.15 | 0.53 ± 0.24 | <0.05 |
| Plasma dopamine, ng/mL (n = 102) | 0.02 ± 0.01 | 0.02 ± 0.01 | 0.7 |
| White blood cells, 103/μL (n = 237) | 6.3 ± 1.9 | 6.0 ± 1.8 | 0.2 |
| Red blood cells, 106/μL (n = 237) | 442.4 ± 56.5 | 436.5 ± 48.3 | 0.4 |
| Hemoglobin, g/dL (n = 237) | 13.4 ± 1.8 | 13.4 ± 1.5 | 1.0 |
| Platelets, 103/μL (n = 236) | 21.5 ± 7.2 | 21.4 ± 5.4 | 0.9 |
| Serum aspartate aminotransferase, U/L (n = 378) | 25.4 ± 12.0 | 24.6 ± 10.7 | 0.5 |
| Serum alanine aminotranferase, U/L (n = 377) | 25.8 ± 19.8 | 24.4 ± 15.7 | 0.4 |
| Serum γ-glutamyl transpeptidase, IU/L (n = 336) | 41.2 ± 55.2 | 41.6 ± 68.6 | 1.0 |
| Serum alkaline phosphatase, U/L (n = 275) | 234.4 ± 99.7 | 245.7 ± 79.2 | 0.3 |
| Serum lactate dehydrogenase, U/L (n = 268) | 200.2 ± 41.8 | 192.1 ± 31.9 | 0.1 |
| Serum total cholesterol, mg/dL (n = 393) | 183.8 ± 29.7 | 189.1 ± 33.2 | 0.1 |
| Serum HDL-cholesterol, mg/dL (n = 434) | 57.3 ± 17.2 | 58.3 ± 16.3 | 0.5 |
| Serum LDL-cholesterol, mg/dL (n = 424) | 105.4 ± 26.1 | 106.3 ± 27.1 | 0.7 |
| Serum triglyceride, mg/dL (n = 434) | 126.4 ± 69.6 | 126.8 ± 72.5 | 0.9 |
| Serum blood urea nitrogen, mg/dL (n = 368) | 15.3 ± 4.9 | 16.5 ± 6.2 | 0.1 |
| Serum creatinine, mg/dL (n = 379) | 0.8 ± 0.3 | 0.8 ± 0.3 | 0.6 |
| Serum uric acid, mg/dL (n = 341) | 5.2 ± 1.5 | 5.1 ± 1.4 | 0.5 |
| Serum total protein, g/dL (n = 66) | 7.3 ± 0.6 | 7.1 ± 0.5 | 0.3 |
| Serum albumin, g/dL (n = 64) | 4.1 ± 0.3 | 3.9 ± 0.5 | 0.1 |
| Serum sodium, mEq/L (n = 206) | 140.8 ± 2.2 | 140.4 ± 2.7 | 0.3 |
| Serum potassium, mEq/L (n = 208) | 4.4 ± 0.5 | 4.4 ± 0.4 | 1.0 |
| Serum chloride, mEq/L (n = 203) | 103.4 ± 2.7 | 103.3 ± 2.7 | 0.9 |
| Serum C-reactive protein, mg/dL (n = 22) | 0.4 ± 0.4 | 0.6 ± 0.6 | 0.2 |
| Urinary albumin excretion, mg/g•cre (n = 103) | 114.6 ± 200.4 | 62.2 ± 171.5 | 0.2 |
Data are presented as means ± standard deviation or ratios (%). Student's t-test was used for analysis of continuous variables. A χ2-test was applied for analysis of categorical variables.
Values before the earthquake.
ΔHbA1c, the amount of glycosylated hemoglobin change at 1 month after the earthquake vs before the earthquake; ΔHbA1c ≤ 0, improved glycemic control group; ΔHbA1c > 0, worsened glycemic control group; BW, bodyweight; HDL, high-density lipoprotein; LDL, low-density lipoprotein.
Characterization of Highly Disaster-Susceptible Diabetic Patients with Impaired Insulin Secretory Capacity
We recently clarified post-earthquake worsening of glycemic control to correlate strongly with the endogenous insulin secretory capacity of diabetic patients. This finding showed serum C-peptide levels to be a biological marker predicting highly disaster-susceptible diabetic patients7. Therefore, to characterize disaster-susceptible diabetic patients with impaired insulin secretory capacity, we next aimed to examine post-earthquake alterations of several parameters in groups based on their fasting serum C-peptide levels. According to a previous study9, we classified 130 participants, whose fasting serum C-peptide levels 1 month after the earthquake were available, into high C-peptide (fasting serum C-peptide level ≥1.0 ng/mL) and low C-peptide (fasting serum C-peptide level <1.0 ng/mL) groups (Figure 1b). Mean fasting serum C-peptide levels of the high and low C-peptide groups were 2.5 ± 1.4 and 0.4 ± 0.4 ng/mL, respectively (Table 5). The questionnaire items; that is, earthquake-related damage, including flooding from the tsunami, damage to homes, evacuation to refuges and loss of relatives, and life style alterations, including job loss, altered amounts and compositions of meals, amounts of exercise, alcohol consumption, tobacco smoking, sleep time, and interruption of antidiabetes medication regimens, did not differ significantly between the two groups (Table 5). As we previously reported7, post-earthquake glycemic control in the low C-peptide group showed greater deterioration than that in the high C-peptide group (Table 5). Consistently, glycemic control of type 1 diabetic patients deteriorated significantly from the pre-earthquake level of 7.8 to 8.2% after the earthquake (P = 0.009).
Table 5.
Comparison of blood and urinary parameters at 1 month after the earthquake between the high and low C-peptide groups
| High C-peptide | Low C-peptide | P | |
|---|---|---|---|
| n | 82 | 48 | |
| Male (%) | 58.5 | 52.1 | 0.6 |
| Age (years) | 62.8 ± 12.6 | 61.8 ± 14.5 | 0.7 |
| HbA1c, %† (n = 128) | 7.5 ± 1.2 | 7.6 ± 1.2 | 0.7 |
| ΔHbA1c*, % 1 month after the earthquake – before the earthquake (n = 128) | −0.1 ± 0.1 | 0.1 ± 0.1 | <0.05 |
| BW, kg† (n = 115) | 71.2 ± 19.9 | 58.8 ± 12.3 | <0.05 |
| Clinical SBP 1 month after earthquake, mmHg (n = 130) | 130.7 ± 14.8 | 126.8 ± 18.2 | 0.2 |
| Clinical SBP 3 months after earthquake, mmHg (n = 130) | 130.2 ± 15.0 | 124.5 ± 18.3 | 0.1 |
| Δ clinical SBP*, mmHg (1 month after the earthquake – 3 months after the earthquake) | 0.9 ± 1.7 | 2.5 ± 2.2 | 0.3 |
| Fasting serum C-peptide level 1 month after earthquake, ng/mL (n = 130) | 2.5 ± 1.4 | 0.4 ± 0.4 | <0.05 |
| Fasting serum C-peptide level 3 months after earthquake, ng/mL (n = 115) | 2.4 ± 1.6 | 0.5 ± 0.5 | <0.05 |
| Serum cortisol, μg/dL (n = 101) | 9.7 ± 3.8 | 9.5 ± 3.5 | 0.8 |
| Plasma adrenaline 1 month after earthquake, ng/mL (n = 101) | 0.04 ± 0.03 | 0.05 ± 0.03 | 0.2 |
| Plasma noradrenaline 1 month after earthquake, ng/mL (n = 101) | 0.45 ± 0.19 | 0.53 ± 0.22 | <0.05 |
| Plasma noradrenaline 3 months after the earthquake, ng/mL (n = 101) | 0.43 ± 0.22 | 0.47 ± 0.21 | 0.4 |
| Plasma dopamine, ng/mL (n = 101) | 0.01 ± 0.01 | 0.02 ± 0.02 | 0.2 |
| White blood cells, 103/μL (n = 73) | 7.0 ± 2.1 | 5.4 ± 1.3 | <0.05 |
| Red blood cells, 106/μL (n = 73) | 430.4 ± 48.8 | 420.7 ± 35.5 | 0.4 |
| Hemoglobin, g/dL (n = 73) | 13.3 ± 1.5 | 13.0 ± 1.6 | 0.5 |
| Platelets, 103/μL (n = 73) | 21.7 ± 5.6 | 20.4 ± 4.9 | 0.3 |
| Serum aspartate aminotransferase, U/L (n = 102) | 23.3 ± 11.8 | 24.2 ± 7.9 | 0.6 |
| Serum alanine aminotranferase, U/L (n = 101) | 26.5 ± 21.4 | 20.4 ± 8.5 | <0.05 |
| Serum γ-glutamyl transpeptidase, IU/L (n = 84) | 37.8 ± 25.7 | 49.0 ± 103.9 | 0.6 |
| Serum alkaline phosphatase, U/L (n = 50) | 218.4 ± 53.7 | 326.4 ± 192.1 | <0.05 |
| Serum lactate dehydrogenase, U/L (n = 52) | 195.0 ± 44.2 | 195.4 ± 37.1 | 1.0 |
| Serum total cholesterol, mg/dL (n = 117) | 186.8 ± 37.0 | 193.5 ± 35.1 | 0.3 |
| Serum HDL-cholesterol, mg/dL (n = 121) | 52.2 ± 12.3 | 63.7 ± 16.7 | <0.05 |
| Serum LDL-cholesterol, mg/dL (n = 121) | 108.2 ± 31.4 | 105.1 ± 28.9 | 0.6 |
| Serum triglyceride, mg/dL (n = 122) | 139.9 ± 81.3 | 106.0 ± 58.5 | <0.05 |
| Serum blood urea nitrogen, mg/dL (n = 104) | 15.0 ± 5.4 | 14.5 ± 4.2 | 0.7 |
| Serum creatinine, mg/dL (n = 113) | 0.9 ± 0.4 | 0.7 ± 0.1 | <0.05 |
| Serum uric acid, mg/dL (n = 89) | 5.6 ± 1.3 | 4.8 ± 1.4 | <0.05 |
| Serum total protein, g/dL (n = 29) | 7.1 ± 0.4 | 7.3 ± 0.7 | 0.4 |
| Serum albumin, g/dL (n = 29) | 3.9 ± 0.4 | 3.8 ± 0.5 | 0.4 |
| Serum sodium, mEq/L (n = 51) | 141.3 ± 2.1 | 140.1 ± 2.8 | 0.1 |
| Serum potassium, mEq/L (n = 51) | 4.3 ± 0.3 | 4.2 ± 0.4 | 0.2 |
| Serum chloride, mEq/L (n = 51) | 104.4 ± 2.8 | 102.9 ± 2.2 | 0.1 |
| Serum C-reactive protein, mg/dL (n = 13) | 0.7 ± 0.5 | 0.3 ± 0.3 | 0.1 |
| Urinary albumin excretion, mg/g•Cre (n = 69) | 75.4 ± 126.3 | 46.2 ± 69.9 | 0.2 |
| Flooding from the tsunami, % (n = 96) | 10.3 | 7.9 | 1.0 |
| Home loss/damage (over half), % (n = 92) | 15.1 | 10.3 | 0.5 |
| Evacuation to refuge, % (n = 92) | 16.7 | 10.5 | 0.5 |
| Loss of relatives, % (n = 98) | 33.9 | 20.5 | 0.2 |
| Job loss, % (n = 95) | 6.9 | 0.0 | 0.2 |
| Decreased meal quantity, % (n = 97) | 48.3 | 35.9 | 0.3 |
| Change in meal composition, % (n = 98) | 55.9 | 46.2 | 0.4 |
| Reduced exercise, % (n = 97) | 36.2 | 18.0 | 0.1 |
| Reduced alcohol consumption, % (n = 97) Non-drinker (n = 55) | 15.5 | 7.7 | 0.4 |
| Reduced smoking, % (n = 96) Non-smoker (n = 79) | 3.5 | 2.6 | 1.0 |
| Reduced sleep time, % (n = 96) | 47.4 | 41.0 | 0.7 |
| Interruption of drug(s), % (n = 96) | 12.3 | 15.4 | 0.8 |
Data are presented as means ± standard deviation or ratios (%). Student's t-test was used for analysis of continuous variables. A χ2-test was applied for analysis of categorical variables.
Analysis of covariance after adjustment for factors including sex, age and pre-earthquake bodyweight was used for the amount of glycosylated hemoglobin (HbA1c) change at 1 month after the earthquake vs pre-earthquake value (ΔHbA1c) and Δ clinic systolic blood pressure (SBP) data.
Values before the earthquake.
Δ clinical SBP, amount of clinic systolic blood pressure change at 1 month after the earthquake vs 3 months after the earthquake. Fasting C-peptide level, fasting C-peptide levels at 1 month after the earthquake; High C-peptide group: fasting C-peptide ≥1.0 ng/mL; Low C-peptide group, fasting C-peptide <1.0 ng/mL. BW, bodyweight; HDL, high-density lipoprotein; LDL, low-density lipoprotein.
Notably, plasma noradrenaline at 1 month after the earthquake was significantly higher in the low than in the high C-peptide group. In contrast, at 3 months after the earthquake, plasma noradrenaline in the low C-peptide group had decreased to a level similar to that in the high C-peptide group, while fasting C-peptide levels still differed markedly different between these two groups (Table 5). Thus, plasma noradrenaline levels were temporarily increased in the low C-peptide group. These findings suggest that patients with impaired insulin secretory capacity are prone to sympathetic activation, which might be involved in the observed worsening of their glycemic control.
Discussion
In the present study, unexpectedly, the mean post-earthquake HbA1c value was lower than that measured during the pre-earthquake period in the entire study group of 497 participants (Table 1). Glycemic control of diabetic patients was previously reported to worsen after natural disasters1–6. Ogawa et al.10 reported worsening of glycemic control after the Great East Japan Earthquake in 63 patients with diabetes living in coastal areas. In their study, 44% of the subjects were affected by the tsunami. The loss of medical information as a result of the tsunami, and prescription of less effective medications after the disaster were hypothesized to be factors contributing to the worsening glycemic control in their study. However, when we treated many diabetic outpatients affected by the disaster, we noticed that alterations of glycemic control after the earthquake varied considerably among patients, and that this variation did not always appear to be attributable to these social factors. Therefore, we searched for other possible causes, including both social and biological factors, which might explain the variation of glycemic control among afflicted patients. The present study population was widely dispersed throughout the devastated areas, from the coast to the mountains (Figure 1a), and a smaller portion (9.8%) of our participants had suffered from the tsunami than the population described in the previous report10. Additionally, antidiabetes medication was interrupted in just 8.6% of our patients, although it was reported that diabetic condition after the Great East Japan Earthquake depended on the interruption rate of antidiabetes medication11. The low interruption rate of antidiabetes medication could be one of the causes of the lack of the exacerbation of glycemic control, as a whole, after the earthquake in the present study. Furthermore, in the present study, the bodyweight of the participants was significantly reduced after the earthquake in contrast to the previous reports2,3. As reduction of bodyweight usually correlates with improvement of insulin resistance and resultant glycemic control12–14, this could have played a role in post-earthquake improvement of glycemic control in the present study. Traffic disturbance arose after the earthquake and the tsunami, thereby severe food shortages were experienced for a few weeks in the devastated areas. Indeed, a report from the Japan Dietetic Association showed that the calorie intake of the victims was one-half to one-third of the recommended calorie intake after the Great East Japan Earthquake (http://www.dietitian.or.jp/eq/pdf/120301-5.pdf, written in Japanese). Therefore, food shortage could have been involved in the bodyweight reduction and consequent improvement of glycemic control after the earthquake in the present study. Rather unexpectedly, there were no questionnaire items with statistically significant differences between the improved and worsened glycemic control groups. These characteristics of the present study population could allow us to unravel interactions among complex biological factors, such as fasting C-peptide and noradrenaline levels, which are associated with the vulnerability of glycemic control.
Plasma noradrenaline levels at 1 month after the earthquake were significantly higher in the low C-peptide group than in the high C-peptide group (Table 5), suggesting hyperactivation of the sympathetic nerve system in the former. It is conceivable that severe damage induced by the Great East Japan Earthquake followed by the massive tsunami would produce psychological stress accompanied by anxiety in affected individuals, leading to activation of the sympathetic nervous system. Plasma noradrenaline levels were reduced at 3 months after the earthquake, suggesting post-earthquake sympathetic nervous system activation to be temporary with reversal to basal status at 3 months after the earthquake. In contrast, fasting serum C-peptide levels remained lower at 3 months after the earthquake in the low C-peptide group, showing that these patients had already had low insulin secretory capacity before the earthquake. Unfortunately, the prevalence of late complications of diabetes was unavailable in the participants of this study, and involvement of diabetic complications, especially that of neuropathy, in plasma noradrenaline levels was unclear. However, considering that there were no detectable differences in earthquake-related damage or lifestyle alterations between the improved and worsened glycemic control groups from the questionnaire survey, patients with low insulin secretory capacity might be subject to sympathetic hyperactivation under stressful circumstances. Alternatively, activated states of the sympathetic nervous system immediately after the disaster might be sustained for more than 1 month in these patients, although the mechanism underlying these effects of impaired insulin secretion on sympathetic activity remains unclear. Sympathetic nervous system activation induces insulin resistance15–17, resulting in blood glucose elevation18,19. In patients with impaired insulin secretory capacity, this hyperglycemic effect could have a greater impact on blood glucose elevation as a result of decreased compensatory insulin secretion. Therefore, sympathetic nerve activation could have contributed to further worsening of glycemic control in the low C-peptide group.
To further assess whether patients in the low C-peptide group actually showed sympathetic activation, we focused on blood pressure data. It is widely accepted that sympathetic activation induces blood pressure elevation20,21, and we previously reported significant elevation of self-measured systolic blood pressure in the morning at home to be sustained for more than 2 weeks after the earthquake in 142 hypertensive patients affected by the Great East Japan Earthquake22. As the data of blood pressure in the morning of the participants in the present study were unavailable, we compared clinical blood pressure levels 1 month after the earthquake with those obtained at 3 months, with the latter being assumed to reflect the pre-earthquake levels. In the low C-peptide group, the mean clinical systolic blood pressure value at 1 month after the earthquake was higher than that at 3 months (Table 5), suggesting temporary elevation of blood pressure. Although the difference did not reach statistical significance because of the marked variability within the clinical blood pressure dataset, these results could support the notion that sympathetic hyperactivation occurred, or that sympathetic activation had been sustained until the subacute period after the disaster, in patients with low insulin secretory capacity.
The autonomic nervous system is involved in regulating glucose and energy metabolism23,24. Furthermore, we previously reported that interorgan communications mediated by the autonomic nervous system play critical roles in regulating glucose25 and energy metabolism26,27. These findings have shed light on the significance of the autonomic nerve system in maintaining metabolic homeostasis28. The present results further suggest its importance in regulating systemic metabolism in humans, especially in post-disaster states. Metabolic homeostasis in diabetic patients with impaired endogenous insulin secretory capacity might be vulnerable due partly to perturbation of the autonomic nervous system, contributing to further worsening of glycemic control.
Acknowledgments
This work was supported by a grant from the Global-COE Programs for ‘Network Medicine’ to M Tanaka, J Imai, and H Katagiri from the Ministry of Education, Culture, Sports, Science and Technology of Japan. We thank the doctors of Tohoku Pharmaceutical University Hospital, Osaki Citizen Hospital, Minami Tohoku Hospital, South Miyagi Medical Center, Sendai Teisin Hospital, JR Sendai Hospital, Kurihara Central Hospital, Izumi Hospital, Shiogama City Hospital, Saka General Hospital, Kanagami Hospital, Marumori Hospital, Ayashi Heart Clinic, Sendai Red Cross Hospital, Iwate Prefectural Iwai Hospital, Soma Central Hospital and Ohta General Hospital for providing the data from medical records maintained at their institutions.
Disclosure
The authors declare no conflict of interest.
References
- 1.Kirizuka K, Nishizaki H, Kohriyama K, et al. Influences of the great Hanshin-Awaji earthquake on glycemic control in diabetic patients. Diabetes Res Clin Pract. 1997;36:193–196. doi: 10.1016/s0168-8227(97)00030-2. [DOI] [PubMed] [Google Scholar]
- 2.Kamoi K, Tanaka M, Ikarashi T, et al. Effect of the 2004 Mid Niigata Prefecture earthquake on glycemic control in type 1 diabetic patients. Diabetes Res Clin Pract. 2006;74:141–147. doi: 10.1016/j.diabres.2006.03.028. [DOI] [PubMed] [Google Scholar]
- 3.Sengul A, Ozer E, Salman S, et al. Lessons learnt from influences of the Marmara earthquake on glycemic control and quality of life in people with type 1 diabetes. Endocr J. 2004;51:407–414. doi: 10.1507/endocrj.51.407. [DOI] [PubMed] [Google Scholar]
- 4.Inui A, Kitaoka H, Majima M, et al. Effect of the Kobe earthquake on stress and glycemic control in patients with diabetes mellitus. Arch Intern Med. 1998;158:274–278. doi: 10.1001/archinte.158.3.274. [DOI] [PubMed] [Google Scholar]
- 5.Salman S, Sengul AM, Salman F, et al. Influence of earthquake on the quality of life of patients with type 1 diabetes. Psychiatry Clin Neurosci. 2001;55:165. doi: 10.1046/j.1440-1819.2001.00807.x. [DOI] [PubMed] [Google Scholar]
- 6.Ng J, Atkin SL, Rigby AS, et al. The effect of extensive flooding in Hull on the glycaemic control of patients with diabetes. Diabet Med. 2011;28:519–524. doi: 10.1111/j.1464-5491.2011.03228.x. [DOI] [PubMed] [Google Scholar]
- 7.Tanaka M, Imai J, Satoh M, et al. Glycemic control in diabetic patients with impaired endogenous insulin secretory capacity is vulnerable after a natural disaster: study of great East Japan earthquake. Diabetes Care. 2014;37:e212–e213. doi: 10.2337/dc14-1479. [DOI] [PubMed] [Google Scholar]
- 8.Birgerstam G, Malmquist J. Fasting plasma C-peptide levels in health and impaired glucose tolerance: relations to blood glucose and relative body weight. Scand J Clin Lab Invest. 1985;45:707–712. doi: 10.3109/00365518509155284. [DOI] [PubMed] [Google Scholar]
- 9.Jones AG, Hattersley AT. The clinical utility of C-peptide measurement in the care of patients with diabetes. Diabet Med. 2013;30:803–817. doi: 10.1111/dme.12159. [DOI] [PMC free article] [PubMed] [Google Scholar]
- 10.Ogawa S, Ishiki M, Nako K, et al. Effects of the great East Japan earthquake and huge tsunami on glycaemic control and blood pressure in patients with diabetes mellitus. BMJ Open. 2012;2:e000830. doi: 10.1136/bmjopen-2012-000830. [DOI] [PMC free article] [PubMed] [Google Scholar]
- 11.Fujihara K, Saito A, Heianza Y, et al. Impact of psychological stress caused by the great East Japan earthquake on glycemic control in patients with diabetes. Exp Clin Endocrinol Diabetes. 2012;120:560–563. doi: 10.1055/s-0032-1314873. [DOI] [PubMed] [Google Scholar]
- 12.Heilbronn LK, Noakes M, Clifton PM. Effect of energy restriction, weight loss, and diet composition on plasma lipids and glucose in patients with type 2 diabetes. Diabetes Care. 1999;22:889–895. doi: 10.2337/diacare.22.6.889. [DOI] [PubMed] [Google Scholar]
- 13.Henry RR, Wallace P, Olefsky JM. Effects of weight loss on mechanisms of hyperglycemia in obese non-insulin-dependent diabetes mellitus. Diabetes. 1986;35:990–998. doi: 10.2337/diab.35.9.990. [DOI] [PubMed] [Google Scholar]
- 14.Hughes TA, Gwynne JT, Switzer BR, et al. Effects of caloric restriction and weight loss on glycemic control, insulin release and resistance, and atherosclerotic risk in obese patients with type II diabetes mellitus. Am J Med. 1984;77:7–17. doi: 10.1016/0002-9343(84)90429-7. [DOI] [PubMed] [Google Scholar]
- 15.Mancia G, Bousquet P, Elghozi JL, et al. The sympathetic nervous system and the metabolic syndrome. J Hypertens. 2007;25:909–920. doi: 10.1097/HJH.0b013e328048d004. [DOI] [PubMed] [Google Scholar]
- 16.Festa A, D'Agostino R, Jr, Hales CN, et al. Heart rate in relation to insulin sensitivity and insulin secretion in nondiabetic subjects. Diabetes Care. 2000;23:624–628. doi: 10.2337/diacare.23.5.624. [DOI] [PubMed] [Google Scholar]
- 17.Masuo K, Rakugi H, Ogihara T, et al. Cardiovascular and renal complications of type 2 diabetes in obesity: role of sympathetic nerve activity and insulin resistance. Curr Diabetes Rev. 2010;6:58–67. doi: 10.2174/157339910790909396. [DOI] [PubMed] [Google Scholar]
- 18.Ishii C, Lnoue K, Negishi K, et al. Diabetic ketoacidosis in a case of pheochromocytoma. Diabetes Res Clin Pract. 2001;54:137–142. doi: 10.1016/s0168-8227(01)00261-3. [DOI] [PubMed] [Google Scholar]
- 19.De Vries A, Rachmilewitz M, Schumert M. Pheochromocytoma with diabetes and hypertension; report of two cases cured by operation. Am J Med. 1949;6:51–59. doi: 10.1016/0002-9343(49)90006-6. [DOI] [PubMed] [Google Scholar]
- 20.Sullivan P, Schoentgen S, DeQuattro V, et al. Anxiety, anger, and neurogenic tone at rest and in stress in patients with primary hypertension. Hypertension. 1981;3(Pt 2):II-119–II-123. doi: 10.1161/01.hyp.3.6_pt_2.ii-119. [DOI] [PubMed] [Google Scholar]
- 21.Kannan A, Janardhanan R. Hypertension as a risk factor for heart failure. Curr Hypertens Rep. 2014;16:447. doi: 10.1007/s11906-014-0447-7. [DOI] [PubMed] [Google Scholar]
- 22.Satoh M, Kikuya M, Ohkubo T, et al. Acute and subacute effects of the great East Japan earthquake on home blood pressure values. Hypertension. 2011;58:e193–e194. doi: 10.1161/HYPERTENSIONAHA.111.184077. [DOI] [PubMed] [Google Scholar]
- 23.Marty N, Dallaporta M, Thorens B. Brain glucose sensing, counterregulation, and energy homeostasis. Physiology (Bethesda) 2007;22:241–251. doi: 10.1152/physiol.00010.2007. [DOI] [PubMed] [Google Scholar]
- 24.Thorens B. Brain glucose sensing and neural regulation of insulin and glucagon secretion. Diabetes Obes Metab. 2011;13(Suppl 1):82–88. doi: 10.1111/j.1463-1326.2011.01453.x. [DOI] [PubMed] [Google Scholar]
- 25.Imai J, Katagiri H, Yamada T, et al. Regulation of pancreatic beta cell mass by neuronal signals from the liver. Science. 2008;322:1250–1254. doi: 10.1126/science.1163971. [DOI] [PubMed] [Google Scholar]
- 26.Uno K, Katagiri H, Yamada T, et al. Neuronal pathway from the liver modulates energy expenditure and systemic insulin sensitivity. Science. 2006;312:1656–1659. doi: 10.1126/science.1126010. [DOI] [PubMed] [Google Scholar]
- 27.Tsukita S, Yamada T, Uno K, et al. Hepatic glucokinase modulates obesity predisposition by regulating BAT thermogenesis via neural signals. Cell Metab. 2012;16:825–832. doi: 10.1016/j.cmet.2012.11.006. [DOI] [PubMed] [Google Scholar]
- 28.Katagiri H, Yamada T, Oka Y. Adiposity and cardiovascular disorders: disturbance of the regulatory system consisting of humoral and neuronal signals. Circ Res. 2007;101:27–39. doi: 10.1161/CIRCRESAHA.107.151621. [DOI] [PubMed] [Google Scholar]