

Abstract
The elevated tissue expression of Ro/SSA and La/SSB autoantigens appears to be crucial for the generation and perpetuation of autoimmune humoral responses against these autoantigens in Sjögren’s syndrome (SS). The mechanisms that govern their expression are not known. miRNAs, the post-transcriptional regulators of gene expression, might be implicated. We have identified previously the miRNAs let7b, miR16, miR181a, miR200b-3p, miR200b-5p, miR223 and miR483-5p that are predicted to target Ro/SSA [Ro52/tripartite motif-containing protein 21 (TRIM21), Ro60/TROVE domain family, member 2 (TROVE2)] and La/SSB mRNAs. To study possible associations with autoantigen mRNA expression and disease features, their expression was investigated in minor salivary gland (MSG) tissues, peripheral blood mononuclear cells (PBMC) and long-term cultured non-neoplastic salivary gland epithelial cells (SGEC) from 29 SS patients (20 of 29 positive for autoantibodies to Ro/SSA and La/SSB) and 24 sicca-complaining controls. The levels of miR16 were up-regulated in MSGs, miR200b-3p in SGECs and miR223 and miR483-5p in PBMCs of SS patients compared to sicca-complaining controls. The MSG levels of let7b, miR16, miR181a, miR223 and miR483-5p were correlated positively with Ro52/TRIM21-mRNA. miR181a and miR200b-3p were correlated negatively with Ro52/TRIM21 and Ro60/TROVE2 mRNAs in SGECs, respectively, whereas let7b, miR200b-5p and miR223 associated with La/SSB-mRNA. In PBMCs, let7b, miR16, miR181a and miR483-5p were correlated with Ro52/TRIM21, whereas let7b, miR16 and miR181a were also associated with La/SSB-mRNA expression. Significantly lower miR200b-5p levels were expressed in SS patients with mucosa-associated lymphoid tissue (MALT) lymphoma compared to those without. Our findings indicate that miR16, miR200b-3p, miR223 and miR483-5p are deregulated in SS, but the exact role of this deregulation in disease pathogenesis and autoantigen expression needs to be elucidated.
Keywords: autoantigens, La/SSB, miRNAs, Ro52/TRIM21, Ro60/TROVE2, Sjögren’s syndrome
Introduction
Sjögren’s syndrome (SS) is a chronic autoimmune disease with a diverse clinical picture, extending from a mild exocrinopathy to a severe, systemic, life-threatening disorder. Approximately 5% of patients develop B cell non-Hodgkin lymphoma 1. SS is characterized by the expression of autoantibodies against the intracellular autoantigens Ro/SSA [Ro52/tripartite motif-containing protein 21 (TRIM21) and/or Ro60/TROVE domain family, member 2 (TROVE2)] and La/SSB, which are expressed by almost all types of cells. The development of autoimmune responses against these autoantigens is considered to be antigen-driven and to take place in the autoimmune lesions within the affected salivary glands 2; however, the mechanisms implicated are largely unknown. Previous studies have shown that the levels of expression, composition and localization of Ro/SSA and La/SSB autoantigens within the salivary glands, and particularly epithelial structures, of SS patients is altered 2–5. Despite extensive studies of Ro52/TRIM21, Ro60/TROVE2 and La/SSB autoantigens, the factors regulating their elevated expression in the autoimmune lesions of SS are not known.
During the last decade, a key regulatory pathway of gene expression has been identified. This involves small (18–24nt), non-coding RNA molecules, namely microRNAs (miRNAs), acting at the post-transcriptional level. Emerging data support that miRNAs regulate almost all physiological and pathological processes, including immune system development and responses 6,7. Hence, deregulation of miRNA expression has been implicated in various disorders associated with altered immune responses 8. Little is known about the role of miRNAs in SS. In minor salivary glands (MSG) of SS patients, deregulated expression of several miRNAs has been described, whereas miRNA expression profile was able to discriminate SS patients from control individuals and associated with SS glandular dysfunction 9,10. In addition, elevated expression of miR-146a and mir-155 in peripheral blood mononuclear cells (PBMC) of patients with SS has been reported 11,12.
The major role of miRNAs in most physiological processes suggests that they might also be implicated in the regulation of the expression of Ro52/TRIM21, Ro60/TROVE2 and La/SSB autoantigens. Using a sophisticated computational approach, we had previously identified 11 miRNAs [let7b, miR16, miR129-5p, miR153, miR181a, miR200b-3p (miR200b), miR-200b-5p (miR200b*), miR223, miR483-5p, miR573 and miR583] that are predicted to target Ro/SSA (Ro52/TRIM21and/or Ro60/TROVE2) and La/SSB mRNAs 13. The preliminary study of these miRNAs in a small cohort of SS patients and sicca-complaining controls (14 and 13, respectively) revealed that miR129-5p, miR153, miR573 and miR583 were not expressed in MSGs, long-term cultured non-neoplastic salivary gland epithelial cells (SGEC) and PBMCs, whereas miR-200b-5p was not expressed in PBMCs. From the remaining miRNAs, the expression of miR181a, miR200b-3p and miR223 was up-regulated in MSGs, SGECs and PBMCs of SS patients, respectively, suggesting a role in disease pathogenesis 13. In this study, we sought to validate the deregulated expression of the miRNAs that are predicted algorithmically to target the Ro52/TRIM21, Ro60/TROVE2 and La/SSB autoantigens in a more representative cohort of SS patients and sicca-complaining controls and to investigate possible correlations with autoantigen expression, as well as various disease features that could reveal implications in disease pathogenetic aspects. Thus, the levels of let7b, miR16, miR181a, miR200b-3p (miR200b), miR-200b-5p (miR200b*), miR223 and miR483-5p were studied in MSG tissues obtained from SS patients and sicca-complaining non-SS controls. Furthermore, as the variety of the cells comprising MSGs from SS patients and controls, which originate from distinct degrees of inflammatory infiltration, fat and fibrosis, etc. 14, often compromises polymerase chain reaction (PCR)-based quantifications, the expression of certain miRNAs was also investigated in long-term cultured non-neoplastic SGECs and PBMCs obtained simultaneously from the same SS patients and controls that can act as indicators of epithelial and mononuclear cell miRNA expression.
Materials and methods
Patients
Twenty-nine patients with primary SS (all women) diagnosed according to the American–European SS classification criteria 15 and 24 from non-SS sicca-complaining controls (all women complaining for sicca symptoms and not fulfilling the above-mentioned criteria, who had a negative biopsy and did not exhibit serological features consistent with SS) were included into the study consecutively. MSG biopsy specimens, the MSG lobule for the establishment of SGECs and peripheral blood for the isolation of PBMC from each individual were obtained simultaneously after informed consent. The study was approved by the Ethics Committee of the School of Medicine, National University of Athens, Greece (Protocol no. 5107).
The medical records of the individuals studied were evaluated retrospectively for various clinical and laboratory parameters. These included the presence of arthralgias, arthritis, SG-enlargement, Raynaud’s phenomenon, lung involvement (documented by pulmonary function tests and X-ray and/or computed-tomography scans), renal involvement (persistent proteinuria and verification by renal biopsy), liver involvement (as attested by liver biopsy indicative of primary biliary cirrhosis), palpable purpura, vasculitis, peripheral neuropathy (verified by nerve-conduction studies) and lymphoma development (diagnosed histologically), anti-Ro/SSA and/or anti-La/SSB autoantibodies, rheumatoid factor (RF), complement C3- and C4-levels, cryoglobulinaemia, hypergammaglobulinaemia (total gammaglobulins > 2 g/l) and leucopenia (white blood cell count < 4000/mm3). Furthermore, histological features including the biopsy focus score (number of lymphocytic foci per 4 mm2 of tissue area) and formation of ectopic germinal centres (GC) were recorded. The characteristics of the individuals included in the study are reported in Table1. None of the individuals studied had received any glucocorticoid and/or immunosuppressive drug treatment until biopsy performance.
Table 1.
Characteristics of the individuals included in the study.
| Features | SS patients (n = 29) | Sicca controls (n = 24) | |
|---|---|---|---|
| General | Age (years), median (range) | 58 (32–76) | 52·5 (27–71) |
| No. of SS criteria fulfilled, median (range) | 4 (4–5) | 2 (0–2) | |
| Mean duration (years) of sicca symptoms, median (range) | 4 (1–37) | 1·75 (1·0–10·0) | |
| Histological (MSG biopsy) | Biopsy focus score (number of lymphocytic foci/4 mm2), median (range) | 3·0 (1·00–11·5) | 0·0 (0·0–0·4) |
| Germinal centre formation (%) | 20·7 | 0·0 | |
| Clinical | Arthralgias (%) | 34·5 | 20·8 |
| Arthritis (%) | 13·8 | 8·3 | |
| SG enlargement (SGE) (%) | 44·8 | 0·0 | |
| Raynaud’s phenomenon (%) | 17·2 | 12·5 | |
| Parenchymal organ involvement (%) | 6·9 | 0·0 | |
| Lung involvement (%) | 3·4 | 0·0 | |
| Renal involvement (%) | 3·4 | 0·0 | |
| Liver involvement (%) | 0·0 | 0·0 | |
| Indicative of vasculitic involvement (%) | 13·8 | 8·3 | |
| Palpable purpura (%) | 13·8 | 8·3 | |
| Vasculitis (%) | 0·0 | 0·0 | |
| Peripheral neuropathy (%) | 0·0 | 0 | |
| Lymphoma (%) | 13·8 | 0·0 | |
| Laboratory | Anti-Ro/SSA and/or La/SSB-positive (%) | 69·0 | 0·0 |
| Anti-Ro/SSA-positive (%) | 69·0 | 0·0 | |
| Anti-Ro52/TRIM21-positive (%) | 58·6 | 0·0 | |
| Anti-Ro60/TROVE2-positive (%) | 58·6 | 0·0 | |
| Anti-La(SSB)-positive (%) | 27·6 | 0·0 | |
| Rheumatoid factor-positive (%) | 55·2 | 4·2 | |
| C3-levels, median (range) | 102 (33·0–152·0) | 109 (63·0–171·0) | |
| C4-levels, median (range) | 23·5 (4·0–47·3) | 33·4 (12·2–52) | |
| Cryoglobulinaemia (%) | 6·9 | 0·0 | |
| Hypergammaglobulinaemia (%) | 24·1 | 0·0 | |
| Leukopenia (%) | 6·9 | 4·2 |
MSG = minor salivary gland; SS = Sjögren’s syndrome; SG = salivary gland; TRIM21 = tripartite motif-containing protein 21; TROVE2 = TROVE domain family, member 2.
SGEC culture
Non-neoplastic, long-term cultured SGEC lines were established by the standard explant outgrowth technique 16 from a lobule of MSG biopsy obtained from individuals undergoing diagnostic evaluation for SS. The purity and epithelial origin of cultured SGEC lines was verified routinely by morphology, the uniform expression of epithelial-specific markers and the absence of markers indicative of lymphoid/monocytoid cells 16. The lack of endotoxin contamination was investigated by testing routinely all culture reagents by the chromogenic Limulus amebocyte lysates assay (Sigma, St Louis, MO, USA).
PBMCs
PBMCs were isolated from peripheral blood obtained at the time of MSG biopsy performance by density gradient centrifugation on Ficoll/Paque (Amersham-Pharmacia Biotech, Uppsala, Sweden).
Reverse transcription–quantitative polymerase chain reaction (RT–qPCR)
Total RNA containing small RNA molecules, such as miRNAs, was isolated from MSGs, SGECs and PBMCs using the mirVana™ PARIS™ kit (Ambion, Applied Biosystems, Carlsbad, CA, USA) according to the manufacturer’s instructions. To avoid DNA contamination, isolated RNA was treated with DNase (Ambion® Turbo DNA-free™ kit; Ambion, Foster City, CA, USA). Subsequently, 0·25-μg RNA were reverse-transcribed by the high-capacity RNA to DNA kit or TaqMan® miRNA reverse transcription kit and Megaplex™ RT primers (all from Applied Biosystems) for the study of mRNA or miRNA expression by quantitative real-time PCR (qPCR), respectively. The qPCR for Ro52/TRIM21, Ro60/TROVE2 and La/SSB mRNAs was performed using commercially available primers specific for each molecule and human HPRT1 as reference gene (TaqMan® gene expression assays; Applied Biosystems) as described previously 17. TaqMan® miRNA assay technology with primers specific for each miRNA and RNU48 miRNA as reference miRNA was employed for the analysis of miRNA expression (Applied Biosystems). The relative quantification of mRNA and miRNA expression was performed by the 2−ΔΔCT method 18 using HeLa cells as the calibrator. All samples were run in duplicate.
Statistical analyses
Statistical analyses were performed by the non-parametric Mann–Whitney and Spearman’s rank correlation tests using GraphPad Prism version 5 software (GraphPad Software, San Diego, CA, USA). As well as miRNA–mRNA correlations, the association of the expression of each miRNA with the various disease clinical, laboratory and histological features documented in the ‘Patients’ section was also examined. Only the statistically significant differences are reported.
Results
Expression of miRNAs in MSGs, SGECs and PBMCs
In accord with our previous study 13, miR200b-5p was not detected in PBMCs. Except for miR200b-5p, the expression of all other miRNAs studied was found to differ statistically between MSGs, SGECs and PBMCs (Fig. 1). Hence, the expression of miR16, miR200b-3p and miR223 was significantly different among MSGs, SGECs and PBMCs. Up-regulated expression of let7b and miR483-5p was observed in PBMCs compared to MSGs or SGECs, whereas the expression of miR181 in PBMCs and SGECs was increased compared to MSGs (Fig. 1). Spearman’s rank correlation analysis of the expression of miRs among MSGs, SGECs and PBMCs revealed a significant association of let7b expression between MSGs and SGECs, MSGs and PBMCs, as well as SGECs and PBMCs (r = 0·32, P = 0·03, r = 0·29, P = 0·05 and r = 0·51, P = 0·0004, respectively). The expression of miR16 in SGECs was correlated negatively with that of PBMCs (r = −0·52, P = 0·0003), whereas the expression of miR181a in PBMCs was associated positively with that of MSGs or SGECs (r = 0·36, P = 0·01 and r = 0·55, P < 0·0001, respectively).
Figure 1.
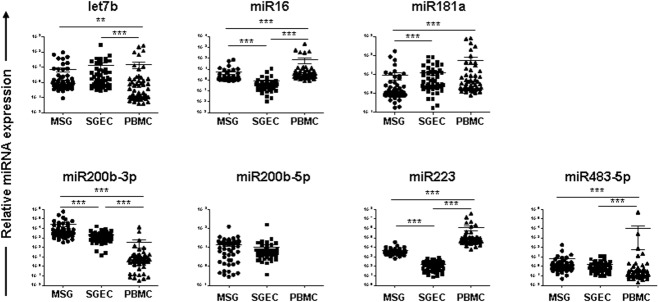
Dot-plots displaying the expression of let7b, miR16, miR181a, miR200b-3p (miR200b), miR-200b-5p (miR200b*), miR223 and miR483-5p microRNAs (miRNAs) that are predicted to target Ro/SSA and La/SSB mRNAs in minor salivary gland (MSG) tissues, salivary gland epithelial cells (SGECs) and peripheral blood mononuclear cells (PBMCs). Only statistically significant associations are indicated. P-values are designated by asterisks (**P < 0·01, ***P < 0·001), whereas horizontal bars represent the mean value of the group.
Differential expression of miRNAs in SS patients and sicca-complaining controls or autoantibody-positive and -negative SS patients
Non-parametric Mann–Whitney analysis revealed that the expression of miR16 is up-regulated significantly in the MSGs of SS patients compared to sicca-complaining controls [mean relative expression ± standard error (s.e.)]: 7·74 ± 3·05 versus 2·75 ± 0·84, P = 0·05, respectively) (Fig. 2). Similarly, the expression of miR200b-3p in SGECs, as well as miR223 and miR483-5p in PBMCs, was increased in SS patients compared to sicca-complaining controls (2771 ± 634 versus 1182 ± 215, P = 0·04, 1 028 000 ± 544 700 versus 63 700 ± 11 130, P = 0·03 and 96·4 ± 92.8 versus 1·19 ± 0·96, P = 0·003, respectively) (Fig. 2).
Figure 2.
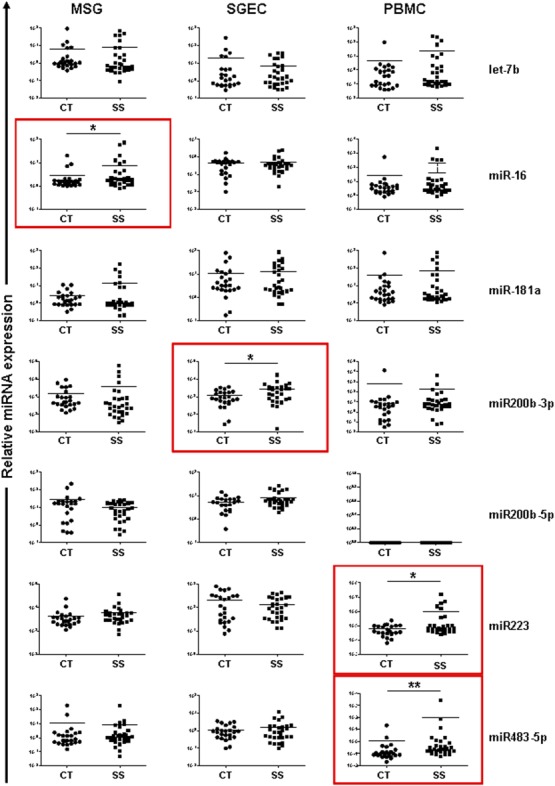
Dot-plots showing the expression of let7b, miR16, miR181a, miR200b-3p, miR-200b-5p, miR223 and miR483-5p microRNAs (miRNAs) in minor salivary gland (MSG) tissues, salivary gland epithelial cells (SGECs) and peripheral blood mononuclear cells (PBMCs) from Sjögren’s syndrome (SS) patients and sicca-complaining controls (CT). The Mann–Whitney non-parametric test was employed for the analysis of significant differences in the miRNA expression between SS patients and sicca-complaining controls. Significant differences are highlighted by red boxes. P-values are designated by asterisks (*P < 0·05, **P < 0·01), whereas horizontal bars represent the mean value of the group.
Subsequently, the expression of miRNAs was analysed in SS patients expressing or not antibodies against Ro/SSA (Ro52/TRIM21 and/or Ro60/TROVE2) and La/SSB autoantigens. The levels of miR16, miR223 and miR483-5p were up-regulated in MSG tissues of anti-Ro/SSA and anti-La/SSB double-positive SS patients compared to seronegative patients (9·67 ± 4·28 versus 3·48 ± 2·14, P = 0·02, 7296 ± 1718 versus 2773 ± 480, P = 0·006 and 12·75 ± 9·18 versus 0·8 ± 0·18, P = 0·03, respectively), whereas the expression of miR181a was down-regulated in the PBMCs of seropositive SS patients (32·46 ± 21·23 versus 166·6 ± 100·6, P = 0·03) (Fig. 3). However, only the expression of miR16 and miR223 in double-positive SS patients was found to be up-regulated significantly compared to sicca-complaining controls (9·67 ± 4·28 versus 2·75 ± 0·84, P = 0·003 and 7296 ± 1718 versus 4259 ± 972, P = 0·004, respectively) (Fig. 3). None of the miRNAs studied was altered between SGECs obtained from anti-Ro/SSA and anti-La/SSB double-positive and negative SS patients (data not shown).
Figure 3.
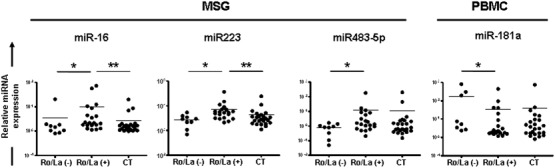
Dot-plots displaying the significantly different expression of microRNAs (miRNAs) between Sjögren’s syndrome (SS) patients negative or double-positive for autoantibodies against Ro/SSA (Ro52/tripartite motif-containing protein 21 (TRIM21) and/or Ro60/TROVE domain family, member 2 (TROVE2)] and La/SSB ribonucleoproteins [aRo/La(−) and aRo/La(+), respectively], as well as sicca-complaining controls (CT). Only significant differences are shown. P-values are designated by asterisks (*P < 0·05, **P < 0·01), whereas horizontal bars represent the mean value of the group.
Associations between the expression levels of target mRNAs and miRNAs
Spearman’s rank correlation analysis revealed that Ro52/TRIM21 mRNA expression was associated positively with the levels of let7b, miR16, miR181a, miR200b-3p, miR223 and miR483-5p in MSG tissues, as well as let7b, miR16, miR181a and miR483-5p in PBMCs, whereas it was correlated negatively with miR181a expression in SGECs (Table2). Ro60/TROVE2 mRNA was associated with miR200b-3p expression in MSGs and SGECs (positively and negatively, respectively), whereas La/SSB expression was correlated positively with let-7b in all types of samples, miR16 and miR181a in MSGs and PBMCs, miR200b-3p in MSGs, as well as with miR200-5p and miR223 in SGECs (positively and negatively, respectively) (Table2).
Table 2.
Correlations between the levels of mRNA and miRNA expression in minor salivary gland (MSG) tissues, salivary gland epithelial cells (SGEC) and peripheral blood mononuclear cells (PBMC).
| let7b | miR16 | miR181a | miR200b-3p | miR200b-5p | miR223 | miR483-5p | |||||||||
|---|---|---|---|---|---|---|---|---|---|---|---|---|---|---|---|
| r | P | r | P | r | P | r | P | r | P | r | P | r | P | ||
| Ro52/TRIM21 | MSG | 0·42 | 0·0009 | 0·63 | <0·0001 | 0·34 | 0·0062 | 0·32 | 0.0098 | n.s. | 0.41 | 0.0013 | 0.42 | 0.001 | |
| SGEC | n.s. | n.s. | −0·24 | 0·042 | n.s. | n.s. | n.s. | n.s. | |||||||
| PBMC | 0·42 | 0·0008 | 0·41 | 0·0011 | 0·42 | 0·0008 | n.s. | n.a. | n.s. | 0.42 | 0.0008 | ||||
| Ro60/TROVE2 | MSG | n.s. | n.s. | n.s. | 0·25 | 0·0373 | n.s. | n.s. | n.s. | ||||||
| SGEC | n.s. | n.s. | n.s. | −0·27 | 0·0263 | n.s. | n.s. | n.s. | |||||||
| PBMC | n.s. | n.s. | n.s. | n.s. | n.a. | n.s. | n.s. | ||||||||
| La/SSB | MSG | 0·27 | 0·0274 | 0·29 | 0·0165 | 0·26 | 0·0303 | 0·28 | 0.0217 | n.s. | n.s. | n.s. | |||
| SGEC | 0·28 | 0·0022 | n.s. | n.s. | n.s. | 0·42 | 0·0012 | −0.27 | 0.0247 | n.s. | |||||
| PBMC | 0·34 | 0·0062 | 0·29 | 0·0162 | 0·39 | 0·002 | n.s. | n.a. | n.s. | n.s. | |||||
Significant correlations are grey-scaled. Please note that in most cases similar mRNA/miRNA correlations are observed in MSGs and PBMCs, possibly suggesting that MSG associations reflect infiltration status. TRIM21 = tripartite motif-containing protein 21; TROVE2 = TROVE domain family, member 2; n.s. = not significant; n.a. = not applicable.
Associations of miRNA expression levels with disease features
Spearman’s rank correlation analysis displayed that the levels of miR200b-3p and miR200b-5p in MSG tissues correlate negatively with biopsy focus score (r = −0·39, P = 0·03 and r = −0·46, P = 0·01, respectively) (Fig. 4a). The Mann–Whitney U-test revealed significantly lower MSG expression levels of let7b, miR16, miR181a, miR200b-3p and miR483-5p miRNAs in SS patients with MSG-infiltrates that organize into ectopic GCs compared to those without (mean relative expression ± s.e. in SS patients with GCs versus SS patients without: 0·37 ± 0·08 versus 10·49 ± 3·89, P = 0·005, 1·26 ± 0·13 versus 9·44 ± 3·78, P = 0·006, 0·56 ± 0·14 versus 17·75 ± 8·32, P = 0·002, 1883 ± 682 versus 51 090 ± 28 330, P = 0·05 and 0·76 ± 0·27 versus 11·2 ± 8·0, P = 0·05, respectively) (Fig. 4b). Furthermore, significantly lower expression of miR200b-5p in MSGs was observed in SS patients with MSG-associated mucosa-associated lymphoid tissue (MALT) lymphoma compared to SS patients without (2·24 ± 0·75 versus 11·97 ± 1·68, P = 0·03 in SS patients with versus patients without) (Fig. 4c). This finding is currently under evaluation in a larger number of SS patients with lymphoma.
Figure 4.
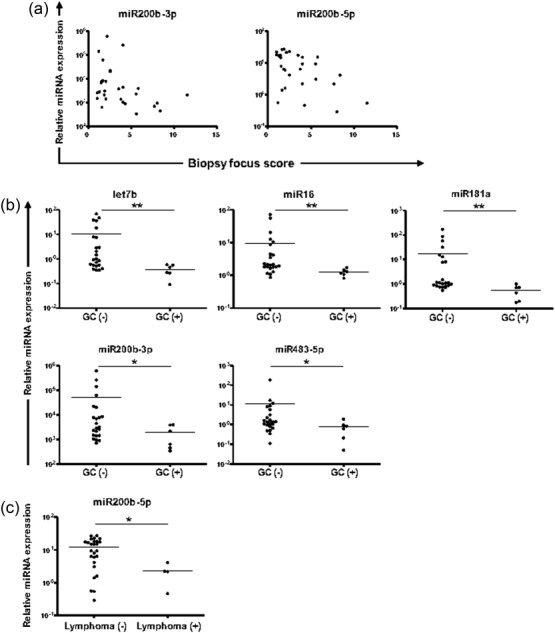
Plots indicating statistically significant associations between microRNA (miRNA) expression in minor salivary gland (MSG) tissues and disease features. (a) Spearman’s rank correlation analysis showed that miR200b-3p and miR200b-5p levels associate significantly with biopsy focus score (P < 0·05 each). (b) Mann–Whitney analysis revealed significant deregulation of let7b, miR16, miR181a, miR200b-3p and miR483-5p expression in Sjögren’s syndrome (SS) patients with ectopic germinal centres (GC) in MSG-infiltrates [GC(+)] compared to those without [GC(−)]. (c) Lower expression of miR200b-5p in the MSG tissues of SS patients with MSG-related mucosa-associated lymphoid tissue (MALT) lymphoma [lymphoma (+)] compared to SS patients without [lymphoma (−)]. Only statistically significant differences are shown. P-values are designated by asterisks (*P < 0·05, **P < 0·01), whereas horizontal bars represent the mean value of the group.
Discussion
In this report, the expression of let7b, miR16, miR181a, miR200b-3p (miR200b), miR-200b-5p (miR200b*), miR223 and miR483-5p that are predicted to target Ro/SSA (Ro52/TRIM21 and/or Ro60/TROVE2) and La/SSB mRNAs 13 were investigated in MSG tissues, long-term cultured SGECs and PBMCs obtained from SS patients and sicca-complaining controls. The differential composition of the MSG tissues, even among SS patients with variable degree of inflammation, hinders the evaluation of quantitative PCR-raised associations, as they may be attributed to distinct cellular composition of MSGs and to predominant cell type (e.g. epithelia in controls and SS patients with mild infiltration or lymphocytic cells in SS patients with heavy lesions). Conversely, long-term cultured SGECs from SS patients have been shown to maintain an ‘activated’ phenotype in culture compared to those from controls 1 and the study of miRNAs in SGECs can be indicative of constitutive/‘resting’ epithelial expression. Moreover, the study of PBMCs provides information about the expression of miRNAs in the periphery, as well as in the ‘lymphocytic’ compartment. Thus, the parallel study of MSGs, SGECs and PBMCs from each individual studied facilitates the evaluation of the raised associations and possible ascription to cellular composition.
The previously identified associations from the preliminary study of a small cohort of SS patients and controls 13 were confirmed or devalued, whereas new ones were disclosed. These included the up-regulated expression of miR16 in MSGs, miR200b-3p in SGECs, as well as miR223 and miR483-5p in PBMCs of SS patients. A lower miR181a expression was observed in PBMCs from SS patients with autoantibodies against Ro/SSA and La/SSB proteins compared to seronegative SS patients. Furthermore, the expression levels of miR16, miR223 and miR483-5p were increased in MSGs tissues of anti-Ro/SSA and anti-La/SSB double-positive SS patients compared to seronegative SS patients. Nevertheless, only miR16 and miR223 were up-regulated significantly in double-positive SS patients compared to controls, thus justifying the non-significantly different expression of MSG-miR483-5p and PBMC-miR181a between the entire SS patient group and sicca-complaining controls. Several miRNAs were found to correlate with Ro52/TRIM21, Ro60/TROVE2 or La/SSB mRNA expression in distinct types of samples. Let-7b, miR16 and miR181a were associated positively with both Ro52/TRIM21 and La/SSB mRNA in MSG tissues and PBMCs, whereas mir200b-3p correlated with Ro60/TROVE2 mRNA expression. The somewhat similar associations of miRNA-mRNA expression in MSGs and PBMCs possibly suggest that miRNAs expression profile in MSG tissues reflects cellular composition, whereas different regulation of miRNAs is observed in SGECs and PBMCs. Contrary to the anticipated down-regulated or negatively correlated expression of the miRNAs that are predicted to target Ro/SSA and La/SSB mRNAs, the deregulated miRNAs were increased or associated positively with autoantigen mRNA expression in SS patients. Considering that the miRNAs that target Ro/SSA and La/SSB autoantigens are predicted algorithmically and targets are not validated functionally, these findings may either represent a negative feedback loop for the control of autoantigen elevated expression and/or inefficiency to regulate target expression or inability to target the autoantigen mRNAs. Further functional studies using dual luciferase binding assays are needed to validate target specificity. Nevertheless, the deregulated expression of miR16, miR200b-3p, miR223 and miR483-5p suggests a role in disease pathogenesis, whereas the association of let-7b, miR16, miR181a and miR200b-3p miRNAs with autoantigen expression possibly implies a role in the regulation of humoral autoimmune responses. Due to the perplexed function of miRNAs, arising from the multiple targets of each miRNA and the complex miRNA network pathways, it is somewhat difficult to delineate the role of the studied miRNAs in SS pathogenesis. Thorough in-vitro and in-vivo studies of miRNA function, including silencing or over-expression studies, are needed to enlighten the role of the deregulated miRNAs in SS pathogenesis.
Notably, deregulated expression of certain of the studied miRNAs has been linked previously to autoimmune diseases. Over-expression of miR181a and miR16 in MSG tissues of SS patients has been associated with decreased salivary function 9. Furthermore, elevated expression of miR16 has been associated with human Graves’ disease, rheumatoid arthritis (RA) and primary biliary cirrhosis 19–21, deregulated expression of miR181a with systemic lupus erythematosus (SLE) 22,23, miR223 with RA, SLE, dermatomyositis and autoimmune haemolytic anaemia 24–26 and miR483-5p with paediatric immune thrombocytopenic purpura 27.
The deregulation of the mir200 family members in SS patients with MALT lymphoma, severe infiltration or formation of GCs in MSG infiltrates requires special attention. The extended glandular infiltration and organization of the MSG lymphocytic infiltrates into GCs indicate severe systemic disease and potentially future development of lymphoma 1,28. In the MSG tissues of our SS cohort, both miRNAs were correlated negatively with biopsy focus score. Furthermore, the expression of miR200b-3p was down-regulated in SS patients with GCs, whereas miR200b-5p in SS patients with MALT lymphoma. Although initially believed otherwise, the expression of paired miRNA strands has been described in both physiological and disease conditions 29,30. It would be tempting to hypothesize that the differential expression of miR200b-3p and miR200b-5p in SS patients with GCs and MALT lymphoma, respectively, represents a continuum of lymphomagenesis. In fact, miR200b miRNAs are critical regulators of the expression of oncogenes and tumour suppressor genes 31–33. From this perspective, the down-regulated miR200b expression in MSGs of SS patients with severe organized infiltration or MSG-associated MALT lymphoma most probably represents a pathogenetic pathway for development of lymphoma and a potential promising biomarker for future lymphoma development. Besides miR200b-3p, reduced expression of let7b, miR16, miR181a and miR483-5p miRNAs in MSGs was associated with the organization of infiltrates into ectopic GCs. Interestingly, all these miRNAs have been implicated in human cancer, including lymphomagenesis 34–38, pointing out that the generation of GC-like structures might be regulated from particular miRNAs. It should be noted, however, that except miR-181a, which participates in the differentiation of haematopoietic stem cells towarda B cells 39, a direct association of these miRNAs with GC formation has not been proven.
In conclusion, our findings support the deregulated expression of miR16, miR200b-3p, miR223 and miR483-5p in patients with SS, suggesting a role in disease pathogenesis. The association between the expression of let-7b, miR16, miR181a and miR200b-3p miRNAs and their predicted mRNA targets, Ro52/TRIM21, Ro60/TROVE2 and La/SSB mRNAs possibly indicates a role in the regulation of SS humoral autoimmune responses. Finally, the deregulated expression of miR200b in SS patients with severe lesions or MSG-associated MALT lymphoma may represent a pathogenetic pathway and predictive biomarker for SS-related lymphomagenesis. Even though this study is restricted in association, and not functional, data, our findings possibly implicate these miRNAs in SS pathogenesis. Considering the complexity of miRNA networks and targets, it is difficult to identify their precise role in disease pathogenesis; however, further functional studies could possibly enlighten some pathogenetic aspects.
Acknowledgments
This research was co-financed by grants of the Medical School and the Hellenic Rheumatology Society.
Author contributions
V.C.G. and N.C.K. performed the experiments, V.C.G. and E.K.K. analysed the data, E.K.K. and A.G.T. designed and supervised the study and wrote the paper.
Disclosure
Authors have no financial or personal conflicts of interest to declare.
References
- Tzioufas AG, Kapsogeorgou EK, Moutsopoulos HM. Pathogenesis of Sjogren’s syndrome: what we know and what we should learn. J Autoimmun. 2012;39:4–8. doi: 10.1016/j.jaut.2012.01.002. [DOI] [PubMed] [Google Scholar]
- Kyriakidis NC, Kapsogeorgou EK, Tzioufas AG. A comprehensive review of autoantibodies in primary Sjogren’s syndrome: clinical phenotypes and regulatory mechanisms. J Autoimmun. 2014;51:67–74. doi: 10.1016/j.jaut.2013.11.001. [DOI] [PubMed] [Google Scholar]
- Ohlsson M, Jonsson R, Brokstad KA. Subcellular redistribution and surface exposure of the Ro52, Ro60 and La48 autoantigens during apoptosis in human ductal epithelial cells: a possible mechanism in the pathogenesis of Sjogren’s syndrome. Scand J Immunol. 2002;56:456–69. doi: 10.1046/j.1365-3083.2002.01072_79.x. [DOI] [PubMed] [Google Scholar]
- Tengner P, Halse AK, Haga HJ, Jonsson R, Wahren-Herlenius M. Detection of anti-Ro/SSA and anti-La/SSB autoantibody-producing cells in salivary glands from patients with Sjogren’s syndrome. Arthritis Rheum. 1998;41:2238–48. doi: 10.1002/1529-0131(199812)41:12<2238::AID-ART20>3.0.CO;2-V. [DOI] [PubMed] [Google Scholar]
- Tzioufas AG, Hantoumi I, Polihronis M, Xanthou G, Moutsopoulos HM. Autoantibodies to La/SSB in patients with primary Sjogren’s syndrome (pSS) are associated with upregulation of La/SSB mRNA in minor salivary gland biopsies (MSGs) J Autoimmun. 1999;13:429–34. doi: 10.1006/jaut.1999.0333. [DOI] [PubMed] [Google Scholar]
- Baltimore D, Boldin MP, O’Connell RM, Rao DS, Taganov KD. MicroRNAs: new regulators of immune cell development and function. Nat Immunol. 2008;9:839–45. doi: 10.1038/ni.f.209. [DOI] [PubMed] [Google Scholar]
- Bartel DP. MicroRNAs: target recognition and regulatory functions. Cell. 2009;136:215–33. doi: 10.1016/j.cell.2009.01.002. [DOI] [PMC free article] [PubMed] [Google Scholar]
- Ceribelli A, Satoh M, Chan EK. MicroRNAs and autoimmunity. Curr Opin Immunol. 2012;24:686–91. doi: 10.1016/j.coi.2012.07.011. [DOI] [PMC free article] [PubMed] [Google Scholar]
- Alevizos I, Alexander S, Turner RJ, Illei GG. MicroRNA expression profiles as biomarkers of minor salivary gland inflammation and dysfunction in Sjogren’s syndrome. Arthritis Rheum. 2011;63:535–44. doi: 10.1002/art.30131. [DOI] [PMC free article] [PubMed] [Google Scholar]
- Tandon M, Gallo A, Jang SI, Illei GG, Alevizos I. Deep sequencing of short RNAs reveals novel microRNAs in minor salivary glands of patients with Sjogren’s syndrome. Oral Dis. 2012;18:127–31. doi: 10.1111/j.1601-0825.2011.01849.x. [DOI] [PMC free article] [PubMed] [Google Scholar]
- Pauley KM, Stewart CM, Gauna AE, et al. Altered miR-146a expression in Sjogren’s syndrome and its functional role in innate immunity. Eur J Immunol. 2011;41:2029–39. doi: 10.1002/eji.201040757. [DOI] [PMC free article] [PubMed] [Google Scholar]
- Zilahi E, Tarr T, Papp G, Griger Z, Sipka S, Zeher M. Increased microRNA-146a/b, TRAF6 gene and decreased IRAK1 gene expressions in the peripheral mononuclear cells of patients with Sjogren’s syndrome. Immunol Lett. 2012;141:165–8. doi: 10.1016/j.imlet.2011.09.006. [DOI] [PubMed] [Google Scholar]
- Kapsogeorgou EK, Gourzi VC, Manoussakis MN, Moutsopoulos HM, Tzioufas AG. Cellular microRNAs (miRNAs) and Sjogren’s syndrome: candidate regulators of autoimmune response and autoantigen expression. J Autoimmun. 2011;37:129–35. doi: 10.1016/j.jaut.2011.05.003. [DOI] [PubMed] [Google Scholar]
- Christodoulou MI, Kapsogeorgou EK, Moutsopoulos HM. Characteristics of the minor salivary gland infiltrates in Sjogren’s syndrome. J Autoimmun. 2010;34:400–7. doi: 10.1016/j.jaut.2009.10.004. [DOI] [PubMed] [Google Scholar]
- Vitali C, Bombardieri S, Jonsson R, et al . Classification criteria for Sjogren’s syndrome: a revised version of the European criteria proposed by the American–European Consensus Group. Ann Rheum Dis. 2002;61:554–8. doi: 10.1136/ard.61.6.554. [DOI] [PMC free article] [PubMed] [Google Scholar]
- Dimitriou ID, Kapsogeorgou EK, Abu-Helu RF, Moutsopoulos HM, Manoussakis MN. Establishment of a convenient system for the long-term culture and study of non-neoplastic human salivary gland epithelial cells. Eur J Oral Sci. 2002;110:21–30. doi: 10.1034/j.1600-0722.2002.00152.x. [DOI] [PubMed] [Google Scholar]
- Kyriakidis NC, Kapsogeorgou EK, Gourzi VC, Konsta OD, Baltatzis GE, Tzioufas AG. Toll-like receptor 3 stimulation promotes Ro52/TRIM21 synthesis and nuclear redistribution in salivary gland epithelial cells, partially via type I interferon pathway. Clin Exp Immunol. 2014;178:548–60. doi: 10.1111/cei.12432. [DOI] [PMC free article] [PubMed] [Google Scholar]
- Livak KJ, Schmittgen TD. Analysis of relative gene expression data using real-time quantitative PCR and the 2(-delta delta C(T)) method. Methods. 2001;25:402–8. doi: 10.1006/meth.2001.1262. [DOI] [PubMed] [Google Scholar]
- Yamada H, Itoh M, Hiratsuka I, Hashimoto S. Circulating microRNAs in autoimmune thyroid diseases. Clin Endocrinol (Oxf) 2014;81:276–81. doi: 10.1111/cen.12432. [DOI] [PubMed] [Google Scholar]
- Pauley KM, Satoh M, Chan AL, Bubb MR, Reeves WH, Chan EK. Upregulated miR-146a expression in peripheral blood mononuclear cells from rheumatoid arthritis patients. Arthritis Res Ther. 2008;10:R101. doi: 10.1186/ar2493. [DOI] [PMC free article] [PubMed] [Google Scholar]
- Katsushima F, Takahashi A, Sakamoto N, Kanno Y, Abe K, Ohira H. Expression of micro-RNAs in peripheral blood mononuclear cells from primary biliary cirrhosis patients. Hepatol Res. 2014;44:E189–97. doi: 10.1111/hepr.12198. [DOI] [PubMed] [Google Scholar]
- Lashine YA, Seoudi AM, Salah S, Abdelaziz AI. Expression signature of microRNA-181-a reveals its crucial role in the pathogenesis of paediatric systemic lupus erythematosus. Clin Exp Rheumatol. 2011;29:351–7. [PubMed] [Google Scholar]
- Carlsen AL, Schetter AJ, Nielsen CT, et al. Circulating microRNA expression profiles associated with systemic lupus erythematosus. Arthritis Rheum. 2013;65:1324–34. doi: 10.1002/art.37890. [DOI] [PMC free article] [PubMed] [Google Scholar]
- Fulci V, Scappucci G, Sebastiani GD, et al. miR-223 is overexpressed in T-lymphocytes of patients affected by rheumatoid arthritis. Hum Immunol. 2010;71:206–11. doi: 10.1016/j.humimm.2009.11.008. [DOI] [PubMed] [Google Scholar]
- Ferrer G, Navarro A, Hodgson K, et al. MicroRNA expression in chronic lymphocytic leukemia developing autoimmune hemolytic anemia. Leuk Lymph. 2013;54:2016–22. doi: 10.3109/10428194.2012.763123. [DOI] [PubMed] [Google Scholar]
- Inoue K, Jinnin M, Yamane K, et al. Down-regulation of miR-223 contributes to the formation of Gottron’s papules in dermatomyositis via the induction of PKCvarepsilon. Eur J Dermatol. 2013;23:160–7. doi: 10.1684/ejd.2013.1959. [DOI] [PubMed] [Google Scholar]
- Bay A, Coskun E, Oztuzcu S, Ergun S, Yilmaz F, Aktekin E. Plasma microRNA profiling of pediatric patients with immune thrombocytopenic purpura. Blood Coagul Fibrinolysis. 2014;25:379–83. doi: 10.1097/MBC.0000000000000069. [DOI] [PubMed] [Google Scholar]
- Bombardieri M, Pitzalis C. Ectopic lymphoid neogenesis and lymphoid chemokines in Sjogren’s syndrome: at the interplay between chronic inflammation, autoimmunity and lymphomagenesis. Curr Pharm Biotechnol. 2012;13:1989–96. doi: 10.2174/138920112802273209. [DOI] [PubMed] [Google Scholar]
- Jazdzewski K, Liyanarachchi S, Swierniak M, et al. Polymorphic mature microRNAs from passenger strand of pre-miR-146a contribute to thyroid cancer. Proc Natl Acad Sci USA. 2009;106:1502–5. doi: 10.1073/pnas.0812591106. [DOI] [PMC free article] [PubMed] [Google Scholar]
- Ro S, Park C, Young D, Sanders KM, Yan W. Tissue-dependent paired expression of miRNAs. Nucleic Acids Res. 2007;35:5944–53. doi: 10.1093/nar/gkm641. [DOI] [PMC free article] [PubMed] [Google Scholar]
- Hummel R, Hussey DJ, Haier J. MicroRNAs: predictors and modifiers of chemo- and radiotherapy in different tumour types. Eur J Cancer. 2010;46:298–311. doi: 10.1016/j.ejca.2009.10.027. [DOI] [PubMed] [Google Scholar]
- Feng B, Wang R, Chen LB. Review of miR-200b and cancer chemosensitivity. Biomed Pharmacother. 2012;66:397–402. doi: 10.1016/j.biopha.2012.06.002. [DOI] [PubMed] [Google Scholar]
- Sun L, Yao Y, Liu B, et al. MiR-200b and miR-15b regulate chemotherapy-induced epithelial-mesenchymal transition in human tongue cancer cells by targeting BMI1. Oncogene. 2012;31:432–45. doi: 10.1038/onc.2011.263. [DOI] [PubMed] [Google Scholar]
- Schickel R, Boyerinas B, Park SM, Peter ME. MicroRNAs: key players in the immune system, differentiation, tumorigenesis and cell death. Oncogene. 2008;27:5959–74. doi: 10.1038/onc.2008.274. [DOI] [PubMed] [Google Scholar]
- Song Q, Xu Y, Yang C, et al. miR-483-5p promotes invasion and metastasis of lung adenocarcinoma by targeting RhoGDI1 and ALCAM. Cancer Res. 2014;74:3031–42. doi: 10.1158/0008-5472.CAN-13-2193. [DOI] [PubMed] [Google Scholar]
- Mi S, Lu J, Sun M, et al. MicroRNA expression signatures accurately discriminate acute lymphoblastic leukemia from acute myeloid leukemia. Proc Natl Acad Sci USA. 2007;104:19971–6. doi: 10.1073/pnas.0709313104. [DOI] [PMC free article] [PubMed] [Google Scholar]
- Nie K, Zhang T, Allawi H, et al. Epigenetic down-regulation of the tumor suppressor gene PRDM1/Blimp-1 in diffuse large B cell lymphomas: a potential role of the microRNA let-7. Am J Pathol. 2010;177:1470–9. doi: 10.2353/ajpath.2010.091291. [DOI] [PMC free article] [PubMed] [Google Scholar]
- Qu X, Zhao M, Wu S, et al. Circulating microRNA 483-5p as a novel biomarker for diagnosis survival prediction in multiple myeloma. Med Oncol. 2014;31:219. doi: 10.1007/s12032-014-0219-x. [DOI] [PubMed] [Google Scholar]
- Chen CZ, Li L, Lodish HF, Bartel DP. MicroRNAs modulate hematopoietic lineage differentiation. Science. 2004;303:83–6. doi: 10.1126/science.1091903. [DOI] [PubMed] [Google Scholar]