

Abstract
Multimodal GABA-immunoreactive feedback neurons in the honeybee brain connecting the output region of the mushroom body with its input are expected to tune the input to the mushroom body in an experience-dependent way. These neurons are known to change their rate responses to learned olfactory stimuli. In this work we ask whether these neurons also transmit learned attentional effects during multisensory integration. We find that a visual context and an olfactory cue change the rate responses of these neurons after learning according to the associated values of both context and cue. The learned visual context promotes attentional response selection by enhancing olfactory stimulus valuation at both the behavioral and the neural level. During a rewarded visual context, bees reacted faster and more reliably to a rewarded odor. We interpreted this as the result of the observed enhanced neural discharge toward the odor. An unrewarded context reduced already low rate responses to the unrewarded odor. In addition to stimulus valuation, these feedback neurons generate a neural error signal after an incorrect behavioral response. This might act as a learning signal in feedback neurons. All of these effects were exclusively found in trials in which the animal prepares for a motor response that happens during attentional stimulus selection. We discuss possible implications of the results for the feedback connections of the mushroom body.
Keywords: multisensory integration, olfactory cue learning, visual context learning, electrophysiology, attention
humans and animals derive and integrate values from multiple stimuli in different environmental contexts and evaluate the chosen action to receive the highest reward possible in a particular context. A specific context can therefore either enhance or attenuate the attention directed to a cue and thereby guide reward expectation and the attentional selection of a behavioral response (Cunningham et al. 2009; Tversky et al. 1990). Because the same cue might represent different reward values in different contexts, the integration of context and cue value is expected from a neural comparator region, preferentially composed of neural circuits connecting state-dependent sensory processing with appropriate premotor circuits.
A context stimulus is presented for an extended period of time and provides a defined environmental background in which cue and reward emerge. Specific cues occur in close temporal relationship to a reward. Vertebrates as well as insects use certain sensory contexts to either facilitate or attenuate the processing of a cue and adapt their behavior accordingly (Calvert et al. 2000; Eimer and Schröger 1998; Gottfried and Dolan 2003; Matsumoto and Mizunami 2004; Menzel et al. 2007; Stein and Meredith 1993). Honeybees use context information to enhance the discrimination of cues (Gerber and Smith 1998; Mota et al. 2011). In particular, visual pretraining of a color before subsequent visual and olfactory compound training shortens response latencies and enhances the frequency and duration of behavioral responses to the odor (Gerber and Smith 1998). This is intriguing as harnessed bees do not show a conditioned response to a learned color alone (Gerber and Smith 1998; Hori et al. 2006; Mota et al. 2011; Niggebrügge et al. 2009). Despite this incapacity, bees can discriminate odors solely on the basis of a previous color signaling reward or no reward contingencies during an occasion-setting paradigm (Mota et al. 2011). According to these studies, reward prediction appears to be associated with the visual context in which the olfactory cue appears.
The understanding of neural value integration of both context and cue is still poorly understood. However, associative plasticity reflecting the learned value of single stimuli has been documented in confined neural circuits of the vertebrate prefrontal cortex (PFC) (Hosokawa et al. 2013; Kennerly et al. 2011) and the insect mushroom body (MB) extrinsic neurons (ENs) (Haehnel and Menzel 2011; Liu and Davis 2009; Okada et al. 2007; Strube-Bloss et al. 2011). But how are both learned values of single stimuli and a given context integrated and evaluated for goal-directed behavior? We want to answer the particular question of how a visual context modulates olfactory processing in a confined neural circuit. Therefore, we focus on one class of MB ENs exhibiting important features for value integration of multisensory cues, the GABA-immunoreactive (-ir) interneurons of the protocerebral calycal tract (PCT) that connect sensory input (calyx) with premotor output sides (lobes) of the MB, a high-order integration center of the insect brain (Heisenberg 2003; Menzel 2012). PCT neurons are multimodal (Gronenberg 1987; Homberg and Erber 1979; Rybak and Menzel 1993; Schildberger 1981) and express associative plasticity to odors in the hours-to-day range (Grünewald 1999b; Haehnel and Menzel 2011, 2012).
We adopted the combined visual and olfactory learning paradigm used by Gerber and Smith (1998). While recording from the multimodal PCT neurons, we trained the bees to learn that one odor is rewarded in one visual (color) context, whereas another odor is not rewarded in another visual context. Rewarded and unrewarded odors were tested alone, and each odor was also tested during the rewarded and the unrewarded visual context. This rather complex design was necessary to answer the following questions: Does a specific visual context rather enhance or attenuate the attention to and the processing of an olfactory cue compared with odor presentation alone (without a visual context)? How does this modulated processing guide reward expectation and the attentional selection of a behavioral response?
We hypothesized that the visual context modulates the processing of the odor in these neurons. Because a context usually either enhances or attenuates attention to learned cues, we further hypothesized that response modulation happens during attentional stimulus selection when the bee performs the conditioned response (proboscis extension response, PER). Such a property would inform us about the transmission of learned attentional neural signatures from the output side of the MB to both premotor circuits and to its input side, possibly controlling the retrieval and processing and the selection of a motor action in response to learned information in the MB. Indeed, we found that PCT neurons are particularly well suited for such a function because they integrate the acquired values of both visual context and olfactory cue exclusively before the occurrence of the conditioned response, similarly to what was demonstrated for PFC neurons in the mammalian cortex (Kaping et al. 2011).
MATERIALS AND METHODS
Animal Treatment
Twenty foraging honeybees (A. mellifera carnica) were caught at the hive entrance, anesthetized on ice, and harnessed in metal tubes, as described by Bitterman et al. (1983). They were not fed before the experiments to ensure that the bees were hungry and motivated. The experiment started ∼1 h after the bees were harnessed. Only bees showing the proboscis extension response (PER) after one antenna was touched with 30% sucrose solution were included in experiments. After each experimental phase, intact reflexes were tested by observing the unconditioned response, the PER, after applying sucrose to the antenna.
Dissection
A window (1.5 mm2) was cut into the head capsule between the compound eyes along a sagittal plane with the head fixed to the stage with low-melting temperature dental wax (Eicosane; Sigma). The head glands and trachea sacks located on the surface of the brain were cautiously moved aside until the vertical lobe could be clearly identified. The electrode for extracellular recordings from PCT neurons was inserted at the medial-lateral border of the left vertical lobe and placed 60–250 μm below the anterior surface by means of a micromanipulator. Micro-ruby (Thermo Fisher Scientific) was attached to the tip of the multiwire electrode to stain the electrode position inside of the brain and to enable investigation of the stained region by means of confocal microscopy after the experiment. The reference electrode was inserted either into the dorsal region of the right compound eye or into the median ocellus. A silver wire electrode was inserted between the right compound eye and the right lateral ocellus for electromyogram recordings of the M17 muscle that innervates the proboscis and whose activity reflects proboscis movement.
After electrode placement, the window in the head capsule was covered with silicon (2 components of KWIK-SIL, mixture 1:1; Sarasota, FL) to prevent the brain from drying out and to stabilize the electrode. The experiment started 30 min later, when the silicon had bonded and the animal recovered from the dissection.
Visualization of Recording Position
After the experiment, the brains were dissected, fixed overnight in 4% formaldehyde with 1 μl of Lucifer yellow for enhanced background staining, washed in PBS, dehydrated in rising concentrations (20, 50, 70, 99, and 100%) of alcohol, and cleared with methyl salicylate. A Leica TCS SP2 confocal laser scanning microscope (Wetzlar, Germany) was used for scanning with a ×20 or ×10 water objective. Two excitation wavelengths were applied, 428 nm for the background (Lucifer yellow) and 560 nm for micro-ruby were used. A schematic overview for the recorded neural circuit within the bee brain is visualized in Fig. 1A. See Fig. 1, B and C, for the localization of the recording position based on confocal images of the stained tract.
Fig. 1.

Recorded neurons of the protocerebellar tract (PCT) and spike sorting of neural data. A: 3-dimensional (3D) model of the honeybee brain. The α-lobe (α-L) receives information from the sensory input region of the mushroom body, the median and lateral calyxes (MC, LC). In the α-L, PCT neurons feed sensory information back to the input region. Somata clusters of PCT neurons are located at the anterior lateroventral protocerebrum (AL). B: localization of the recording site. PCT somata and their primary neurites and arborizations in the α-L are stained by the recording electrode. C: cobalt chloride staining of α-L and somata clusters at the AL at the level of the α-exit (∼100 μm) serves as a reference for extracellular staining. D: spike sorting of neural data. The raw data are sorted with a template sorting algorithm (Spike 2); sorted units are displayed separately and in an overdraw mode.
Behavioral Task
We adapted a behavioral paradigm (Gerber and Smith 1998) for our purpose to study visual context modulation of olfactory processing in a within-animal design (Fig. 2, A and B). For baseline neuronal responses of each unit, 3 odors and 3 colors were applied before training started, 5 times each with an intertrial interval (ITI) of 1 min. Two colors and two odors were randomly chosen to serve as the conditioned stimuli during training. Differential color context training started 10 min later. One color (context duration: 12 s) was paired during 6 trials (ITI of 2 min) with a sucrose reward (C+) 11 s after color onset. The unrewarded color (C−) was presented alone, also for 6 training trials. The reward was a droplet of 30% sugar water (attached to the tip of a toothpick). During unrewarded trials, a toothpick with water was moved toward the animal to control for humidity stimuli and movement-related activity. After 10 min, compound color odor training began. During the rewarded condition, the previously rewarded color (the previous reward status is indicated by superscript: C+) was now accompanied by an odor cue (duration: 4 s in duration), 8 s after color onset. This set was rewarded (C+O+). C− was paired with another odor, and this set was not rewarded (C−O−). Color and odor terminated simultaneously. Both conditions were trained by 6 trials each with an ISI of 2 min. Thirty minutes later the bee was tested three times for the single stimuli (C+, C−, O+, O−), the trained compounds (C+O+, C−O−), and the reversed compounds (C−O+, C+O−). Behavioral data (percentage of PERs during 3 test trials per stimulus condition) were statistically evaluated using the McNemar test.
Fig. 2.
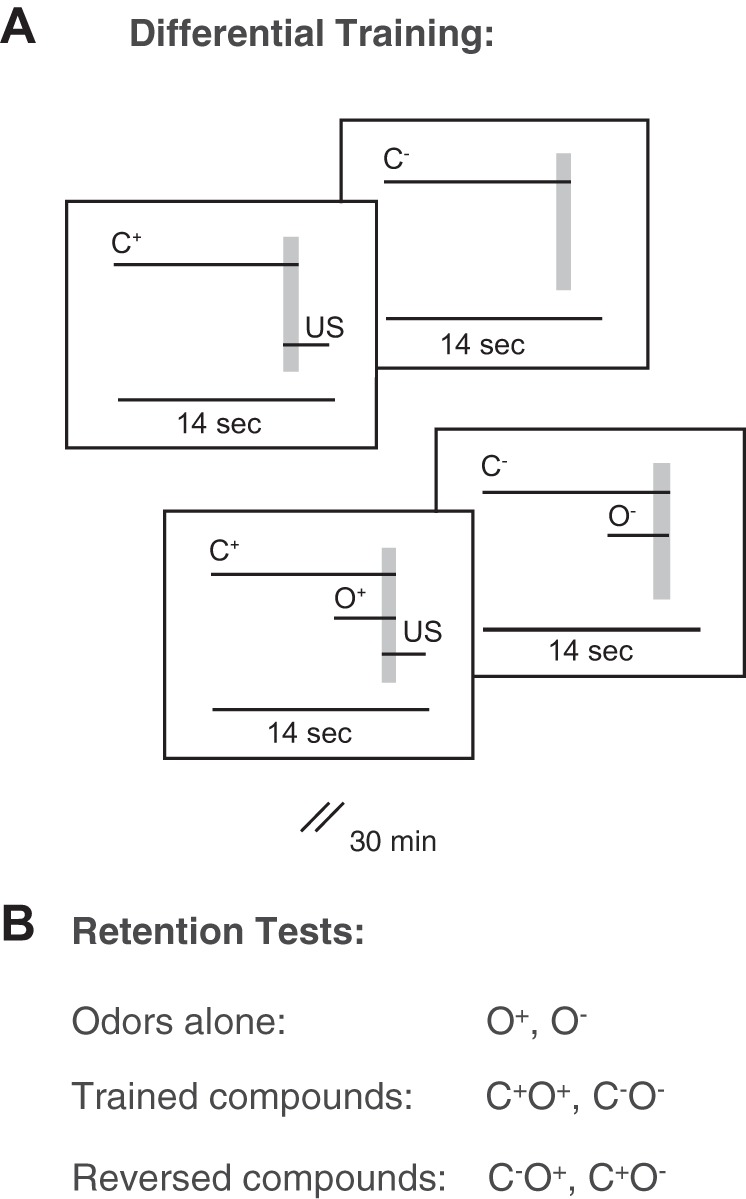
Behavioral paradigm of combined visual and olfactory conditioning. A: differential training. For visual pretraining, stimulation with a color for 12 s and application of a drop of 30% sucrose solution (US) to the mouthparts of the bee served as the rewarded visual context, C+. A second visual context, C−, was not rewarded. The US was applied 11 s after C+ onset for 3 s, outlasting color illumination for 2 s after a 1-s overlap (shaded vertical rectangle). Both contexts, C+ and C−, were trained during 6 training trials each. Subsequently, bees underwent compound training. During the visual context C+, an odor, O+, was applied 8 s after color onset, followed by a reward (11 s after color onset, as during color pretraining). During the visual context C−, a different odor, O−, was applied, that was not followed by a reward. Each compound was trained during 6 trials. B: retention tests. Thirty minutes after the last compound training trial, the 2 odors were presented without a reward and during 6 different stimulus conditions: alone (O+, O−), during the previously rewarded visual context (C+O+, C+O−), and during the previously unrewarded visual context (C−O+, C−O−).
Electrophysiology
Electrodes.
The electrode consisted of either two or three polyurethane-coated copper wires (14 μm in diameter; Electrisola, Escholzmatt, Switzerland) that were glued together with wax and attached to a piece of glass capillary (∼2 cm in length) for handling via the micromanipulator. The ends of the wires were de-insulated and attached to the amplifier input connectors by means of conducting silver glue. Resistances of single wires were in the range of 1 and 2 MΩ. Silver wires (0.05 mm in diameter; Advent Research Materials, Eynsham, UK) were used for the reference electrode as well as for the electromyogram recordings of M17 activity. The same method was used by Strube-Bloss et al. (2011) and Okada et al. (2007).
Amplifiers.
Each wire of the electrode was connected to the head stage of a preamplifier (npi electronic, Tamm, Germany). Filters were set to high pass of 10 Hz and low pass of 10 kHz. Hum noise (50 Hz) was eliminated by an additional filter (Hum Bug; Digitimer, Welwyn Garden City, UK). Neural activity was sampled with a rate of 20 kHz through an analog-to-digital converter (Micro1401 mk II; Cambridge Electronic Design, Cambridge, UK), and initial data analysis was performed using Spike2 software (Cambridge Electronic Design) including signal storage, control of stimulation devices, and preanalysis of the data.
Odor and Color Stimulation
Odor stimulation was computer controlled, using an olfactometer with separate channels for each odor, as described elsewhere (Galizia et al. 1997). In each experiment, three different odors were used, in response to which the bee did not show a spontaneous PER. Odors were taken from the following list: alcohols: 1-octanol, 1-hexanol, 1-nonanol, and 1-heptanol; aldehydes: heptanal and octanal; terpene: limonene (Sigma-Aldrich Chemie). Acquisition curves for these odors have been shown to be comparable in honeybees (e.g., Guerrieri et al. 2005). Two of the odors were used for differential conditioning, and the third as a control odor. The olfactometer was placed in front of the bee such that the end of the outlet was at a distance of ∼5 cm to the bee's head. A constant airstream (speed: 1.5 m/s) was sent through a Teflon tube (6 mm in diameter). The control of magnetic valves via the Spike2 software allowed the addition of a particular odor to the airstream. An exhaust pipe behind the animal ensured that odor did not accumulate.
Color illumination was provided by a light guide connected to a lamp with filters for green (VG filters; Schott, Mainz, Germany), yellow (GG 570), and blue light (BG 12). The exit of the light guide was placed in front of the bee beside the odor pump. Light switches were conducted manually; the precise timing of on and off switches was announced by a sound coming from a loud speaker that was connected and controlled by the Spike2 software. Off switches were announced by a sound coming from a loud speaker that was connected and controlled by the Spike2 software. Considering the time until magnetic valves opened, the speed of the airflow, and the distance to the antennae, the delay with which the bee perceived the odor was 44.4 ms.
Spike Sorting
Channels for neuronal recording and electromyogram were high-pass filtered at 300 Hz using the Spike2 software (Cambridge Electronic Design). The semiautomated template matching algorithm of Spike2 was used for spike sorting (see Fig. 1D for raw spike trains and the template sorting algorithm). Sorting quality was controlled by means of a principal component analysis of the first three components of each sorted unit. The recorded M17 activity was separated from noise by threshold sorting in Spike2. A total of 116 units from 20 bees were identified through spike sorting. The number of recorded units per bee ranged from 1 to 6.
Response Detection for M17 Activity
Rate responses were estimated with a kernel convolution with a sliding window width of 50 ms. Therefore, the spike trains of the muscle activity during training sessions were binned with 1-ms precision (1-ms bins) in a 2-s time window from stimulus onset (before reward application). During test sessions, a 4-s time window after stimulus onset was chosen for response detection. After convolution, a threshold was applied: as soon as more than three spikes within the sliding window emerged, a response was detected and counted as a PER, the conditioned response, as described by Smith and Menzel (1989).
Analysis of Neuronal Data
We analyzed neural activity during two defined time windows for 2 s, respectively: the first time window (W1) started at odor onset and quantified the neural odor response; the second time window (W2) started 2 s after odor onset and before a behavioral output and quantified reward expectation. We investigated odor responses and reward expectation when odors were tested alone (O+, O−), during the rewarded context (C+O+, C+O−), and during the unrewarded context (C−O+, C−O−). To compare these six stimulus conditions, we constructed peristimulus time histograms with a bin size of 50 ms for all recorded units (n = 116). Firing rates were normalized by using the antecedent ongoing activity between 1 and 3 s before the first cue onset on a trial-by-trial basis for each individual cell. Z scores were calculated from an approximate Poisson distribution, as described previously (Totah et al. 2009), where Z is calculated on the basis of the observed and expected number of spikes per bin [(observed number of spikes per bin) − (expected number of spikes)]/√expected number of spikes, where the expected number of spikes = [(total number of spikes during baseline time period)/(baseline time duration)] × time bin size. With the use of this equation, an excitatory unit was defined as significantly responding if the Z score in one bin was above 2.36 (which corresponds to a P value <0.01) or below 1.28 for inhibitory responses (P < 0.1). The lower threshold for inhibitory responses was chosen to compensate for the fact that there can only be zero spikes, but no negative spikes. Two consecutive bins had to exceed the defined response threshold. To investigate visual modulation of olfactory responses, we first calculated the grand average of all recorded neurons and trials. Mean normalized rates were compared using repeated-measures ANOVA with the six stimulus conditions as the within-subject factor. The units were then grouped based on the subsequent behavior of the animal (trials with PER vs. trials without PER) to test whether a potential modulation depends on a behavioral output: the conditioned response, PER. Population activity of all recorded units (n = 116) of these two groups (PER vs. no-PER groups) was compared for the same stimulus condition (e.g., neural response to the O+ in PER trials vs. no-PER trials). We defined time (in time bins) as the within-subject factor and behavior (PER vs. no-PER trials) as the between-subject factor, and we calculated main effects for each stimulus condition for both time windows using repeated-measures ANOVA. Thus here we compare, on a trial-by-trial basis, whether the population response differed during each time window. Note that this analysis differs from the unit-wise analysis described above: here, units with no ongoing activity were excluded.
In a next step, we calculated whether the stimulus conditions (within-subject factor) evoked different responses during both time windows, this time investigating PER trials only using repeated-measures ANOVA. We then counted the number of active units that contribute to the stimulus-evoked responses for each condition. As a last step, we investigated neural error responses following erroneous behavior. To compare rates, we calculated the rate difference between the time the reward ceased during rewarded training trials (5.8–6.6 s) and the previous time bins (4.5–5.3 s), and then calculated statistical differences using repeated-measures ANOVA.
RESULTS
Behavioral Responses to Rewarded Odor Occur Both More Often and Faster During the Rewarded Visual Context
In the following analysis, the behavior of 20 recorded bees during retention tests (after olfactory and visual training) will be described. Figure 3A shows the percentage of PERs from the 20 recorded bees during a total of 60 test trials per stimulus condition. PERs are quantified for the tests of both odors alone and when odors were tested during rewarded and unrewarded visual contexts. Bees performed a PER to the rewarded odor (O+) significantly more often when tested during the rewarded visual context (in 45% of all trials) than to the same odor when tested during the unrewarded context (in 27% of all trials; χ2 = 9.091, P = 0.003).
Fig. 3.
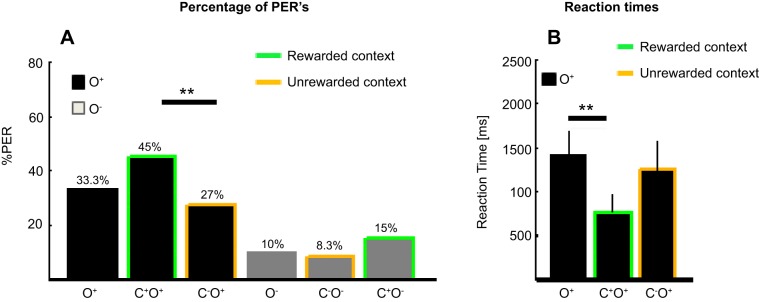
Behavioral performance. A: the percentage of conditioned responses (proboscis extension response, PER) from a total of 60 trials per stimulus condition is shown. The conditioned odors (rewarded odor O+, black bars; unrewarded odor O−, gray bars) were tested alone and during the previously rewarded and unrewarded visual contexts (C+, green outline; C−, orange outline). Bees had a clear preference to respond to the previously rewarded odor, O+, either alone or during a visual context and significantly less to the previously unrewarded odor, O−, either alone or during a visual context (all P values between 0.001 and 0.04; not indicated). When presented during the rewarded visual context, the rewarded odor (green outline) elicited significantly more PERs than when presented during the unrewarded context (orange outline) (**P < 0.01). B: behavioral reaction times to the rewarded odor O+ when tested alone (no outline), during the rewarded visual context C+ (green outline), or during the unrewarded visual context C− (orange outline) are compared. Behavioral reaction times were reduced during the rewarded visual context compared with odor presentation alone (**P < 0.01). Asterisks depict P values of pairwise comparisons corrected for multiple comparisons.
The rewarded odor, when tested both alone and during the rewarded context, also elicited significantly more PERs than the unrewarded odor, either alone or during the rewarded or unrewarded context (all P values between 0.001 and 0.04). Bees did not extend their probosces to the rewarded or unrewarded visual context alone (results not shown). We additionally analyzed whether reaction times to the rewarded odor differed depending on the context in which the odor was presented (Fig. 3B). Bees reacted faster with a PER to the rewarded odor during the rewarded visual context (mean reaction time: 773.2 ms) compared with odor presentations alone [mean reaction time: 1,416 ms; repeated-measures ANOVA: F(1, 10) = 13.397, P = 0.004]. There was no significant difference in reaction time when the rewarded odor tested during the unrewarded context (mean reaction time: 1,250 ms) was compared with both the rewarded odor tested during the rewarded context and the rewarded odor tested alone (see reaction times above). Thus bees responded both more often and faster to the rewarded odor when the odor was tested during the rewarded visual context compared with odor presentation during the unrewarded context or with odor presentation alone, respectively.
The Rewarded Visual Context Enhances Neural Responses to the Rewarded Odor
Neural activity was evaluated for all recorded 116 units, recorded from 20 bees, and for all 6 stimulus conditions (O+ and O− alone and during both the rewarded and unrewarded visual context: C+O+, C+O−, C−O+, C−O−). All trials (PER and no-PER trials) were considered, and the responses to the odors alone (W1) and during reward expectation (W2) were quantified. During retention tests, the grand-average responses to the rewarded odor during the rewarded visual context were significantly higher in both time windows than to all other stimulus conditions, with one exception: the rewarded odor during the unrewarded context [repeated-measures ANOVA, W1: F(7, 805) = 9.999, P < 0.001; W2: F(7, 805) = 4.661, P < 0.001]. This indicates that the presence of the rewarded visual context enhances rate responses to the rewarded odor and during subsequent reward expectation compared with the respective rate responses to the rewarded odor alone.
Rate Differences Between PER and no-PER Trials Toward the Same Stimulus Condition
We hypothesized that visual modulation of olfactory responses occurs in particular during attentional stimulus selection. Therefore, we compared neural activity of all recorded units in both time windows during PER and no-PER trials. Figure 4 illustrates time-resolved normalized firing rates to all six stimulus conditions. Rate responses to the rewarded odor, presented either alone or during the rewarded or unrewarded visual context in W1 (odor responses), were enhanced during PER trials (Fig. 4, C and D) compared with no-PER trials (Fig. 4, A and B), whereas rate responses to the unrewarded odor, presented either alone or during the rewarded or unrewarded visual context, were reduced. During W2 (reward expectation), rate responses were enhanced when the rewarded odor was tested alone or during the rewarded context during PER trials compared with no-PER trials. Spike rates were reduced in response to the unrewarded odor during PER trials compared with no-PER trials. Table 1 gives the statistical details about the main effects of the between-subject factor groups (PER vs. no-PER trials) based on the repeated-measures ANOVA.
Fig. 4.

Rate differences toward the stimulus conditions increased during trials with PER. Neural activity as a response to the single conditioned odors (O+, black line; O−; gray line) and to the conditioned odors during the rewarded (C+O+, green and black line; C+O−, green and gray line) or unrewarded visual context (C−O+, orange and black line; C−O−, orange and gray) is illustrated in the standardized spike count per second. Trial groupings were based on whether the bees performed a PER, the conditioned response (trials with PER, C and D) or no PER (trials without PER, upper panels A and B). All recorded units (n = 116) were considered; only active units were averaged (see Value integration for the number of active units per stimulus condition). Time windows for neural analysis are indicated by darker gray shading (W1, odor response; W2, reward expectation; white vertical line at 3 s depicts reward application during training). The light gray shading represents the start of the visual context (at −8 s). Rate responses to single stimuli and compounds were rather equal during no-PER trials (A and B), whereas pronounced rate differences to test conditions emerged only during PER trials (C and D) with higher rates in response to the previously rewarded odor presented alone (C) or during a visual context (D) and lower responses to the previously unrewarded stimuli. A graded rate response to the odors occurred during compound tests (D), depending on the acquired value of both the visual context and the odor, with the highest rate response to the O+ when presented during the rewarded context C+ (green and black), a reduced response to the same odor during the unrewarded context C− (orange and black), an absent odor response to the O− during the unrewarded context C− (orange and gray), and a low response to the O− during the rewarded context (green and gray). See text and Fig. 5A for statistical comparisons of the stimulus conditions during PER trials. Red arrow highlights neuronal error signals after the bees erroneously performed a PER following presentation of the unrewarded odor during both the rewarded and unrewarded contexts. See text for discussion.
Table 1.
Statistical comparison between trials with a PER and those without a PER for two time windows
| Main Effect |
Normalized Spike Rate |
|||
|---|---|---|---|---|
| Tested Stimulus Condition | F | P | PER | No PER |
| W1: Odor responses | ||||
| O+ | F(1,294) = 17.89 | <0.001 | 3.8 ± 0.6 | 0.7 ± 0.4 |
| C+O+ | F(1,300) = 6.096 | 0.04 | 4.6 ± 0.5 | 3.1 ± 0.4 |
| C+O− | F(1,286) = 5.49 | 0.024 | 3 ± 0.06 | 1.5 ± 0.3 |
| O− | F(1,273) = 9.373 | 0.002 | 1.2 ± 0.3 | 2.5 ± 0.2 |
| C−O+ | ns | 1.5 ± 0.6 | 2.5 ± 0.2 | |
| C−O− | F(1,284) = 4.205 | 0.041 | 0.5 ± 0.8 | 2.2 ± 0.2 |
| W2: Reward expectation responses | ||||
| O+ | F(1,294) = 17.89 | <0.001 | 3.8 ± 0.6 | 0.7 ± 0.4 |
| C+O+ | F(1,300) = 3.379 | <0.001 | 4.7 ± 0.6 | 1.9 ± 0.5 |
| O− | F(1,273) = 5.382 | 0.021 | 0.5 ± 0.3 | 1.3 ± 0.2 |
Values represent statistical comparison between trials with a proboscis extension response (PER) and those without a PER for the first (W1, odor responses) and second (W2, reward expectation) time windows. Odors were tested alone (O+, O−), during the rewarded visual context (C+O+, C+O−), and during the unrewarded visual context (C−O+, C−O−). F and P values and normalized spike rate (means ± SD) for each group result from repeated-measured ANOVA with group (PER vs. no-PER trials) as the between-subject factor. For all but the C+O− condition, the normalized spike rate for odor responses (W1) differs significantly between PER and no-PER trials: responses to the rewarded odor, either alone or during the rewarded or unrewarded visual context were enhanced during PER trials as opposed to no-PER trials. Responses to the unrewarded odor either tested alone or tested during the unrewarded visual context were reduced during PER trials as opposed to no-PER trials. For reward expectation (W2), rates were enhanced when the rewarded odor was tested alone or during the rewarded context during PER trials as opposed to no-PER trials. Rate responses were reduced when the unrewarded odor was tested alone during PER trials as opposed to no-PER trials.
Rate Differences During PER Trials Between Different Stimulus Conditions
Next, we investigated further whether spike rates of all 116 recorded units from the 20 bees during PER trials only (Fig. 4, C and D) differ for the different stimulus conditions. Firing rates were significantly different for the six stimulus conditions for the first [W1: F(7, 70) = 32.735, P < 0.001] as well as the second time window [W2: F(7, 70) = 62.42, P < 0.001]. Whereas responses to the rewarded odor were enhanced during the rewarded context compared with responses to the same odor during the unrewarded context (P = 0.009) or when presented alone (P < 0.001), responses to the unrewarded odor were reduced during the unrewarded context compared with responses to the same odor both during the rewarded context (P = 0.024) or when presented alone (P = 0.02; Fig. 5A). This results in a gradual increase in rate responses toward the odors depending on the acquired value of both the visual context and the olfactory cue (Figs. 4D and 5A). This indicates that the rewarded visual context is able to enhance responses to the rewarded odor and that the unrewarded visual context further reduces already low responses to the unrewarded odor.
Fig. 5.
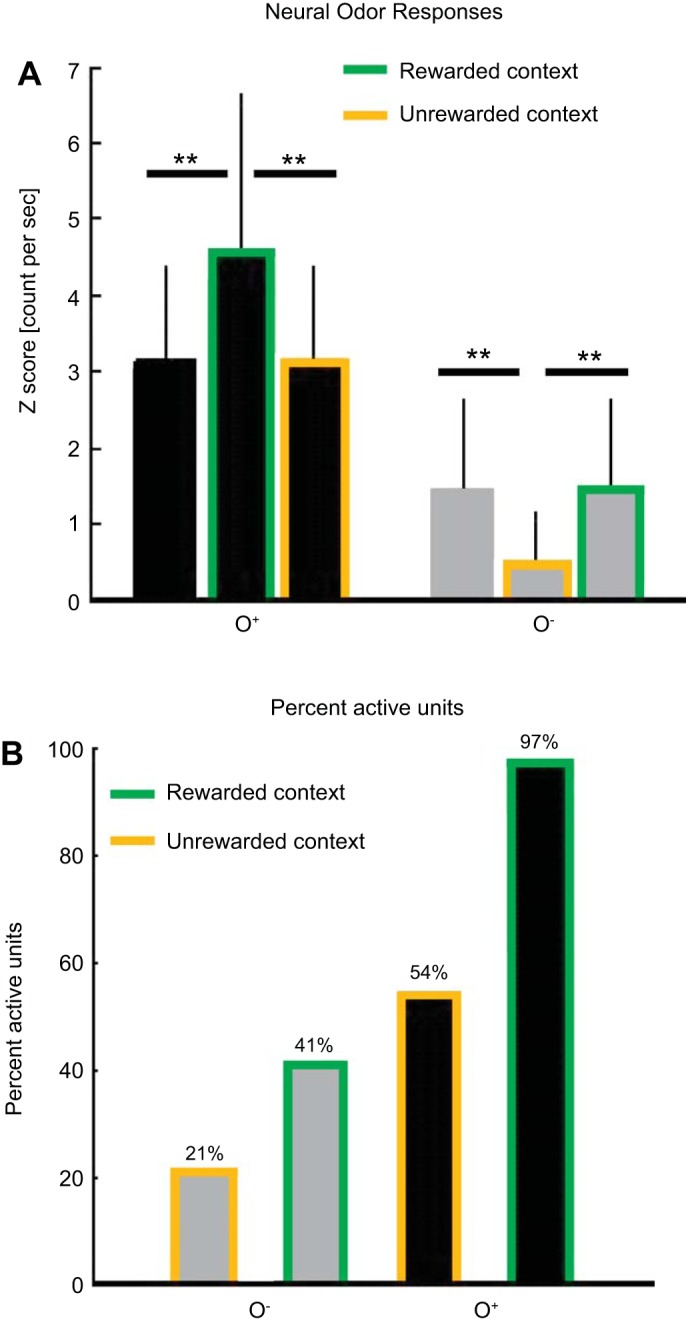
Neural odor responses during PER trials. A: averaged normalized firing rates to the conditioned odors (O+, black bars; O−, gray bars) alone and during the visual contexts (C+, green outline; C−, orange outline) during PER trials for the first time window, W1 (odor responses). For simplicity, significant differences are depicted only within an odor group. All pairwise comparisons between odors (with or without context) were highly significant (all P values <0.001). Responses to the rewarded odor were significantly enhanced when tested during the rewarded visual context (C+O+, green and black bar) compared with O+ presentation alone (O+, black bar; P < 0.001) and compared with O+ presentation during the unrewarded context (C−O+, orange and black bar; P = 0.009). Responses to the unrewarded odor were reduced when presented during the unrewarded context (C−O−, orange and gray bar) compared with O− presentation alone (gray bar; P = 0.02) and compared with O− presentation during the rewarded context (C+O−, green and gray bar). The results provide evidence of visual modulation of olfactory responses in 2 directions: the rewarded visual context can further enhance responses to the rewarded odor cue, whereas the unrewarded visual context can further reduce responses to the unrewarded odor. B: the percentage of active units in response to the 4 compound stimuli whose rate responses are outlined in A (together with single-odor responses). No activity threshold was applied. As soon as units fired, regardless of how frequently, the neuron was considered to be active. Of a total of 116 recorded units, 21% were active when the unrewarded odor O− was presented during the unrewarded context, and twice as many units (41%) were active when the same odor was presented during the rewarded context. Fifty-four percent of the recorded units fired in response to the rewarded odor O+ during the unrewarded context, and again, twice as many (97%) fired in response to O+ during the rewarded context.
When the rewarded or unrewarded odors were presented during the rewarded visual context, rate responses were still higher during reward expectation (W2) compared with rate responses elicited by the two odors (rewarded and unrewarded) alone (both P values = 0.01). This indicates that the rewarded visual context is able to enhance not only odor responses (as described above) but also reward expectation after the occurrence of both the rewarded and the unrewarded odors.
Value Integration
So far, we have found that PCT neurons exhibited higher rate responses to the odor as the value of the entire compound increased (Figs. 4D and 5A). The neurons differentiated four different compound values (in response to the odor). The lowest rate response occurred to the unrewarded odor during the unrewarded visual context and was enhanced when the same unrewarded odor was presented during the rewarded context. A stronger rate response was found to the rewarded odor during the unrewarded visual context, and the highest rate response was provoked by the rewarded odor during the rewarded visual context (Fig. 5A). Additionally, the number of active units (from a total of 116 recorded neurons) rose with the acquired value of the compounds in the same sequence: C−O−, 24 active units (21%); C+O−, 47 active units (41%); C−O+, 63 active units (54%); and C+O+, 113 active units (97%) (Fig. 5B). The number of active units responsive to the unrewarded odor doubled from the unrewarded to the rewarded visual context (from C−O− to the C+O− compound) and again for the rewarded odor from the unrewarded to the rewarded visual context (from C−O+ to the C+O+ compound). We conclude that visual context modulation of odor cue responses is based on the associated values of both context and cue, and that these values are reflected by the number of active neurons and the magnitude of the rate responses of these active neurons.
Neural Error Signals After Incorrect Performance
Because the bees had to learn to execute a conditioned response (PER) only after the rewarded set of compounds (C+O+), they performed an erroneous response when extending their probosces after presentation of the unrewarded compound (C−O−). We thus asked whether the recorded neurons reflect such an erroneous response during tests of the unrewarded compound.
Figure 4D shows that the neurons drastically increased their firing rate (see red arrow) after such an erroneous performance at the time the reward would have been terminated during training trials (6 s after odor onset). To compare rates (during the unrewarded compound test), we calculated the rate difference between the time the reward would have ceased during rewarded training trials (5.8–6.6 s) and the previous time bins (4.5–5.3 s). These differences were significantly different [F(7, 112) = 4.655, P < 0.001] and can be interpreted as an error signal. This error signal also occurred when the unrewarded odor was tested during the rewarded visual context (C+O−), suggesting that the error signal occurs in response to the odor cue, and not in response to the visual context. These error signals were not detected during correct behavioral performance or during trials in which no performance was executed. Importantly, they also were absent when the unrewarded odor was tested alone, without a visual context.
DISCUSSION
We show here, for the first time, that the learned visual context acts as a modulator of learned odor responses in high-order neurons of the mushroom body, the PCTs. Intriguingly, these neurons perfectly integrate the sum of the values associated with both visual context and odor cue exclusively before the performance of a conditioned response as shown by the gradual increase of odor responses toward the four different compounds. The presence of the rewarded context enhanced neural responses to the rewarded odor, whereas unrewarded odor responses were further reduced during the unrewarded context.
Also, behaviorally, the visual context influenced the conditioned response to the odor cue. First, we found that bees responded faster to the rewarded odor when tested during the rewarded visual context than when tested during presentation of odor alone. Second, the response to the previously rewarded odor was also more frequent during the rewarded context than during the unrewarded context. Gerber and Smith (1998) used a similar color and subsequent color/odor training scheme. They showed that visual pretraining (before compound training) shortened response latencies and enhanced both the frequency and duration of behavioral responses to the odor during tests. Whereas Gerber and Smith (1998) tested only the rewarded odor, we tested the rewarded and unrewarded odor in each context. We are thus able to produce results beyond those of Gerber and Smith by showing that after visual pretraining, the presence of the visual context induces an attention effect reflected in even faster responses to the rewarded odor than when the rewarded odor is tested alone.
Mota et al. (2011) demonstrated that bees learn to respond to an odor only when a previously rewarded color sets the occasion for the odor. We also found that behavioral responses occurred more often when the rewarded odor was announced by the rewarded color context, rather than the unrewarded context. Although the reinforced visual stimulus does not elicit the conditioned behavior, as described earlier (Gerber and Smith 1998; Hori et al. 2006; Mota et al. 2011; Niggebrügge et al. 2009), reward prediction obviously depends on the previously trained color. These behavioral results demonstrate that bees learn the color as a context stimulus for odor cue learning and that they use this information for subsequent action selection toward a learned olfactory cue, despite the fact that harnessed honeybees do not show the conditioned behavior toward the color.
Furthermore, we found that PCT neurons perfectly integrate the values associated with both visual context and odor cue exclusively before the performance of a conditioned response, a process described as stimulus valuation during attentional stimulus selection (Kaping et al. 2011). In test conditions that allow the animal's active participation to select a stimulus to which a motor response is performed, central brain neurons are described to estimate the value of this stimulus. The value is equivalent to the reward that follows after the selected motor action. No rate changes occur without the planning of a motor response. In our study the involvement of PCT neurons in attentional selection is documented by the correlation between neural and behavioral response changes. In trials when the conditioned response is planned, these neurons evaluate context and cues according to their acquired value for response selection. Both context and cue values are integrated in the firing rate toward the odor cue, and thereafter, during reward expectation. Attentional control thus prioritizes neural processing of the most relevant stimuli in a given context in reference to the expected outcome, and PCT neurons appear to participate in such a prioritizing process.
Enhanced rate responses in neurons of the anterior cingulate cortex (ACC) of rodents have been related to enhanced attention levels. Neural activity after the onset of a preceding visual preparatory cue was elevated before a correct behavioral response occurred (Totah et al. 2009). Also in primates, neural correlates of attentional selection and stimulus valuation in the PFC were found in test conditions that allowed the animal's active participation in stimulus selection (Kaping et al. 2011). In the Kaping et al. study, value predictions and the spatial identification of attentional targets were conveyed by largely separate neural populations but were integrated locally at the intersection of three major prefrontal areas (ventromedial PFC, ACC, and lateral PFC), which may constitute a functional hub within the larger attentional control network. Upon attentional stimulus selection, the firing rate of these neurons was modulated by the acquired value of the attended stimulus.
Also, in the honeybee brain, values are coded in different subpopulations of MB ENs. For example, the identified EN PE1 codes rewarded cues by reduced neural activity (Okada et al. 2007), and other ENs encode the rewarded context by enhanced activity (Hussaini and Menzel 2013). On the basis of our study findings, we conclude that the recorded PCT neurons constitute a multisensory value integration center specifically designed for overt action selection, comparable to neurons in the mammalian PFC. PCT neurons project back to neural circuits in the MB input, the calyxes that have been shown to be plastic. One could thus speculate that the successful coupling of context/cue and action could be stored there, and incoming stimuli could directly be evaluated concerning value and appropriate action.
In vertebrates, cortical areas involved in response selection, e.g., the frontal eye field, give feedback over the outcome of the action which is directed to sensory areas, increasing the representation for objects relevant to behavior (Desimone and Duncan 1995; Felleman and Van Essen 1991). Signaling an erroneous execution of a motor response is important to inform the sensory neurons about the conflict, the erroneous output. In our study behavioral responses (PERs) following the presentation of the unrewarded odor cue O− are erroneous: we observed a phasic excitatory error signal during such PER trials (see Fig. 4D, red arrow). This signal appeared during both contexts (C−O− and C+O−) at the time the reward would have been terminated during rewarded training trials and was absent when the unrewarded odor was tested alone. The fact that the error signal also occurred during the rewarded context, together with the unrewarded odor cue, suggests that the odor cue and not the visual context was used to determine whether the action selection process was erroneous or not. This is the first time that neural error signals in central brain neurons of the honeybee brain are described.
In vertebrates, a general role in conflict monitoring has been ascribed to the ACC (Botvinick et al. 2004). Error signals in neurons of the ACC in rats were found following incorrect choices (Totah et al. 2009). These error signals, as in our study, occurred in the same neurons that mediated attentional levels during a preparatory period (see above). Comparable to these results, the observed error signals in our study could be utilized by the neural network for conflict monitoring or serve as a reinforcement learning signal (Nieuwenhuis et al. 2004).
Neurons suited for stimulus valuation during attentional stimulus selection should connect highly processed and convergent sensory input with premotor output structures, possibly including feedback loops for iterative stimulus evaluation and attentional selection. In the honeybee brain, the multimodal GABA-ir neurons of the PCT are composed of axons branching out into the predominant output regions of the MB, the alpha lobe. They then feed back into its predominant sensory input region, the calyx (Grünewald 1999a). They might, therefore, play an important role in the integration of learned values in response to sensory information, translating them into goal-directed actions.
Regarding single-odor learning, intracellular recordings of the PCT neurons showed decreased rate responses (Grünewald 1999b), whereas calcium imaging of PCT neurons revealed both response decreases and increases to a trained odor after learning (Haehnel and Menzel 2011). For the case of multisensory learning, we presently show that more PCT neurons were activated and that activation gradually increased in direct relation to the value associated with the tested compound (see Fig. 5B). GABA-ir profiles of presumably PCT neurons at the MB output have been identified near the dendrites of other ENs, e.g., the PE1 neuron, potentially providing learning-dependent inhibitory input to the PE1 (Okada et al. 2007). It has been shown that the PE1 neuron indeed decreases its rate response to a learned odor and therefore reduces its inhibitory input onto inhibitory interneurons converging with descending premotor neurons (Okada et al., 2007). Enhanced firing to an odor cue in a rewarding context might thus enhance the possibility for a conditioned motor response through this PCT-PE1-premotor circuit. The enhanced inhibitory action of PCT neurons onto the PE1 and possibly other ENs (Haehnel and Menzel 2011) appears to explain cue learning-dependent reduction of subpopulations of EN but not rate enhancements as documented toward learned context stimuli by Hussaini and Menzel (2013). Thus the putatively inhibitory PCT neurons described in this article do not provide input to all MB ENs.
In summary, honeybees react faster and more reliably to a rewarded odor cue during a rewarded visual context than without or during the unrewarded context, indicating that the visual context enhances the attention of the animal. Upon response selection, the PCT's firing rate toward the odors perfectly matches the integrated sum of the acquired values of a visual context and an olfactory cue. Whereas the rewarded context directs the attention and enhances rate responses to the rewarded odor, the unrewarded context further reduces rate responses to the unrewarded odor. In addition to stimulus valuation, error signals were induced after erroneous response selection, indicating an additional role of PCT neurons in action evaluation. PCT neurons are thought to provide both local and recurrent inhibitory feedback at the MB input and output, respectively, and thus may inform a high-order sensory area and premotor structures about the relevance of stimulus combinations and executed actions.
DISCLOSURES
No conflicts of interest, financial or otherwise, are declared by the authors.
AUTHOR CONTRIBUTIONS
I.F. and R.M. conception and design of research; I.F. performed experiments; I.F. analyzed data; I.F. and R.M. interpreted results of experiments; I.F. prepared figures; I.F. drafted manuscript; I.F. and R.M. approved final version of manuscript; R.M. edited and revised manuscript.
ACKNOWLEDGMENTS
I. Filla was supported by the Bernstein Center for Theoretical Neuroscience, and R. Menzel by the ZEN Program of the Gemeinnützige Hertie Stiftung.
REFERENCES
- Bitterman ME, Menzel R, Fietz A, Schäfer S. Classical conditioning of proboscis extension in honeybees (Apis mellifera). J Comp Psychol 97: 107–119, 1983. [PubMed] [Google Scholar]
- Botvinick MM, Cohen JD, Carter CS. Conflict monitoring and anterior cingulate cortex: an update. Trends Cogn Sci 8: 539–546, 2004. [DOI] [PubMed] [Google Scholar]
- Calvert GA, Campbell R, Brammer MJ. Evidence from functional magnetic resonance imaging of crossmodal binding in the human heteromodal cortex. Curr Biol 10: 649–657, 2000. [DOI] [PubMed] [Google Scholar]
- Cunningham WA, Kesek A, Mowrer SM. Distinct orbitofrontal regions encode stimulus and choice valuation. J Cogn Neurosci 21: 1956–1966, 2009. [DOI] [PubMed] [Google Scholar]
- Desimone R, Duncan J. Neural mechanisms of selective visual attention. Annu Rev Neurosci 18: 193–222, 1995. [DOI] [PubMed] [Google Scholar]
- Eimer M, Schröger E. ERP effects of intermodal attention and cross-modal links in spatial attention. Psychophysiology 35: 313–327, 1998. [DOI] [PubMed] [Google Scholar]
- Felleman DJ, Van Essen DC. Distributed hierarchical processing in the primate cerebral cortex. Cereb Cortex 1: 1–47, 1991. [DOI] [PubMed] [Google Scholar]
- Galizia CG, Joerges J, Küttner A, Faber T, Menzel R. A semi-in-vivo preparation for optical recording of the insect brain. J Neurosci Methods 76: 61–69, 1997. [DOI] [PubMed] [Google Scholar]
- Gerber B, Smith B. Visual modulation of olfactory learning in honeybees. J Exp Biol 201: 2213–2217, 1998. [DOI] [PubMed] [Google Scholar]
- Gottfried JA, Dolan RJ. The nose smells what the eye sees: crossmodal visual facilitation of human olfactory perception. Neuron 39: 375–386, 2003. [DOI] [PubMed] [Google Scholar]
- Gronenberg W. Anatomical and physiological properties of feedback neurons of the mushroom bodies in the bee brain. Exp Biol 46: 115–125, 1987. [PubMed] [Google Scholar]
- Grünewald B. Morphology of feedback neurons in the mushroom body of the honeybee, Apis mellifera. J Comp Neurol 404: 114–126, 1999a. [DOI] [PubMed] [Google Scholar]
- Grünewald B. Physiological properties and response modulations of mushroom body feedback neurons during olfactory learning in the honeybee, Apis mellifera. J Comp Physiol A 185: 565–576, 1999b. [Google Scholar]
- Guerrieri F, Schubert M, Sandoz JC, Giurfa M. Perceptual and neural olfactory similarity in honeybees. PLoS Biol 3: e60, 2005. [DOI] [PMC free article] [PubMed] [Google Scholar]
- Haehnel M, Menzel R. Long-term memory and response generalization in mushroom body extrinsic neurons in the honeybee Apis mellifera. J Exp Biol 215: 559–565, 2012. [DOI] [PubMed] [Google Scholar]
- Haehnel M, Menzel R. Sensory representation and learning related plasticity in mushroom body extrinsic feedback neurons of the protocerebral tract. Front Syst Neurosci 4: 1–13, 2011. [DOI] [PMC free article] [PubMed] [Google Scholar]
- Heisenberg M. Mushroom body memoir: from maps to models. Nat Rev Neurosci 4: 266–275, 2003. [DOI] [PubMed] [Google Scholar]
- Homberg U, Erber J. Response characteristics and identification of extrinsic mushroom body neurons of the brain. Z Naturf 34c: 612–615, 1979. [Google Scholar]
- Hori S, Takeuchi H, Arikawa K, Kinoshita M, Ichikawa N, Sasaki M, Kubo T. Associative visual learning, color discrimination, and chromatic adaptation in the harnessed honeybee Apis mellifera L. J Comp Physiol A Neuroethol Sens Neural Behav Physiol 192: 691–700, 2006. [DOI] [PubMed] [Google Scholar]
- Hosokawa T, Kennerley SW, Sloan J, Wallis JD. Single-neuron mechanisms underlying cost-benefit analysis in frontal cortex. J Neurosci 44: 17385–17397, 2013. [DOI] [PMC free article] [PubMed] [Google Scholar]
- Hussaini SA, Menzel R. Mushroom body extrinsic neurons in the honeybee brain encode cues and contexts differently. J Neurosci 33: 7154–7164, 2013. [DOI] [PMC free article] [PubMed] [Google Scholar]
- Kaping D, Vinck M, Hutchison RM, Everling S, Womelsdorf T. Specific contributions of ventromedial, anterior cingulate, and lateral prefrontal cortex for attentional selection and stimulus valuation. PLoS Biol 9: e1001224, 2011. [DOI] [PMC free article] [PubMed] [Google Scholar]
- Kennerley SW, Behrens TE, Wallis JD. Double dissociation of value computations in orbitofrontal and anterior cingulate neurons. Nat Neurosci 14: 1581–1589, 2011. [DOI] [PMC free article] [PubMed] [Google Scholar]
- Liu X, Davis RL. The GABAergic anterior paired lateral neuron suppresses and is suppressed by olfactory learning. Nat Neurosci 12: 53–59, 2009. [DOI] [PMC free article] [PubMed] [Google Scholar]
- Matsumoto Y, Mizunami M. Context-dependent olfactory learning in an insect. Learn Mem 11: 288–293, 2004. [DOI] [PMC free article] [PubMed] [Google Scholar]
- Menzel R. The honeybee as a model for understanding the basis of cognition. Nat Rev Neurosci 13: 758–768, 2012. [DOI] [PubMed] [Google Scholar]
- Menzel R, Brembs B, Giurfa M. Cognition in invertebrates. In: Evolution of Nervous Systems. Evolution of Nervous Systems in Invertebrates, edited by Kaas JH. Oxford: Academic, 2007, vol. II, p. 403–422. [Google Scholar]
- Mota T, Giurfa M, Sandoz JC. Color modulates olfactory learning in honeybees by an occasion-setting mechanism. Learn Mem 18: 144–155, 2011. [DOI] [PubMed] [Google Scholar]
- Nieuwenhuis S, Holroyd CB, Mol N, Coles MG. Reinforcement-related brain potentials from medial frontal cortex: origins and functional significance. Neurosci Biobehav Rev 28: 441–448, 2004. [DOI] [PubMed] [Google Scholar]
- Niggebrügge C, Leboulle G, Menzel R, Komischke B, de Ibarra NH. Fast learning but coarse discrimination of colors in restrained honeybees. J Exp Biol 212: 1344–1350, 2009. [DOI] [PubMed] [Google Scholar]
- Okada R, Rybak J, Manz G, Menzel R. Learning related plasticity in PE1 and other mushroom body-extrinsic neurons in the honeybee brain. J Neurosci 27: 11736–11747, 2007. [DOI] [PMC free article] [PubMed] [Google Scholar]
- Rybak J, Menzel R. Anatomy of the mushroom bodies in the honey bee brain: the neuronal connections of the alpha-lobe. J Comp Neurol 334: 444–465, 1993. [DOI] [PubMed] [Google Scholar]
- Schildberger K. Some physiological features of mushroom-body linked fibers in the house cricket brain. Naturwissenschaften 67: 623–624, 1981. [Google Scholar]
- Smith BH, Menzel R. The use of electromyogram recordings to quantify odourant discrimination in the honey bee, Apis mellifera. J Insect Physiol 35: 369–375, 1989. [Google Scholar]
- Stein BE, Meredith MA. The Merging of the Senses. Cambridge: The MIT Press, 1993. [Google Scholar]
- Strube-Bloss M, Nawrot MP, Menzel R. Mushroom body output neurons encode odor-reward associations. J Neurosci 31: 3120–3140, 2011. [DOI] [PMC free article] [PubMed] [Google Scholar]
- Totah NK, Kim YB, Homayoun H, Moghaddam B. Anterior cingulate neurons represent errors and preparatory attention within the same behavioral sequence. J Neurosci 29: 6418–6426, 2009. [DOI] [PMC free article] [PubMed] [Google Scholar]
- Tversky A, Slovic P, Kahneman D. The causes of preference reversal. Am Econ Rev 80: 204–217, 1990. [Google Scholar]