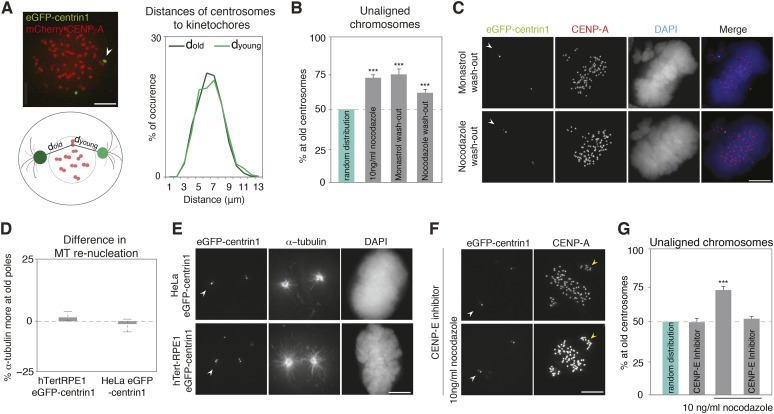
Figure 2. The asymmetric distribution of unaligned chromosomes depends on CENP-E.
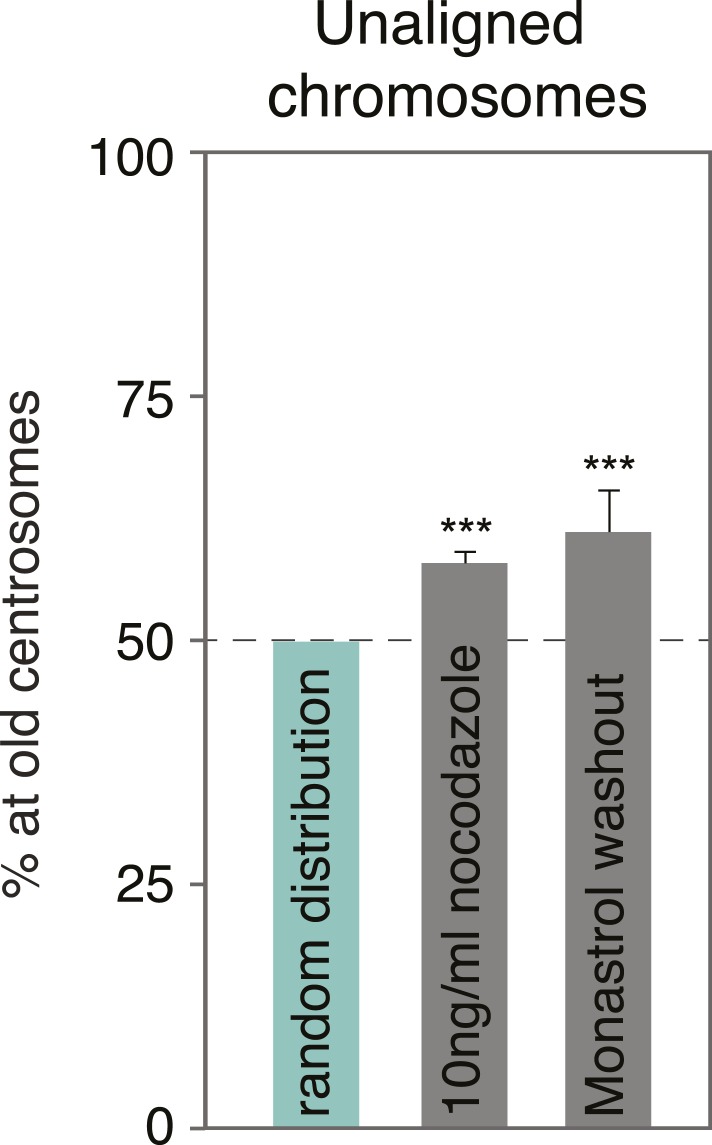
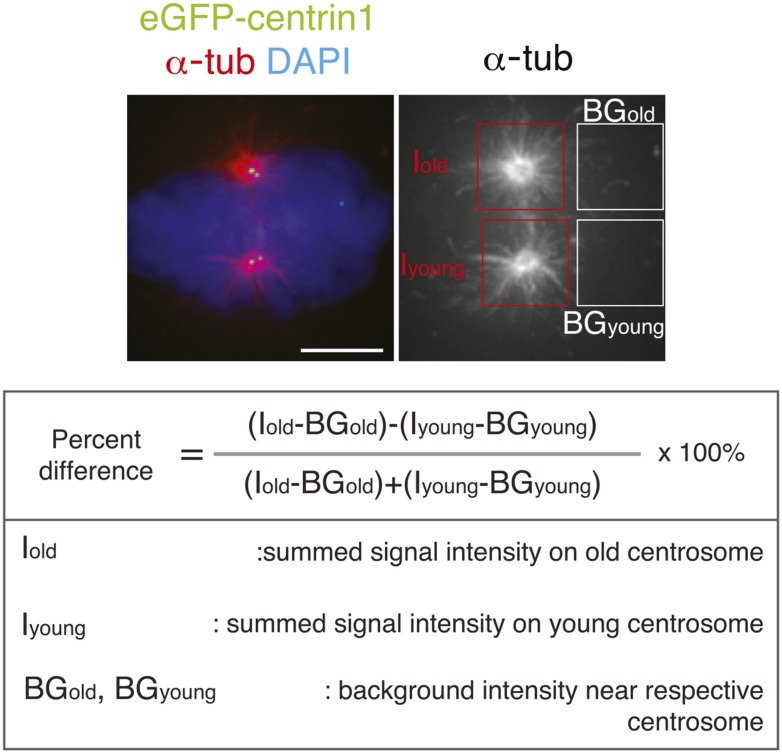
(A) An illustrative example of a HeLa-eGFP-centrin1/mCherry-CENP-A cell where the distances from centrosomes to kinetochores were measured 30 s before nuclear envelope breakdown (left top), assay to calculate the distances between kinetochores and centrosomes (left bottom), and distribution (right) of the measured distances. Values are determined from 24 cells and 1434 kinetochores in 6 independent experiments. White arrowheads indicate old centrosomes in all panels. Scale bars in all panels = 5 μm. (B) Proportion of unaligned chromosomes at the old centrosomes in hTert-RPE1-eGFP-centrin1 cells after indicated treatments. Error bars indicate s.e.m. *** indicates p ≤ 0.01 in Binomial test. (C) hTert-RPE1-eGFP-centrin1 cells stained for CENP-A and DAPI after indicated treatments. (D) Differences in the intensity of the microtubule asters in a re-nucleation assay at old and young centrosomes as shown in E, calculated in 32–49 cells in 3 independent experiments. Columns indicate the median, errors bars the 99% CI. Precise methodology is shown in Figure 2—figure supplement 2. (E) HeLa-eGFP-centrin1 or hTert-RPE1-eGFP-centrin1 cells stained for α-tubulin after a microtubule re-nucleation assay. (F) hTert-RPE1-eGFP-centrin1 cells treated with 10 ng/ml nocodazole and/or CENP-E inhibitor, and stained for CENP-A. Yellow arrowheads indicate unaligned kinetochores in the proximity of the young centrosome (G) Proportion of unaligned chromosomes at old centrosomes in hTert-RPE1-eGFP-centrin1 cells treated with 10 ng/ml nocodazole and/or CENP-E inhibitor. Error bars indicate s.e.m. *** indicates p ≤ 0.01 in Binomial test. For results of all individual experiments see Figure 2—source data 1.
DOI: http://dx.doi.org/10.7554/eLife.07909.006


