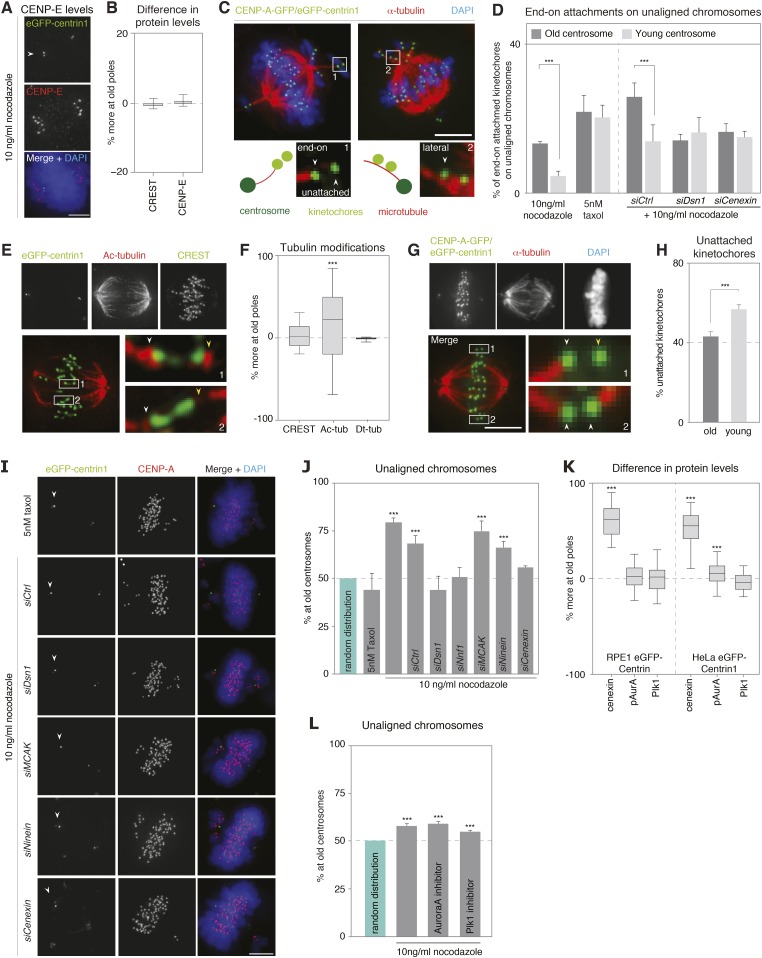
Figure 3. Kinetochore–microtubules bound to old centrosomes are more stable.
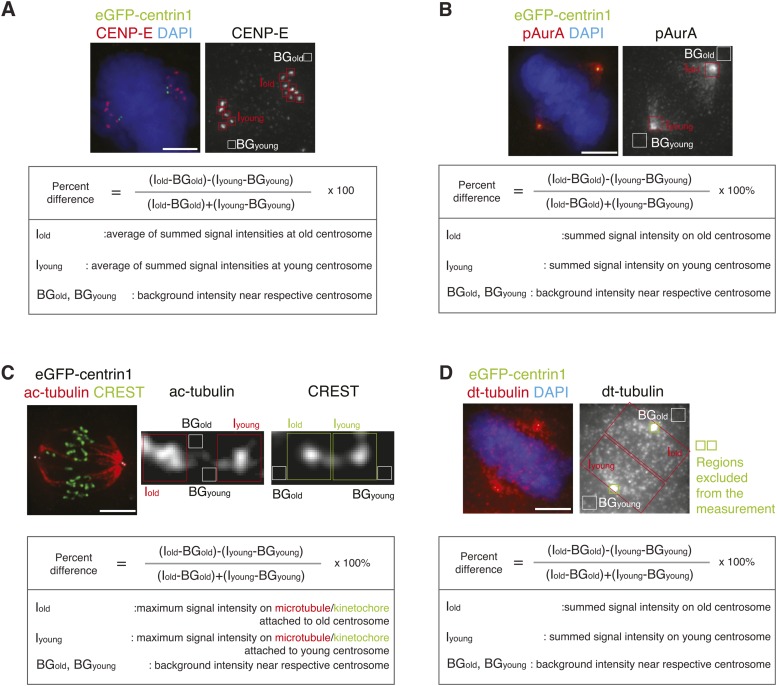
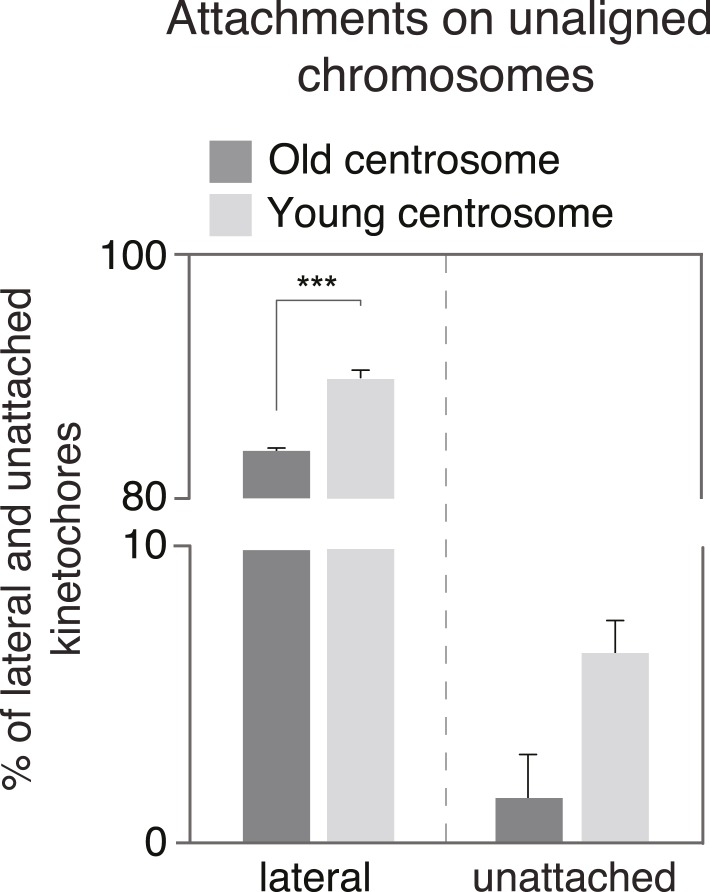
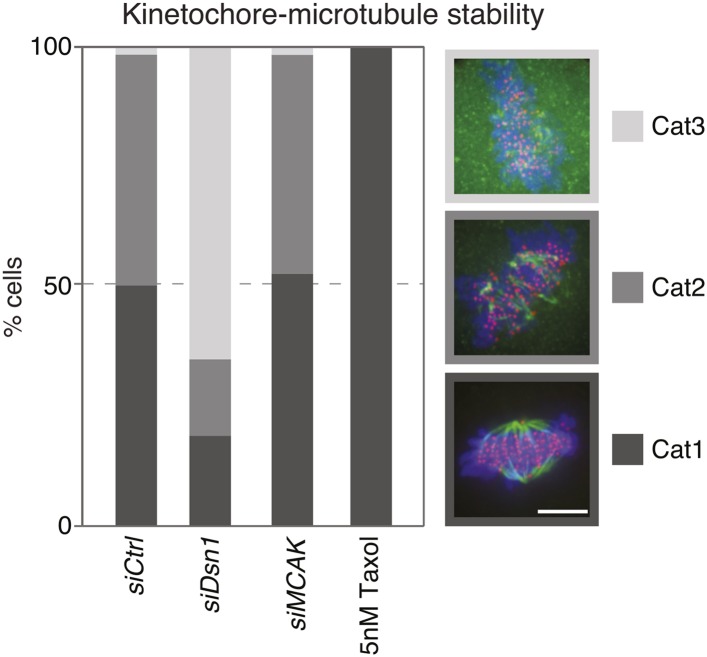
(A) hTert-RPE1-eGFP-centrin1 cells treated with 10 ng/ml nocodazole and stained for CENP-E and DAPI. White arrowheads indicate old centrosomes in all panels. Scale bars in all panels = 5 μm. (B) Differences in the abundance of CENP-E and CREST (kinetochore marker) at kinetochores bound to old and young centrosomes, calculated from 27 cells in 3 independent experiments. Columns indicate the median; error bars the 99% CI. (C) Immunofluorescence image of a HeLa-eGFP-centrin1/eGFP-CENP-A (green) cells treated with 10 ng/ml nocodazole, fixed with glutaraldehyde, and stained for α-tubulin (red) and DAPI (blue). Single kinetochores in every unaligned sister-kinetochore pair were classified as end-on attached, laterally attached or unattached. Inset 1 on the left shows an illustrative example of a kinetochore pair with one unattached and one end-on attached kinetochore; inset 2 on the right shows an illustrative example with 2 laterally attached kinetochores. (D) Quantification of individual end-on attached kinetochores at old and young centrosomes in HeLa-eGFP-centrin1/eGFP-CENP-A cells treated with 10 ng/ml nocodazole, 5 nM taxol and the indicated siRNAs and 10 ng/ml nocodazole. Percentages are based on 3 independent experiments with 29–50 cells. Error bars indicate s.e.m; *** indicates p ≤ 0.01 in paired t-test. (E) hTertRPE1-eGFP-centrin1 cells stained with anti-acetylated tubulin (red) and CREST (green) antibodies. Shown are total projections (upper panels) or maximum-intensity projections of 5–10 planes around the focal plane of interest (lower panels). White arrowheads indicate kinetochore–microtubules with stronger acetylation, yellow with weaker acetylation. Note that the white arrows are on the side of the old centrosome. (F) Differences in the abundance of acetylated tubulin on k-fibres of sister-kinetochores, and detyrosinated tubulin on the two spindle halves in hTertRPE1-eGFP-centrin1 cells, based on 3 independent experiments and 32–33 cells. Methodology is explained in Figure 3—figure supplement 2. Columns indicate the meadian, error bars the 99% CI. (G) HeLa-eGFP-centrin1/eGFP-CENP-A cells treated with 0.5 mM Ca2+ for 10 min stained for α-tubulin (red) and DAPI (blue). Shown are total projections (upper panels) or maximum-intensity projections of 5–10 planes around the focal plane of interest (lower panels). White arrowheads in zoom-ins indicate end-on attached kinetochores and yellow arrow the unattached kinetochore. (H) Percentage of unattached kinetochores oriented towards old or young poles based on 3 independent experiments and 33 cells. (I) hTert-RPE1-eGFP-centrin1 cells stained with CENP-A antibodies (red) and DAPI (blue) after treatment with 5 nM taxol or the indicated siRNAs and 10 ng/ml nocodazole. White arrowheads indicate old centrosome. (J) Proportion of unaligned chromosomes at old centrosome in hTert-RPE1-eGFP-centrin1 cells treated with 5 nM taxol or with 10 ng/ml nocodazole after the indicated siRNA treatment. Error bars indicate s.e.m; *** indicates p ≤ 0.01 in Binomial test. (K) Differences in the abundance of cenexin, phospho-Aurora-A, and Plk1 at old and young centrosomes in HeLa and hTert-RPE1-eGFP-centrin1 cells, based on 3 independent experiments and 41–113 cells. Methodology is explained in Figure 3—figure supplement 2. Columns indicate the median, error bars the 99% CI. (L) Proportion of unaligned chromosomes at old centrosome in HeLa-eGFP-centrin1 cells treated with Aurora-A or Plk1 inhibitors. Error bars indicate s.e.m; *** indicates p ≤ 0.01 in Binomial test. For results of all individual experiments see Figure 3—source data 1.
DOI: http://dx.doi.org/10.7554/eLife.07909.010

