

Abstract
Objectives:
Chemerin concentrations are elevated in obesity and associated with inflammation and insulin resistance. Exercise improves insulin sensitivity, which may be facilitated by changes in chemerin. We explored the effects of chronic exercise on chemerin levels in diet-induced obese mice.
Methods:
We divided 40 mice into 4 groups: high-fat diet/exercise, high-fat diet/sedentary, normal diet/exercise, and normal diet/sedentary. A 9-week dietary intervention was followed by a 12-week exercise intervention (treadmill run: 11 m/min for 30 min, 3×/week). We analyzed blood samples before and after the exercise intervention. We used t-tests and linear regression to examine changes in chemerin, insulin resistance, and inflammatory markers, and associations between changes in chemerin and all other biomarkers.
Results:
Chemerin increased significantly across all mice over the 12-week intervention (mean ± SD = 40.7 ± 77.8%, p = 0.01), and this increase was smaller in the exercise versus sedentary mice (27.2 ± 83.9% versus 54.9 ± 70.5%, p = 0.29). The increase among the high-fat diet/exercise mice was ~44% lower than the increase among the high-fat diet/sedentary mice (55.7 ± 54.9% versus 99.8 ± 57.7%, p = 0.12). The high-fat diet mice showed significant increases in insulin (773.5 ± 1286.6%, p < 0.0001) and homeostatic model assessment of insulin resistance (HOMA-IR; 846.5 ± 1723.3%, p < 0.01). Mediation analyses showed that increases in chemerin explained a substantial amount of the diet-induced increases in insulin and HOMA-IR.
Conclusion:
Chronic exercise may attenuate diet-driven increases in circulating chemerin, and the insulin resistance associated with a high-fat diet may be mediated by diet-induced increases in chemerin.
Keywords: chemerin, exercise, insulin resistance, obesity
Introduction
Obesity is a worldwide epidemic accounting for millions of deaths yearly, mainly due to cardiovascular disease (CVD), today’s leading cause of mortality in the US for men and women [CDC, 2014]. Obesity is associated with decreased insulin sensitivity, which can lead to a number of health problems including impaired glucose uptake and subsequent hyperglycemia, ultimately resulting in type 2 diabetes mellitus (T2DM) [Bouchard, 1991]. The diagnosis of T2DM is an independent risk factor for CVD [Grundy et al. 1999], and it is projected that, due to metabolic impairments associated with obesity, ~375 million individuals will develop either insulin resistance or full-blown T2DM by the year 2030 [WHO, 2014].
Individuals with obesity tend to exhibit elevated blood levels of chemerin, a recently discovered chemokine that has also been associated with T2DM [Bozaoglu et al. 2007, 2009]. Chemerin is a chemoattractant protein that acts as a ligand for the G-protein coupled receptor CMKLR1 (ChemR23 or DEZ) [Bozaoglu et al. 2007; Goralski et al. 2007; Takahashi et al. 2008]. In humans, chemerin mRNA is highly expressed in white adipose tissue, liver, and lung, while its cognate receptor CMKLR1 is predominantly expressed in immune cells as well as adipose tissue [Sell et al. 2009].
Previous research suggests a contribution of chemerin in the development of T2DM via its regulation of glucose uptake in both adipose tissue and skeletal muscle [Takahashi et al. 2008; Kralisch et al. 2009; Lehrke et al. 2009; Weigert et al. 2010]. Studies of obese mice have shown chemerin treatment to be negatively associated with serum insulin concentrations, and glucose uptake into liver and adipose tissue, and positively associated with blood glucose levels [Ernst et al. 2010]. In addition, Kralisch and colleagues [Kralisch et al. 2009] observed interleukin (IL) 1-β stimulation of cultured adipose tissue to elicit a marked increase in chemerin expression in 3T3-L1 adipocytes, leading to a decrease in insulin-stimulated glucose uptake.
It has been established that obesity is associated with the activation of certain inflammatory pathways, which are in turn associated with impaired insulin signaling and insulin resistance [Shoelson et al. 2003, 2006; Hotamisligil, 2003; Cai et al. 2005; Shi et al. 2006; Dey et al. 2007], though the physiological mechanisms underlying this relationship are not fully understood. Studies have also demonstrated positive correlations between serum chemerin levels and markers of inflammation known to be associated with obesity [Lehrke et al. 2009; Weigert et al. 2010]. This relationship between chemerin and elevated inflammatory markers may partially explain the decreased insulin action associated with increased adiposity.
Physical activity is known to reduce obesity and alleviate metabolic complications, partly via its augmentation of glucose utilization, in turn restoring homeostatic insulin levels [Menoutis, 2008; Chae et al. 2010]. Structured physical activity, therefore, may be imperative for individuals with impaired insulin signaling and/or T2DM for clearing chronically high levels of glucose. In addition, an anti-inflammatory environment is promoted by participating in exercise, potentially assisting in the protection against chronic diseases, including T2DM [Hellström et al. 1996].
A few recent studies have observed significant associations between lifestyle modifications, including aerobic and resistance training regimens (8 weeks to 1 year), and decreases in circulating chemerin levels [Lee et al. 2013; Venojarvi et al. 2013; Stefanov et al. 2014; Kim et al. 2014; Neuparth et al. 2014] as well as correlations between decreases in chemerin levels and improvements in indices of insulin sensitivity [Lee et al. 2013; Stefanov et al. 2014; Kim et al. 2014]. However, interventions in these recent studies often included dietary modifications in conjunction with exercise, and they did not attempt to tease out the independent effects of the diet and exercise components on chemerin or improvements in insulin sensitivity.
Despite the associations among chemerin, inflammatory markers, glucose tolerance, and exercise shown in current literature, it is unknown the role that chemerin plays in mediating the relationship between exercise and inflammation or insulin sensitivity. Providing a link between exercise, circulating chemerin, inflammation, and insulin sensitivity could prove beneficial in better understanding the mechanism underlying the positive metabolic effects of exercise in the obese population. This could also serve as a basis for the synthesis of a pharmacological agent that may help individuals with insulin resistance. Therefore, the purpose of this study was to determine the effects of a chronic exercise regimen on circulating chemerin levels and how changes in chemerin correlate with changes in insulin sensitivity and makers of chronic inflammation. We hypothesized that 12 weeks of aerobic exercise would result in a significant decrease in circulating chemerin levels. We also believed that the exercise-induced decrease in chemerin would be associated with decreases in inflammatory markers, serum insulin and glucose levels, and HOMA-IR.
Methods
Mice
A total of 44 diet-induced obese male mice (DIO C57Bl/6J; 42 days old) were purchased from Jackson Laboratories (Bar Harbor, ME) for this study. This particular strain of mouse was chosen because of its propensity to gain weight. Mice were divided into 4 groups (n = 11): high-fat diet/exercise (HFD/EX), high-fat diet/sedentary (HFD/SED), normal diet/exercise (ND/EX), and normal diet/sedentary (ND/SED). Animals were maintained (4 mice per cage) in the vivarium in the Life Science Complex at Syracuse University and monitored on a regular basis in compliance with IACUC regulations. The animals remained on a 12-hour light/dark cycle (lights on 6 a.m. to 6 p.m./lights off 6 p.m. to 6 a.m.) for the duration of the study, and the facility temperature was maintained at 70°F.
Diet
Mice were allowed both food and water ad libitum for the duration of the study. The normal and high-fat diets were administered for the duration of the study, including a 9-week period prior to the 12-week exercise intervention. The normal diet (3.5 kcal/g body weight) consisted of 17% energy from fat, 56% from carbohydrate, and 27% from protein, while the high-fat diet (5.1 kcal/g) was 59% fat, 22% carbohydrate, and 19% protein (Testdiet, St. Louis, MO).
Exercise protocol
Two six-lane treadmills were used for the exercise intervention (Columbus Instruments, Columbus, OH). Prior to initiating the training portion of the study, mice were familiarized with the treadmill by walking on the belt for 5 min at 7 m/min. During the second session mice walked at 11 m/min for 5 min. During the third session they ran for 10 min at the same speed. During the 12-week intervention, mice were exercised for 30 minutes, 3 times a week (MWF) at approximately 2:00 p.m. each time. Mice were rewarded with peanut butter puff treats following each exercise bout. All animals were weighed on Fridays for the duration of the exercise protocol.
Blood extraction
Blood sampling occurred both after a 9-week dietary intervention (‘baseline’) and after the 12-week exercise intervention. Animals were fasted for 12 hours at the time of extraction, and each extraction occurred within 48 hours of the last exercise bout to avoid detraining. To enhance blood flow to the tail, a heat lamp was set over the mice approximately 5 min prior to sampling. Mice were placed in a tail vein restrainer. Approximately 75 µl of blood was taken from the lateral tail vein and mixed with 25 µl ethylenediaminetetraacetic acid (EDTA). The sample was placed on ice until it was centrifuged at 3g for 20 min at 4ºC. The hematocrit and plasma were separated and stored in 1.5 ml tubes at −20ºC for further analysis.
Blood sample analyses
Chemerin
Circulating chemerin levels were measured using an enzyme-linked immunosorbent assay (ELISA). The ELISA was performed according to the manufacturer’s instructions (Cell Sciences, Canton, MA). Briefly, unbound sights were blocked to prevent false-positive results. The antibody was added to the appropriate wells, followed by a secondary IgG conjugated antibody. The results were obtained using a colorimetric measurement.
Insulin and inflammatory markers
Flow cytometry-based Luminex kits were used to measure plasma insulin, IL-6, and tumor necrosis factor (TNF)-α. Plasma samples (10 µl) were run in duplicate in a 96-well mouse adipokine Luminex plate. A mouse serum adipokine kit was used to examine insulin, IL-6, and TNF-α (Milliplex® Map, Mouse Serum Adipokine kit, #MADPK-71K). Briefly, 10 µl of standard or sample (in duplicate) was added to the designated wells, and 10 µl of assay buffer, 10 µl serum matrix, and 25 µl of Luminex beads were added and incubated overnight at 4ºC while shaking. The plate was then vacuumed and washed three times. Detection antibodies (50 µl) were added to each well and incubated for 30 min at room temperature, then 30 µl of streptavidin–phycoerythrin was added to each well and incubated for an additional 30 min. The plate was again vacuumed and washed three times with wash buffer and then 100 µl of sheath fluid was added to each well. Results were assessed using Milliplex Analysis Software.
Glucose
Approximately 5 µl of blood from each animal were used to assess fasting glucose levels. Blood glucose levels were assessed using a Trutest® glucose analyzer and disposable glucose strips (Hach Company, Loveland, CO).
Statistical analysis
We calculated means (±SD) of all variables at baseline and at the end of the 12-week exercise intervention. We used independent samples t-tests to compare circulating chemerin levels, insulin, glucose, HOMA-IR, inflammatory markers (IL-6, TNF-α), and weight between the ND and HFD mice prior to randomization to the EX and SED conditions. We also compared these values between the diet groups at the end of the 12-week intervention, and we used paired samples t-tests to examine the pre- to post-intervention changes in all measurements within each group. We then used separate general linear models to examine the unadjusted associations of the HFD and EX with pre- to post-intervention changes in circulating chemerin concentrations. We then included both diet (HFD versus ND) and exercise (SED versus EX) in the model to examine the independent and interaction effects of the HFD and exercise on the changes in chemerin over the 12-week intervention period. We ran similar models using markers of inflammation and insulin sensitivity as outcomes. In addition, we used simple and multivariable linear regression to estimate the pre- to post-intervention changes in insulin, glucose, HOMA-IR, and inflammatory markers associated with changes in circulating chemerin, controlling for diet type and exercise status. All analyses were conducted using SAS version 9.3 (SAS Institute, Cary, NC). An alpha level of 0.05 was used to determine statistical significance.
Results
Pre-intervention
A total of 44 mice completed the initial 9-week diet-only portion of the study, although two mice in the HFD group (one randomized to EX, one to SED) died prior to beginning the 12-week exercise intervention. The HFD mice weighed significantly more than the ND mice at week two of the diet-only protocol, and this difference persisted for the duration of the study. Out of the 42 mice in the combined diet and exercise groups, 40 completed the study protocol. Two mice in the EX group (both on the HFD) who were non-adherent to the exercise protocol were excluded from the analysis. The final sample sizes for the four diet/exercise groups were: 11 ND/SED, 11 ND/EX, 10 HFD/SED, 8 HFD/EX.
The mean (±SD) values for all circulating biomarkers after the diet-only period (pre-intervention) for each group are shown in Table 1. The mean chemerin concentration across all mice on the HFD prior to the exercise protocol was 22% higher than that of the ND animals, though the difference was not significant (182.1 ± 55.5 versus 148.9 ± 68.4 ng/ml, p = 0.12). Pre-intervention levels of IL-6, insulin, glucose, and HOMA-IR were also higher overall among HFD mice, compared with ND mice (p ⩽ 0.01).
Table 1.
Within and between group differences in mean (±SD) chemerin and other biomarkers before and after the exercise intervention.
| Pre-intervention |
Post-intervention |
|||
|---|---|---|---|---|
| Normal diet | High-fat diet | Normal diet | High-fat diet | |
| Chemerin (ng/ml) | ||||
| Exercise | 160.6 (80.8) | 184.9 (36.8) | 121.7 (20.0) | 274.1 (57.2)abc |
| Sedentary | 132.8 (46.7) | 179.9 (68.9) | 120.9 (27.8) | 332.3 (62.4)ac |
| Glucose (mg/dl) | ||||
| Exercise | 93.4 (11.2) | 127.5 (29.1)a | 93.7 (9.7) | 137.0 (9.5)ab |
| Sedentary | 94.0 (8.7) | 151.3 (40.5)a | 89.3 (8.6) | 115.1 (21.5)a |
| Insulin (pg/dl) | ||||
| Exercise | 203.0 (142.5) | 1123.0 (757.6)a | 183.2 (116.1) | 6514.9 (8007.0)ad |
| Sedentary | 246.5 (165.2) | 1130.4 (387.9)a | 248.7 (203.6) | 8126.7 (7342.1)ac |
| HOMA-IR | ||||
| Exercise | 1.2 (0.9) | 8.9 (5.8)a | 1.0 (0.7) | 53.9 (66.8)ad |
| Sedentary | 1.4 (0.9) | 9.1 (3.0)a | 1.7 (1.1) | 56.3 (51.4)ac |
| TNF-α (pg/dl) | ||||
| Exercise | 4.1 (2.1) | 9.0 (2.7)a | 2.1 (1.3) | 2.9 (0.8)c |
| Sedentary | 11.6 (12.2) | 6.7 (8.6) | 2.5 (1.8) | 2.7 (1.3) |
| IL-6 (pg/dl) | ||||
| Exercise | 1.5 (0.3) | 3.9 (1.8)a | 5.1 (1.0)c | 8.9 (2.8)ac |
| Sedentary | 2.0 (0.7) | 3.2 (0.6) | 4.9 (1.8)c | 11.8 (13.7)d |
| Weight (g) | ||||
| Exercise | 29.1 (2.8) | 44.6 (6.2)a | 30.4 (3.0)c | 54.6 (3.4)ac |
| Sedentary | 30.0 (2.3) | 47.0 (4.7)a | 30.7 (2.1) | 58.7 (5.1)ac |
p < 0.05 versus normal diet; bp ⩽ 0.05 versus sedentary; cp < 0.05, dp < 0.10 versus pre-intervention.
Correlations among changes in serum biomarkers
Table 2 shows the correlations among pre- to post-intervention changes in serum chemerin and changes in weight and markers of inflammation and insulin sensitivity. Changes in circulating chemerin concentrations were strongly and positively correlated with changes in weight, insulin, and HOMA-IR. Weight changes were also moderately positively correlated with changes in insulin and HOMA-IR. Chemerin changes were not significantly correlated with the changes in the inflammatory markers IL-6 and TNF-α.
Table 2.
Pearson correlations between pre- to post-intervention changes in chemerin, weight, and biomarkers of inflammation and insulin sensitivity.
| Δ weight | Δ IL-6 | Δ TNF-α | Δ insulin | Δ glucose | Δ HOMA-IR | |
|---|---|---|---|---|---|---|
| Δ chemerin | 0.67* | −0.19 | −0.24 | 0.57 | −0.38* | 0.54* |
| Δ weight | 0.39 | 0.20 | 0.44* | −0.22 | 0.38* | |
| Δ IL-6 | 0.40 | 0.19 | −0.01 | 0.19 | ||
| Δ TNF-α | 0.05 | 0.04 | 0.05 | |||
| Δ insulin | −0.18 | 0.99* | ||||
| Δ glucose | −0.09 |
p < 0.05.
Diet and exercise effects on weight
Over the course of the 12-week intervention, there were significant increases in weight among all HFD (mean ± SD: 24.6 ± 10.2%, p < 0.0001) and all ND animals (3.4 ± 3.9%, p < 0.01), though the change was significantly greater among the HFD group (p < 0.0001). Mean (±SD) weights for each group at each time point are reported in Table 1.
Diet and exercise effects on chemerin
There was a significant overall increase in chemerin across all 40 mice over the 12-week intervention (40.7 ± 77.8%, p = 0.01), and this increase was smaller in the EX mice, compared with the SED mice, though the difference was not significant (27.2 ± 83.9% versus 54.9 ± 70.5%, p = 0.29). This trend persisted after controlling for diet (p = 0.07), indicating that the effect of exercise on the change in chemerin over time did not vary significantly between the ND and HFD mice (p = 0.41). Stratified analyses by diet group, however, showed an effect of exercise only among the HFD animals (p = 0.10). There was a mean 99.8% (±57.7%) increase in chemerin from pre- to post-intervention among the HFD/SED group, compared to a mean 55.7% (±54.9%) increase among the HFD/EX group (p = 0.12; Figure 1). The change in chemerin was not significantly different between ND/EX and ND/SED mice (–1.2 ± 36.3% versus +6.5 ± 97.1%, p = 0.81).
Figure 1.
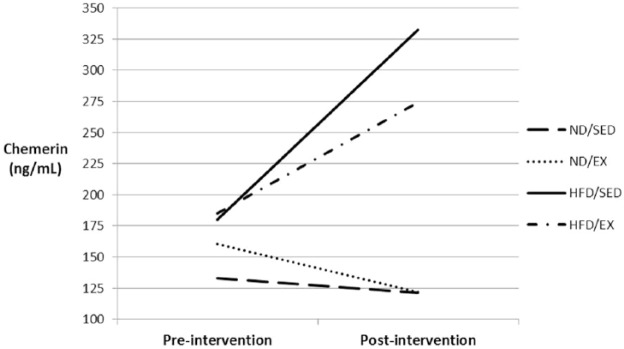
Mean chemerin concentrations before and after the 12-week exercise intervention for each of the four diet/exercise groups.
Diet and exercise effects on inflammation and insulin sensitivity
There was a significant increase in IL-6 (212.2 ± 165%) over the 12-week intervention across all animals, with no difference between the HFD and ND animals (165.1 ± 93.5% versus 245.1 ± 199.7%, p = 0.34). There was also no significant difference in the change in IL-6 between EX and SED mice, and no interaction between diet and exercise. There was a significant decrease in TNF-α across all animals over the 12-week intervention (–24.8 ± 101.5%, p < 0.01), and that change was not affected by diet and/or exercise.
From pre- to post-intervention, there was a significant effect of diet on the change in insulin (p < 0.0001) and HOMA-IR (p < 0.001). There was a mean 93.7% (±342.4%) increase in insulin among the ND group (p = 0.89) compared with a mean 773.5% (±1286.6%) increase in insulin among the HFD group (p < 0.01). HOMA-IR increased significantly across all HFD animals (846.5 ± 1723.3%, p < 0.01) compared with a much smaller and non-significant change across all ND mice (82.8 ± 321.1%, p = 0.80). There was no main effect of exercise on the change in insulin or HOMA-IR over time, and the changes in insulin and HOMA-IR in the HFD mice did not differ significantly between the HFD/SED and HFD/EX groups (insulin, p = 0.93; HOMA-IR, p = 0.90)
Despite no significant difference in the change in glucose concentrations between the ND and HFD mice (–1.1 ± 17.0% versus –6.0 ± 27.3%, p = 0.51), there was a significant difference in the glucose change between EX and SED mice (+6.6 ± 23.4% versus –12.3 ± 16.7%, p < 0.01). When considering both diet and exercise, the change in glucose varied significantly between the HFD/SED and HFD/EX groups (–20.7 ± 18.7% versus +12.5 ± 25.7%, p < 0.01) but not between the ND/SED and ND/EX mice.
Mediation of diet-induced changes in insulin sensitivity by chemerin
Linear regression models were used to determine whether the observed increases in insulin and HOMA-IR associated with the HFD could be explained by diet-induced increases in circulating chemerin concentrations. Separate unadjusted models showed a positive and significant association between the HFD and pre- to post-intervention changes in insulin, chemerin, and HOMA-IR. There was a 5556 pg/ml increase (95% confidence interval [CI] 2506–8605) in the change in insulin associated with the HFD, compared with the ND, and the HFD was associated with a 153.1 ng/ml (95% CI 104.5–201.8) greater increase in chemerin over 12 weeks. There was a large attenuation of the effect of the HFD on the change in insulin after controlling for the pre- with post-intervention change in chemerin (2292 pg/ml greater change in insulin in HFD versus ND, 95% CI −2309 to 6893). In that model, each 1.0 ng/ml increase in chemerin from pre- to post-intervention was associated with a 21.3 pg/ml increase in insulin (95% CI −0.5 to 43.2).
While there was a 40.9 point increase (95% CI 16.2–65.6) in the change in HOMA-IR associated with the HFD, compared with the ND, controlling for the change in chemerin greatly reduced the HFD effect estimate, which was no longer significant (17.2 point greater change in HOMA-IR in HFD versus ND, 95% CI −20.0 to 54.5). Each 1.0 ng/ml increase in chemerin from pre- to post-intervention was associated with a small increase in HOMA-IR (0.16; 95% CI −0.02 to 0.33). Adjusting for exercise did not change any effects of the HFD or chemerin on insulin or HOMA-IR, and there was no significant association between exercise and pre- to post-intervention changes in insulin or HOMA-IR.
Discussion
The main findings of this study are that, overall (across all mice), chemerin either increased (HFD) or remained the same (ND) from pre to post-intervention, but exercise blunted the diet-induced increase in chemerin, as the HFD/EX mice had smaller increases in chemerin than the HFD/SED mice. Though exercise did not decrease inflammatory markers or attenuate the HFD-induced increases in insulin and HOMA-IR, the regression models showed that diet-related increases in insulin and HOMA-IR were at least partially mediated by the increases in chemerin elicited by the HFD. In other words, changes in chemerin associated with the HFD explained some of the changes in insulin and HOMA-IR associated with the HFD. Though these findings do not support our hypothesis that a 12-week exercise intervention would decrease circulating chemerin levels and inflammatory biomarkers in diet-induced obese mice, they do suggest a possible causal role of chemerin in diet-related impairments in insulin sensitivity.
Our results are different from previous research which showed that chronic exercise, often coupled with other lifestyle changes, had a favorable effect on circulating chemerin levels (i.e. decreased chemerin) [Lee et al. 2013; Venojarvi et al. 2013; Stefanov et al. 2014; Kim et al. 2014; Neuparth et al. 2014]. In a recent study by Neuparth and colleagues [Neuparth et al. 2014] looking at T2DM patients, they found that subjects who maintained a regular walking regimen (⩾30 min, 3×/week) had significantly lower circulating chemerin levels (median [interquartile range] 134 [102–181] ng/ml), compared with their age-matched sedentary counterparts (181 [156–199] ng/ml; p < 0.001). Similar results were observed in a study by Kim and colleagues [Kim et al. 2014] where they randomized patients with T2DM to either ‘usual care’ (i.e. no intervention) or a 12-week lifestyle modification program consisting of aerobic and resistance training, as well as dietary counseling. They found that the 12-week intervention had a significant effect on circulating chemerin levels. Whereas there was an 8.2 (±15.9) ng/ml increase in circulating chemerin among the usual care group, there was an 8.1 (±21.6) ng/ml decrease in chemerin after 12 weeks of the lifestyle intervention (p = 0.02 for difference between groups). The results of our study, however, suggest that chronic exercise alone may not be sufficient stimuli to significantly decrease chemerin levels in the case of diet-induced obesity. This could be due to the obesogenic and pro-inflammatory diet ingested by the HFD mice and the continued weight gain experienced by all animals in the HFD feeding group (EX and SED). Some previous controlled studies, without including groups that received only the diet or exercise interventions exclusively, could not tease out the effects of either component on circulating chemerin concentrations, and others did not attempt to isolate the effects of one type of exercise over another (e.g. aerobic versus resistance training). The results of our study also suggest that, in the absence of excess adipose tissue (i.e. obesity), chemerin concentrations may not be elevated enough to be affected by regular exercise, which may explain why we saw little to no change in chemerin among the animals on the ND, regardless of the exercise intervention.
Though we did not observe a significant independent effect of exercise on circulating chemerin levels, the exercise intervention did attenuate the increase in chemerin concentrations generally observed among the animals on the high-fat diet. The increase in circulating chemerin from pre- to post-intervention among mice in the HFD/EX group was about 44% lower than the increase among the HFD/SED group, though the difference did not reach statistical significance (p = 0.12). However, this finding does provide some support for the idea that, in the absence of dietary modifications, regular exercise may mitigate some of the metabolic damage of an unhealthy diet.
Similar to some of the recent studies among overweight and obese adults, we observed positive correlations between pre- and post-intervention changes in circulating chemerin and changes in insulin concentrations (r = 0.57) and insulin resistance, as measured by HOMA-IR (r = 0.54) in our mouse model of diet-induced obesity. Lee and colleagues found smaller positive correlations between changes in chemerin and changes in insulin (r=0.29) and HOMA-IR (r=0.28) following an 8-week diet and exercise prescription among obese adults [Lee et al. 2013], while Stefanov and colleagues observed a positive correlation between changes in chemerin and HOMA-IR (r = 0.33) after 6 months of aerobic and resistance training [Stefanov et al. 2014]. Kim and colleagues found each 1 ng/ml decrease in chemerin to be associated with a 0.42 decrease in the insulin sensitivity index (ISI), indicating a favorable effect of lower chemerin on insulin sensitivity [Kim et al. 2014]. Our most notable finding, however, is that the HFD-induced increases in insulin and HOMA-IR, indicating a worsening of insulin resistance, was mediated by the changes in chemerin associated with the HFD, a relationship that has not been previously examined. Here, we showed ~60% reductions in the increases in both insulin and HOMA-IR associated with the HFD after accounting for changes in chemerin. This is the first study to suggest a role of chemerin in the causal pathway between an obesogenic diet and insulin resistance.
To the best of the authors’ knowledge, this is also the first study to examine the effects of a chronic exercise intervention on circulating chemerin levels, independent of other factors known to affect chemerin concentrations, namely changes in weight and dietary intake. In other studies of this kind where an exercise intervention was used to observe effects on chemerin, exercise was often accompanied by other ‘lifestyle modifications’ such as a dietary intervention [Lee et al. 2013; Venojarvi et al. 2013; Stefanov et al. 2014; Kim et al. 2014; Neuparth et al. 2014] as well as weight loss, which have both been shown to have favorable effects on circulating chemerin levels, irrespective of exercise [Bluher et al. 2012; Sell et al. 2010; Terra et al. 2013]. A main advantage of using an animal model to examine the effects of exercise is the ability to more strictly control for potential confounding variables, namely dietary intake, compared with human trials. It may not be ethical to prescribe or encourage the maintenance of a high-fat diet in human subjects when it is known that the continuation of this diet could exacerbate metabolic impairments. Yet in an animal model, where there is more control over dietary intake, a true assessment of the independent effects of diet and exercise can be ascertained. In addition, the attenuation by exercise of the HFD-induced increases in chemerin were not accompanied by lower weight gain in the HFD/EX group, compared with the HFD/SED group, and so those results cannot be attributable to the effects of exercise on weight.
This study does have some limitations that should be considered when interpreting the results. First, some of the HFD animals resisted the exercise and needed coaxing to run on the treadmill during each exercise bout, and so the HFD/EX and HFD/SED groups may not have engaged in the same volume of exercise as the SED groups throughout the 12-week intervention. Second, this particular strain of mouse is known to have a propensity to gain weight, and the effect of this genetic predisposition on chemerin levels is unknown. Third, we did not include a measure of body composition in our study protocol. Comparisons of fat pad and/or muscle weight between groups may have allowed us to further elucidate the physiological changes that are associated with changes in chemerin, inflammation, and insulin sensitivity. Finally, because mice are nocturnal by nature, our protocol dictated that they sometimes be woken up to perform exercise, which could have disrupted natural hormonal patterns, which may also have unknown effects on chemerin levels.
In conclusion, a chronic exercise regimen in diet-induced obese mice may attenuate the diet-driven increase in chemerin levels. These results raise the question of whether diet plays a greater role than exercise in modifying circulating chemerin concentrations. Further research, such as a similar study including a third HFD group that is switched to a ND in lieu of exercise, may shed more light on this matter. Additional research into the role of chemerin in mediating diet-related insulin resistance and inflammatory pathways is also warranted.
Footnotes
Funding: The author(s) disclosed receipt of the following financial support for the research, authorship, and/or publication of this article: This study was funded by Syracuse University and the Joan L. Bernstein School of Education Graduate Student Creative Writing grant (JL).
Declaration of Conflicting Interests: The author(s) declared no potential conflicts of interest with respect to the research, authorship, and/or publication of this article.
Contributor Information
Jesse W. Lloyd, Department of Exercise Science, Syracuse University, 820 Comstock Avenue, Women’s Building Room 201 Syracuse, NY 13244, USA.
Kristy M. Zerfass, Department of Exercise Science, Syracuse University, Syracuse, NY 13244, USA
Ebony M. Heckstall, Department of Exercise Science, Syracuse University, Syracuse, NY 13244, USA
Kristin A. Evans, Department of Public Health Sciences, University of Rochester School of Medicine and Dentistry, Rochester, NY, 14642 USA
References
- Bluher M., Rudich A., Kloting N., Golan R., Henkin Y., Rubin E., et al. (2012) Two patterns of adipokine and other biomarker dynamics in a long-term weight loss intervention. Diabetes Care 35: 342–349. [DOI] [PMC free article] [PubMed] [Google Scholar]
- Bouchard C. (1991) Current understanding of the etiology of obesity: genetic and non-genetic factors. Am J Clin Nutr 53: 1561S–1565S. [DOI] [PubMed] [Google Scholar]
- Bozaoglu K., Bolton K., McMillian J., Zimmet P., Jowett J., Collier G., et al. (2007) Chemerin is a novel adipokine associated with the obesity and metabolic syndrome. Endocrinology 148: 4687–4694. [DOI] [PubMed] [Google Scholar]
- Bozaoglu K., Segal D., Shields K., Cummings N., Curran J., Comuzzie A., et al. (2009) Chemerin is associated with metabolic syndrome phenotypes in a Mexican–American population. J Clin Endocrinol Metab. 94: 3085–3088. [DOI] [PMC free article] [PubMed] [Google Scholar]
- Cai D., Yuan M., Frantz D., Melendez P., Hansen L., Lee J., et al. (2005) Local and systemic insulin resistance resulting from hepatic activation of IKK-beta and NF-kappaB. Nat Med 11: 183–190. [DOI] [PMC free article] [PubMed] [Google Scholar]
- Centers for Disease Control and Prevention (CDC) (2014) Heart disease, http://www.cdc.gov/nchs/fastats/heart-disease.htm (accessed 23 December 2014).
- Chae H., Kwon Y., Rhie J., Kim H., Kim Y., Paik I., et al. (2010) Effects of a structured exercise program on insulin resistance, inflammatory markers and physical fitness in obese Korean children. J Pediatr Endocrinol Metab 10: 1065–1072. [DOI] [PubMed] [Google Scholar]
- Dey D., Bhattacharya A., Roy S., Bhattacharya S. (2007) Fatty acid represses insulin receptor gene expression by impairing HMGA1 through protein kinase Cepsilon. Biochem Biophys Res Commun 357: 474–479. [DOI] [PubMed] [Google Scholar]
- Ernst M., Issa M., Goralski K., Sinal C. (2010) Chemerin exacerbates glucose intolerance in mouse models of obesity and diabetes. Endocrinology 154:1998–2007. [DOI] [PubMed] [Google Scholar]
- Goralski K., McCarthy T., Hannimann E., Zable B., Butcher E., Parlee S., et al. (2007) Chemerin: A novel sadipokine that regulates adipogenesis and adipocyte metabolism. J Biol Chem 282: 28175–28188. [DOI] [PubMed] [Google Scholar]
- Grundy S., Benjamin I., Burke G., Chait A., Eckel R., Howard B., et al. (1999) Diabetes and Cardiovascular Disease: A statement for healthcare professionals from the American Heart Association. Circulation 100: 1134–1146. [DOI] [PubMed] [Google Scholar]
- Hellström L., Blaak E., Hagström-Toft E. (1996) Gender differences in adremergic regulation of lipid mobilization during exercise. Int J Sports Med 17: 439–447. [DOI] [PubMed] [Google Scholar]
- Hotamisligil G. (2003) Inflammatory pathways and insulin action. Int J Obes Relat Metab Disord 27: 53–55. [DOI] [PubMed] [Google Scholar]
- Kim S., Lee S., Ahn K., Lee D., Suh Y., Cho S., et al. (2014) Effect of lifestyle modification on serum chemerin concentrations and its association with insulin sensitivity in overweight and obese adults with type 2 diabetes. Clin Endocrinol 80: 825–833. [DOI] [PubMed] [Google Scholar]
- Kralisch S., Weise S., Sommer G., Lipfert J., Lossner U., Bluher M., et al. (2009) Interleukin-1beta induces the novel adipokine chemerin in adipocytes in vitro. Regul Pept 154: 102–106. [DOI] [PubMed] [Google Scholar]
- Lee M., Chu S., Lee D., An K., Park J., Kim D., et al. (2013) The association between chemerin and homeostasis assessment of insulin resistance at baseline and after weight reduction via lifestyle modifications in young obese adults. Clinica Chimica Acta 421: 109–115. [DOI] [PubMed] [Google Scholar]
- Lehrke M., Becker A., Greif M., Stark R., Laubender R., von Ziegler F., et al. (2009) Chemerin is associated with markers of inflammation and components of the metabolic syndrome but does not predict coronary heart atherosclerosis. Eur J Endocriniol 161:339–344. [DOI] [PubMed] [Google Scholar]
- Menoutis J. (2008) Physical activity and health. Nasm Pro. [Google Scholar]
- Neuparth M., Proenca J., Santos-Silva A., Colmbra S. (2014) Positive effect of moderate walking exercise on chemerin levels in Portuguese patients with type 2 diabetes mellitus. J Investig Med 62: 350–353. [DOI] [PubMed] [Google Scholar]
- Sell H., Laurencikiene J., Taube A., Eckardt K., Cramer A., Horrighs A., et al. (2009) Chemerin is a novel adipokine-derived factor inducing insulin resistance in primary human skeletal muscle cells. Diabetes 58: 2731–2740. [DOI] [PMC free article] [PubMed] [Google Scholar]
- Sell H., Divoux A., Poitou C., Basdevant A., Bouillot P., Tordjman J., et al. (2010) Chemerin correlates with markers for fatty liver in morbidly obese patients and strongly decreases after weight loss induced by bariatric surgery. J Clin Endocrinol Metab 95: 2892–2896. [DOI] [PubMed] [Google Scholar]
- Shi H., Kokoeva M., Inouye K., Tzameli I., Yin H., Flier J. (2006) TLR4 links innate immunity and fatty acid-induced insulin resistance. J Clin Invest 116: 3015–3025. [DOI] [PMC free article] [PubMed] [Google Scholar]
- Shoelson S., Lee J., Goldfine A. (2006) Inflammation and insulin resistance. J Clin Invest 116: 1793–1801. [DOI] [PMC free article] [PubMed] [Google Scholar]
- Shoelson S., Lee J., Yuan M. (2003) Inflammation and the IKK beta/I kappa B/NF-kappa B axis in obesity- and diet-induced insulin resistance. Int J Obes Relat Metab Disord 27: 49–52. [DOI] [PubMed] [Google Scholar]
- Stefanov T., Bluher M., Vekova A., Bonova I., Tzvetkov S., Kurkischiev D., et al. (2014) Circulating chemerin decreases in response to a combined strength and endurance training. Endocrine 45: 382–391. [DOI] [PubMed] [Google Scholar]
- Takahashi M., Takahashi Y., Takahashi K., Zolotaryov F., Hong K., Kitazawa R., et al. (2008) Chemerin enhances insulin signaling and potentiates insulin-stimulated glucose uptake in 3T3-L1 adipocytes. FEBS Lett 582: 573–578. [DOI] [PubMed] [Google Scholar]
- Terra X., Auguet T., Guiu-Jurado E., Berlanga A., Orellana-Gavalda J., Hernandez M., et al. (2013) Long-term changes in leptin, chemerin and ghrelin levels following different bariatric surgery procedures: Roux-en-Y gastric bypass and sleeve gastrectomy. Obes Surg 23: 1790–1798 [DOI] [PubMed] [Google Scholar]
- Venojarvi M., Wasenius N., Manderoos S., Heinonen O., Hernelahti M., Lindholm H., et al. (2013) Nordic walking decreased circulating chemerin and leptin concentrations in middle-aged men with impaired glucose regulation. Ann Med 45: 162–170. [DOI] [PubMed] [Google Scholar]
- Weigert J., Neumeier M., Wanninger J., Filarsky M., Bauer S., Wiest R., et al. (2010) Systemic chemerin is related to inflammation rather than obesity in type 2 diabetes. Clin Endocrinol 72: 342–348. [DOI] [PubMed] [Google Scholar]
- World Health Organization (WHO) (2014) Diabetes. http://www.who.int/mediacentre/factsheets/fs312/en/. Accessed December 23, 2014.