

Abstract
Because microorganisms have different abilities to utilize nitrogen (N) through various assimilatory and dissimilatory pathways, microbial composition and diversity likely influence N cycling in an ecosystem. Terrestrial plant litter decomposition is often limited by N availability; however, little is known about the microorganisms involved in litter N cycling. In this study, we used metagenomics to characterize the potential N utilization of microbial communities in grassland plant litter. The frequencies of sequences associated with eight N cycling pathways differed by several orders of magnitude. Within a pathway, the distributions of these sequences among bacterial orders differed greatly. Many orders within the Actinobacteria and Proteobacteria appeared to be N cycling generalists, carrying genes from most (five or six) of the pathways. In contrast, orders from the Bacteroidetes were more specialized and carried genes for fewer (two or three) pathways. We also investigated how the abundance and composition of microbial N cycling genes differed over time and in response to two global change manipulations (drought and N addition). For many pathways, the abundance and composition of N cycling taxa differed over time, apparently reflecting precipitation patterns. In contrast to temporal variability, simulated global change had minor effects on N cycling potential. Overall, this study provides a blueprint for the genetic potential of N cycle processes in plant litter and a baseline for comparisons to other ecosystems.
INTRODUCTION
Microorganisms play a key role in the decomposition of terrestrial plant litter (1–3), a process that controls the balance of plant carbon (C) released into the atmosphere as CO2 with that stored in the soil. Less often considered is the role that litter microorganisms play in nitrogen (N) cycling. The N available to microorganisms degrading plant litter comes from several sources. One source is organic N bound in plant tissues and microorganisms. Because the average C/N ratio is much higher in plant litter than in microbial decomposers, N availability is thought to limit litter decomposition (4–6). Fungal hyphae can further translocate N from the soil into plant litter (7). And in some ecosystems, atmospheric deposition of inorganic N from human-driven nitrogen oxide (NOx) emissions can also be an important source (8–11).
Microbes can rapidly alter the forms of N in plant litter through a variety of different N cycle pathways, and these changes in N availability can feed back to influence overall ecosystem functioning (12, 13). During decomposition, bacteria utilize N in both assimilatory and dissimilatory pathways. Assimilatory pathways require energy and lead to the conversion of inorganic N to organic N in microbes (e.g., utilizing N for protein, nucleic acid, and cellular component assembly). Dissimilatory pathways use N compounds to provide energy to microbes. Thus, the pathways by which microbes use N affect the fate of N in the ecosystem, specifically whether it is converted into microbial biomass or whether it is converted to new forms and released into the environment. For example, through the ammonia assimilation pathway, organic N in plant litter may be used by microorganisms for growth (14). Through the denitrification pathway, N may be removed from the plant litter-soil system and lost to the atmosphere as N2O or N2 (15).
Environmental conditions also influence plant litter decomposition and therefore N cycling (2, 16–18). In particular, moisture availability is known to be important to plant litter decomposition rates (19, 20). Climate models predict decreased precipitation in the southwestern United States in the next century (21), a change that may also alter decomposition indirectly via changes in plant composition and litter quality in grasslands ecosystems (22, 23). In addition, N availability also plays a role in plant litter decomposition (17, 24). N loading from anthropogenic sources (estimated at 20 to 45 kg ha−1 year−1 in Southern California) is expected to continue to increase (25) and to affect plant communities and ecosystem functioning (26–28).
To investigate the effects of such changes on grasslands, an experiment manipulating nitrogen and precipitation was established in 2007 at Loma Ridge in Irvine, CA (23, 29). Previous work indicates that both drought and added N, as well as seasonal and annual climate variations, affect the microbial composition of litter (30, 31). Moreover, these shifts in microbial composition have functional consequences (32). A reciprocal transplant experiment demonstrated that microbial communities altered by drought had lower rates of plant litter decomposition even under ambient environmental conditions (22). Further, taxonomic changes in the litter community were correlated with changes in the frequency of glycoside hydrolases, genes responsible for C utilization (31).
Given the intertwined nature of N and C cycling during litter decomposition, we investigated the genetic potential of N utilization in plant litter microbial communities. We analyzed metagenomic samples to identify genes for N cycling in microbial communities from the Loma Ridge experimental plots. We focused our work on prokaryotes, because they are the most abundant organisms on the litter (33), but we also quantified sequences associated with Fungi. Although metagenomic sequences indicate only the functional potential of a community, they provide a holistic description of potential N utilization across many pathways in the N cycle. Specifically, we asked the following questions. (i) How do the abundance, taxonomic composition, and diversity of N cycling genes differ among pathways? (ii) Within a pathway, do these patterns differ over time? (iii) Does N cycling potential respond to global change manipulations (drought and N addition)?
MATERIALS AND METHODS
Field experiment and DNA sequencing.
The Loma Ridge global change experiment, Irvine, CA (33°44′N, 117°42′E; elevation, 365 m), was established in 2007 with precipitation and N manipulations (22, 31). The precipitation manipulation reduced the amount of water by 50%, creating drought plots. Surface soil moisture was significantly lower in drought plots than in ambient treatment plots (30). The nitrogen addition plots received 60 kg CaNO3 ha−1 year−1. Previous studies at the site have shown that litter from nitrogen addition plots contained significantly more nitrogen and lower concentrations of carbon substrates, such as cellulose, hemicellulose, and lignin, than control plots (22). Furthermore, the level of plant-available nitrogen in soil was significantly lower in drought plots than in control or nitrogen addition plots (23). Drought treatment reduced, and nitrogen addition increased, decomposition rates, as measured by mass loss, over those in control plots (22).
The climate in this Southern California grassland ecosystem is semiarid, with mean annual precipitation of 325 mm, most of which occurs between October and April. Beginning in 2010, plant litter samples were taken seasonally for 2 years in control, drought, and N addition plots. Sampling dates were 14 April, 20 August, and 17 December 2010; 29 February, 10 June, 21 September, and 14 December 2011; and 12 March 2012.
For each of the three treatments (ambient, drought, and N addition), eight plots were sampled at 8 time points (for a total of 192 samples). To balance replication with sequencing costs, we pooled equal concentrations of DNA extracts from four plots undergoing the same treatment; extracts from the same plots were pooled on all dates (31). Thus, six metagenomic libraries (two replicate libraries per treatment) were sequenced at 8 time points, for a total of 48 libraries. Although two replicates per treatment is not ideal and limits our statistical power to test for treatment effects, pooling four independent plots into two composite “replicates” provides improved mean estimates (such as the mean abundance of a particular gene) over those obtained by sampling only two plots (34). Further, sampling over 8 time points also gives us additional statistical power to test for treatment effects by reducing the error variance (35).
Metagenomic libraries were prepared using a TruSeq library kit (part 15026484, revision C, July 2012; Illumina), were sequenced with an Illumina HiSeq 2000 system (100-bp paired ends), and yielded 107.4 Gbp (which passed quality control [QC]) (31). In total, 46 libraries were analyzed, of which 2 libraries were excluded due to low sequence counts (April 2010, reduced precipitation [MG-RAST accession no. 4511045]; August 2010, increased N deposition [MG-RAST accession no. 4511064] [see Table S1 in the supplemental material]). Sequences were uploaded onto the MG-RAST server, where 53% of the sequences were annotated (31).
Taxonomic assignment for the metagenomic libraries was performed by MG-RAST (36) using the KEGG database (37), and annotations were downloaded using the MG-RAST API, version 3.2 (36). Taxonomic annotation was considered for sequences with an E value of ≤10−5 (31). Each sequence was assigned to the closest related species in the database; however, in order to be conservative in our taxonomic assignment, we report bacterial taxonomy at the corresponding order level.
N cycle pathway identification.
Eight N cycling pathways were defined for this analysis: nitrification (number of genes targeted [n], 2), N fixation (n = 20), denitrification (n = 20), dissimilatory nitrate reduction to nitrite [DNRA(NO3− → NO2−)] (n = 9), dissimilatory nitrite reduction to ammonia [DNRA(NO2− → NH3)] (n = 4), assimilatory nitrate reduction to nitrite [ANR(NO3− → NO2−)] (n = 2), assimilatory nitrite reduction to ammonia [ANR(NO2− → NH3)] (n = 2), and ammonia assimilation (n = 10) (Fig. 1; see also Table S2 in the supplemental material). Although nitrification includes both ammonia oxidation and nitrite oxidation, we combined them here because of their low level of representation in the samples. Finally, we excluded the anammox pathway from our analyses. The functional genes for this pathway are poorly represented in genome databases (and currently are not defined in the KEGG or SEED database). After some analysis, we were not confident in our ability to distinguish between genes in the annamox pathway and related non-annamox genes.
FIG 1.
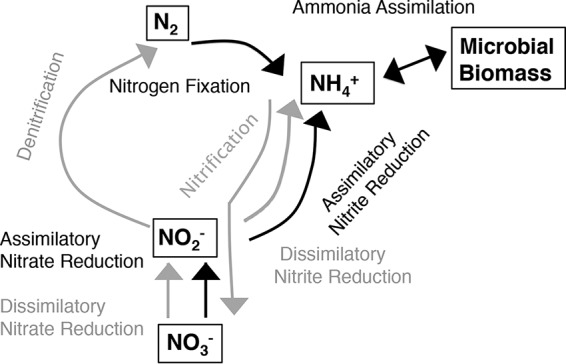
Nitrogen cycling pathways considered in this study. Pathways in gray are categorized as dissimilatory, and pathways in black are categorized as assimilatory.
To detect genes in the eight pathways, we first identified the corresponding genes in the KEGG (37) and SEED (38) databases. For the KEGG database, KEGG Orthology (KO) numbers (37) were obtained from the Functional Ontology Assignments for Metagenomes (FOAM) database (39). For the SEED database, FIGfam numbers were obtained for the N fixation and denitrification pathways. Next, MD5 identifiers (IDs) for each KO and FIGfam number sequence were retrieved from the nonredundant M5nr database (40). Finally, we searched for the MD5 IDs in our samples annotated by the MG-RAST server. For each pathway, we checked the functional assignments of a subset of sequences using the BLAST algorithm against the MicrobesOnline database. This allowed us to compare the annotations and genome contexts of those hits in fully sequenced genomes (41).
Data standardization and statistical analyses.
We first compared the relative abundances of prokaryotic and fungal reads across the different N cycle pathways. To do this, we first took the average number of sequences associated with each pathway across all 46 samples and then divided it by the number of different genes searched in the pathway. While we recognize that it is common to standardize by gene length as well (see, e.g., reference 42), the variation in copy number and gene length for all 80 genes across a wide range of microbial taxa makes this infeasible. Conveniently, our results show that the average abundances of microbial taxa differ between most pathways by orders of magnitude, while gene lengths usually differ to a lesser degree. This suggests that the relative differences observed would likely persist even with such standardization.
All statistical analyses were performed using the “nlme” and “vegan” packages in the R software environment (43, 44). To test for differences in the abundances of bacterial communities across treatments and sampling dates, we used one-way repeated-measures analysis of variance (ANOVA) with “plot” included as an error term. For this analysis, we standardized the number of reads associated with each pathway by the total number of annotated bacterial reads in that library. We standardized fungal read abundances for each sample by the total fungal reads in each library.
The taxonomic diversity of the genes associated with each pathway was quantified using the Shannon evenness index and the observed richness of the number of orders. To test whether evenness changed over time, we performed one-way repeated-measures ANOVA as described above.
To assess the effects of treatment and time on bacterial community composition, we performed a permutational multivariate analysis of variance (PERMANOVA) (45) including treatment and sampling date as fixed effects (45, 46). Taxa were first standardized by their relative frequencies within each pathway; then the analysis was run for each pathway. The analyses were run using partial sums of squares on 999 permutations of residuals under a reduced model. If the model returned nonsignificant variables, the variables were removed, and the model was tested again. This procedure does not alter the significance of the remaining variables but reduces the effect of spurious relationships between variables (47). To identify the taxa contributing to significant compositional differences, we used similarity percentage (SIMPER) analysis (48). Specifically, we tested which taxa accounted for differences between the samples from rainy (winter/spring) and dry (summer/fall) seasons. Lastly, Pearson's correlations were used to test whether the number of sequences attributed to an N cycling pathway was distributed among bacterial orders in proportion to the total abundances of those orders in the metagenomes.
Extracellular enzyme activity.
To assay the functional potential of the litter microbial community, we measured the potential activities of nine extracellular enzymes—α-glucosidase (AG), acid phosphatase (AP), β-glucosidase (BG), β-xylosidase (BX), cellobiohydrolase (CBH), leucine aminopeptidase (LAP), N-acetyl-β-d-glucosaminidase (NAG), polyphenol oxidase (PPO), and peroxidase (PER)—on litter from all treatments on seven sample dates between September 2011 and March 2013. Fluorimetric and oxidative enzyme assays were conducted as described in reference 33, and the initial results from these analyses are reported in references 2 and 30. For this study, we used the same data to calculate the ratio of N-acquiring enzymes to C-acquiring enzymes (NAG/Cenz ratio) (49). The ratio of these two metrics has been proposed for the estimation of relative allocation to nutrient acquisition versus energy (49, 50). The extracellular enzyme NAG measures potential chitinase activity, a proxy for the conversion of organic N to ammonium for assimilation. Cenz is defined as the sum of four extracellular enzymes involved in C cycling (AG, BG, CBH, BX). We used a repeated-measures ANOVA to test for differences in NAG/Cenz ratios across all treatments and enzyme sampling dates.
To test for correlations between potential enzyme activities and genomic potential, we examined data from three sampling dates when both types of data were collected (September 2011, December 2011, March 2012). Specifically, we tested whether the NAG/Cenz ratio could be predicted by the ratio of the abundance of assimilatory N cycling genes to that of dissimilatory N cycling genes (A/D ratio), as a genomic index for the allocation of nutrient acquisition versus energy. We used analysis of covariance (ANCOVA) with NAG/Cenz activity as the independent variable, the A/D ratio as the dependent variable, and time as a covariate. (We excluded treatment as a covariate, because treatment did not significantly affect the NAG/Cenz ratio in the test described above.)
RESULTS
Across all the plant litter metagenomic libraries, 59% of the annotated sequences were bacterial (294,674,419 reads). Of the annotated sequences, 0.31% were associated with an N cycling pathway, and of these, 896,943, 197,944, and 3,278 were assigned to Bacteria, Fungi, and Archaea, respectively. The vast majority of these sequences were associated with ammonia assimilation (84%, 75%, and 98%, from Bacteria, Fungi, and Archaea, respectively). All N cycling fungal sequences were associated with two phyla, Ascomycota (94.5%) and Basidiomycota (5.5%).
Abundance.
The total abundances of prokaryotic reads related to different N cycling pathways differed by several orders of magnitude (Fig. 2). Broadly, assimilatory pathways were much more prevalent (96.5%) than dissimilatory pathways (3.5%). After ammonia assimilation, ANR(NO3− → NH3) and DNRA(NO3− → NO2−) were the next most frequently detected pathways, while the nitrification pathway was the least frequently detected (Table 1). All fungal N cycling sequences were associated with assimilatory pathways (Fig. 2).
FIG 2.

Log abundances of prokaryotic and fungal reads for each N cycle pathway. Abundance was calculated as the average across all samples (n = 46), standardized by the number of genes targeted in the pathway (see Table S2 in the supplemental material).
TABLE 1.
Effects of treatment, sample date, and their interaction on the abundance of sequences from each N cycle pathway for prokaryotes and Fungi
| N cycle pathway | Significance (P value)a of effect of: |
Total no. of sequences detected | ||
|---|---|---|---|---|
| Treatment | Timeb | Interaction of treatment and time | ||
| Prokaryotes | ||||
| Dissimilatory nitrate to nitrite | NS | <0.0001 | 0.07 | 35,920 |
| Dissimilatory nitrite to ammonia | NS | NS | NS | 130 |
| Denitrification | NS | <0.01 | NS | 1,846 |
| Nitrification | — | — | — | 17 |
| Assimilatory nitrate to nitrite | NS | NS | NS | 2,009 |
| Assimilatory nitrite to ammonia | NS | <0.0001 | NS | 102,360 |
| Ammonia assimilation | NS | <0.0001 | 0.05 | 757,470 |
| Nitrogen fixation | NS | <0.01 | 0.02 | 413 |
| Fungi | ||||
| Assimilatory nitrite to ammonia | NS | <0.01 | 0.05 | 32,172 |
| Assimilatory nitrate to nitrite | NS | NS | 0.06 | 17,169 |
| Ammonia assimilation | NS | NS | NS | 148,602 |
Based on repeated-measures ANOVA. NS, not significant; —, not tested.
Sample date.
The frequency of prokaryotic genes in each pathway differed significantly over time for 5 of the 8 pathways: the ammonia assimilation, ANR(NO2− → NH3), DNRA(NO3− → NO2−), N fixation, and denitrification pathways (by repeated-measures ANOVA) (Table 1; Fig. 3a). Gene abundances in these pathways tended to covary over time and were lowest in August 2010 and June 2011. This pattern correlated with cumulative precipitation at the site in the 2 weeks prior to sampling (Fig. 3b). The only fungal pathway in which the frequency of genes differed significantly over time was that associated with ANR(NO2− → NH3). In contrast to prokaryotic sequences from this pathway, the frequency of fungal sequences was highest in August 2010 and June 2011 (Fig. 3a).
FIG 3.

(a) Average frequencies of sequences by sample date for those pathways in which they differed significantly over time, including the denitrification, nitrogen fixation, dissimilatory nitrate reduction to nitrite, bacterial assimilatory nitrite reduction to ammonia, fungal assimilatory nitrite reduction to ammonia, and bacterial ammonia assimilation pathways. Error bars, ±1 standard error. (b) Cumulative precipitation (in millimeters) in the 2 weeks prior to sampling, shown by sampling date.
Composition.
The distribution of N cycling potential among prokaryotic taxa differed distinctly by pathway (Fig. 4). Genes involved in ammonia assimilation were generally detected in proportion to their abundances in each bacterial order (R2 = 0.877; P < 0.0001), as were genes involved in ANR(NO2− → NH3) and DNRA (NO3− → NO2−) (R2, 0.714 and 0.657; P < 0.0001). ANR(NO3− → NO2−) was the most taxonomically restricted pathway. Even though genes for this process were relatively abundant in the metagenomic libraries (Fig. 2), they were detected for only five bacterial orders and thus were not well correlated with the total abundance in each order (R2 = 0.459; P < 0.0001). Finally, genes for DNRA(NO2−→ NH3), were rare among abundant orders but common among some rare orders and hence were poorly correlated with overall abundance (R2 = 0.084; P > 0.05) (Fig. 4).
FIG 4.

Bacterial and archaeal composition at the order level by N pathway. Data are combined across all sampling dates. A coarse phylogeny is shown on the left to highlight the major phyla (Interactive Tree of Life [iToL]) (94). (a) The orange heat map represents the relative distribution of sequence reads by order for each pathway. (b) For comparison, the blue heat map shows the relative abundances of all bacterial and archaeal sequences (all predicted proteins and rRNA genes) by order. (Relative abundance was calculated with all bacterial/archaeal taxa; however, only orders with predicted N cycle reads [101/130] are included in this figure.)
In an intermediate case, denitrification genes were common among many abundant bacterial orders (e.g., Rhizobiales, Burkholderiales, and Actinomycetales) but were also found in other, less abundant orders, including orders of Archaea (Halobacteriales, Methanosarcinales, and Cenarchaeales) and known ammonia oxidizers (Nitrosomonadales and Nitrosopumilales) (R2 = 0.539; P < 0.0001) (Fig. 4). This was also true for N fixation (R2 = 0.497; P < 0.0001), which was common in some the most abundant taxa (e.g., Rhizobiales and Burkholderiales) but absent in the most abundant order (Actinomycetales).
Distinct bacterial taxa appeared to have different N cycling potentials in these plant litter communities (Fig. 4). The most abundant taxa (e.g., Actinomycetales, Rhizobiales, Burkholderiales, and Sphingomonadales) appeared to be N cycling generalists in that they carried genes from most (five to six) of the seven pathways. Other taxa seemed to be more specialized. Notably, the orders from the phylum Bacteroidetes (Bacteroidales, Cytophagales, Flavobacteriales, and Sphingobacteriales) carried genes for only a couple of pathways (two to three), even though the taxa were relatively abundant (Fig. 4).
Beyond these average trends, the composition of potential N cycling litter prokaryotes differed among litter samples. Much of this variation could be attributed to temporal variability (see Fig. S1 in the supplemental material). In 5 of the 8 pathways examined, time explained 12% to 45% of the compositional variation among samples (Fig. 5; see also Table S3 in the supplemental material). These trends were driven largely by seasonal differences in a few abundant bacterial orders. For instance, across all N pathways, the relative abundances of Burkholderiales and Sphingomonadales were higher, and that of Enterobacteriales was lower, in the rainy (winter/spring) than in the dry (summer/fall) seasons (by SIMPER analysis; see Table S4 in the supplemental material). However, the seasonal abundances of at least two orders, Actinomycetales and Rhizobiales, depended on the N pathway examined. For example, for Actinomycetales, ANR(NO2− → NH3) genes were relatively abundant in winter/spring, but Actinomycetales ANR(NO3− → NO2−), DNRA(NO3− → NO2−), and ammonia assimilation genes were higher in summer/fall (see Table S4).
FIG 5.
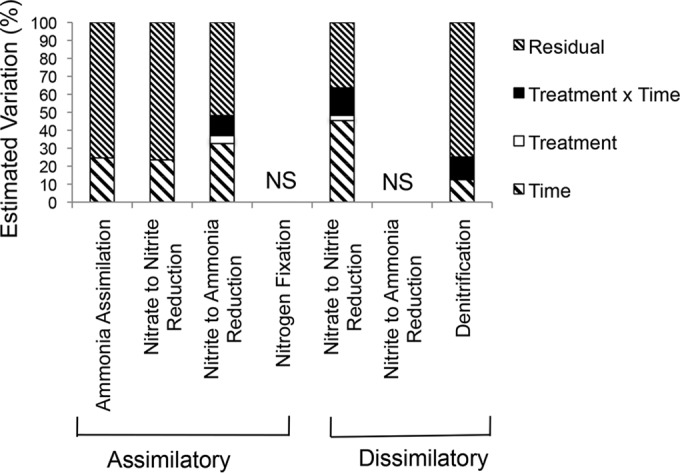
Percentages of the estimated variation in prokaryotic community composition explained by time, treatment, and their interaction for each N cycle pathway. Estimates were derived from PERMANOVA models, where NS means the test result was not significant (P, ≥0.1).
In contrast to time, treatment (drought or N addition) had minor effects on the composition of N cycling prokaryotes, explaining only a small percentage of variation in the DNRA(NO3− → NO2−) (2.9%) and ANR(NO2− → NH3) (4.4%) pathways (Fig. 5). This result was similar to that for analyses of community composition using 16S rRNA, where treatment explained ∼3% of estimated variation (30). Treatment also interacted with sampling date to account for 11% to 15% of compositional variation in the denitrification, DNRA(NO3− → NO2−), and ANR(NO2− → NH3) pathways (Fig. 5). For instance, N addition altered the composition of bacterial orders carrying ANR(NO2− → NH3) pathway genes during the dry season, but not during the rainy season (see Fig. S1 in the supplemental material).
Diversity.
Prokaryotic evenness at the order level was relatively constant over time for all pathways examined (Fig. 6). The richness and evenness of prokaryotic orders associated with each N pathway were highly correlated; pathways encoded by a higher number of orders also tended to be more evenly distributed across those orders. Generally, evenness was low for the communities with the potential for N fixation, ANR(NO3− → NO2), and DNRA(NO2− → NH3) (Fig. 6). In the case of N fixation and DNRA(NO2− → NH3), this reduced diversity may be due to undersampling, since the total number of sequences detected was in the hundreds (Table 1). As mentioned above, however, only five bacterial orders appeared to carry genes for ANR(NO3− → NO2−), even though thousands of sequences were sampled. Most (81%) of these genes were attributed to one order, the Actinomycetales.
FIG 6.
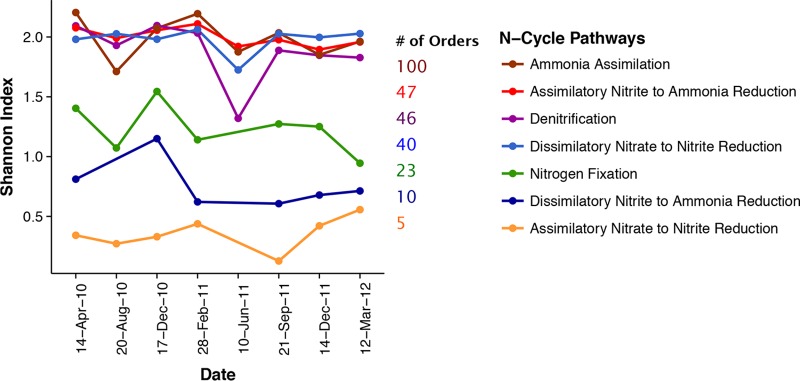
Diversity of orders (calculated by the Shannon index) for each N cycling pathway by collection date. The total number of orders for each pathway is also noted.
Extracellular enzymes.
Like the abundances of N cycling genes, the potential activities of nine extracellular enzymes differed over time, but not by treatment, in this plant litter system (30). In particular, the ratio of N- to C-acquiring enzymes (NAG/Cenz ratio) differed by month (P, <0.0001 by repeated-measures ANOVA), with the lowest NAG/Cenz ratios in the dry fall months (September 2012 and 2013). Further, the A/D gene abundance ratio explained almost half of the variation in the NAG/Cenz ratio (P, 0.045 by ANCOVA; adjusted R2, 0.47) (see Fig. S2 in the supplemental material).
DISCUSSION
Our analysis provides a blueprint for the genetic potential of N cycle processes in plant litter without the biases associated with targeting individual genes or a subset of microbial communities (47, 48). Of course, there are a number of caveats to interpreting metagenomic data (51). Most importantly, for many pathways, gene abundance in a community has not been found to correlate consistently with environmental process rates, which limits our ability to draw conclusions about activity (52–54). Still, a powerful feature of metagenomics data is the ability to make comparisons across many functional pathways and taxa at the same time. Indeed, we found that the abundance, composition, and diversity of N cycling genes differed greatly among the eight targeted pathways. By aggregating the data across pathways, prokaryotes and fungi appear to play equally important roles in N assimilation in this system. Assimilatory pathways were much more prevalent than dissimilatory pathways. And orders within the Actinobacteria and Proteobacteria appeared to be N cycling generalists, carrying genes from most pathways, in contrast to those from the Bacteroidetes, which were also relatively abundant in the litter.
The metagenomic picture of N cycling potential was further correlated with the functional potential of the community, as assayed by extracellular enzyme activities. Specifically, the ratio of assimilatory to dissimilatory gene abundance explained almost half of the variation in the ratio of N- to C-acquiring enzymes (NAG/Cenz), an index of the relative allocation to nutrient acquisition versus energy (49, 50). This relationship indicates that the metagenomic variation observed may have direct functional relevance for the plant litter community.
Comparisons across N cycling pathways.
The three most abundant N cycling pathways [i.e., ammonia assimilation, ANR(NO2− → NH3), and DNRA(NO3− → NO2−)] were associated with prokaryotes in proportion to their total abundances, indicating that the pathways are broadly distributed across the prokaryotes. For instance, ammonia assimilation is an ability shared by virtually all microorganisms, and sequences in this pathway made up the majority of N cycling sequences, a finding similar to those in other metagenomic studies across various environments (55–57).
The high abundance of ANR pathways suggests that NO3− and NO2− may be important sources of N on plant litter. This availability may be due in part to the high rates of atmospheric N deposition that occur in the Southern California region (28), although microbial ANR appears to be an important process in a wide range of terrestrial systems, including undisturbed soils and agricultural fields (58–60). In terrestrial systems, heterotrophic bacteria seem to prefer ammonium (NH4+) over NO3− or NO2− due to energetic costs (61, 62), unless they are limited by NH4+, in which case they may also use NO3− or NO2− (58, 63). Thus, the ability to assimilate NO3− and NO2− may provide an advantage in an N-limited ecosystem (64).
The DNRA(NO3− → NO2−) pathway was also abundant in the plant litter. Relatively little is known about DNRA in terrestrial systems (65). While the DNRA pathway in soil bacteria was discovered in the 1930s (66), until recently many studies considered denitrification the only dissimilatory reduction process in soil (67). Indeed, DNRA and denitrification are competitive processes, which occur primarily under anaerobic conditions (65). DNRA is now recognized as a key process in wetlands and has been observed in moist tropical soils (68). Modeling studies suggest that DNRA may be important in temperate grassland soils (69, 70), but its general significance in aerobic upland soils remains unclear (71).
There are several reasons why the plant litter environment may be conducive to DNRA. First, while the process is most likely to occur under anaerobic conditions, some studies have shown that DNRA is less sensitive to variable O2 and redox conditions than denitrification (72, 73). Second, DNRA is thought to be favored in high-C/N-ratio environments (65), like that of plant litter. Finally, oxygen gradients that range from 100 to 0% saturation within a few micrometers have been measured in plant litter layers (74, 75). Thus, we speculate that plant litter could be suitable for DNRA, particularly after rains, when the wet, matted-down litter may contain anaerobic pockets. Indeed, the highest abundances of DNRA(NO3− → NO2−) sequences in the litter samples were correlated with increased precipitation at the site. In the future, it would be useful to verify the activity of the pathway at the site by transcriptomics.
While less abundant, denitrification and N fixation genes were also present in the plant litter metagenomes. Denitrification is known to be an important process in terrestrial grasslands, where soils are a major source of N2O emissions to the atmosphere (15, 76). Denitrification in soils occurs primarily after precipitation events (77, 78). Like DNRA, the denitrification pathway was detected across a wide range of bacterial orders, but it was most common in orders from the phylum Proteobacteria.
N fixation appears to be one of the rarest of the pathways targeted in the litter community; only nitrification is less frequent. Although N fixation does occur during litter decomposition, estimated rates in the litter/soil layer are low, between <0.5 and 20 kg N ha−1 year−1 (79)—much lower than the symbiotic N fixation rates in various agricultural crops (80). Like that for DNRA(NO3− → NO2−), the genetic potential for N fixation was distributed across a distinct group of bacterial orders, many of which were present at low abundances in the community. It is often assumed that Rhizobiales carry out most N fixation in soils (81, 82); while 18% of all N fixation genes were classified as Rhizobiales, 82% were from other orders, including Pseudomonadales, Enterobacteriales, and Burkholderiales.
Temporal variation and sensitivity to global change manipulations.
In addition to the broad patterns of prokaryotic diversity supporting N cycling in plant litter, we investigated how these communities differed across the seasons and in response to drought and N addition treatments. Within pathways, gene abundance and taxonomic composition differed over time, but they differed little in response to the global change manipulations. Specifically, the manipulations did not impact N cycle pathway abundance and altered composition only within the DNRA(NO3− → NO2) and ANR(NO2− → NH3) pathways. This limited response of the N cycling pathways is somewhat surprising considering that the percentage of N in the plant litter increased significantly in the nitrogen addition plots (22). However, we may have missed some responses because of low statistical power and/or our focus on primarily inorganic pathways.
Previous metagenomic studies have detected changes in potential N cycling in response to environmental perturbations such as N addition (see, e.g., references 83 and 84); however, many of these studies consider the N cycle quite broadly, making direct comparisons difficult. A few studies highlight mixed responses by pathway (85–87); for instance, burning tended to increase the relative abundance of dissimilatory processes and decrease that of assimilatory processes (88).
In contrast to the response to global change manipulations, N cycling pathway abundance showed significant temporal variability. Other global change experiments have also revealed this pattern of strong temporal versus treatment effects on microbial communities (89–92). Such a result is perhaps not unexpected; annual mean precipitation at the Loma Ridge site is 30 cm, and almost all of this precipitation falls between November and April (29). As a result, microbial biomass on plant litter is reduced to less than 25% of peak levels during the summer dry season (22). Indeed, the abundance of some N cycling pathways followed this broad trend. In these cases, the frequency of the pathway (relative to all prokaryotes) was stable over time (no significant time effect), indicating that there was no differential selection for the pathway across seasons above and beyond the fluctuations in total prokaryotic abundance.
However, for the majority of the N pathways, gene abundance differed significantly over time, generally increasing during the wetter months. Corresponding to this trend, the NAG/Cenz activity ratio was lowest during the driest months. Thus, under wet conditions, selection may favor traits allowing for rapid N assimilation, whereas dry conditions may select for drought tolerance traits associated with different taxa (93).
Like the overall taxonomic composition of the litter community (30), the diversity and composition of bacterial lineages involved in most N cycling pathways differed across seasons. Compositional differences were driven by changes in the relative abundances of the most abundant taxa in the system. For example, some potential NO2− assimilators (e.g., Actinomycetales, Enterobacteriales, and Burkholderiales) displayed a seasonal signal, whereas others (e.g., Cytophagales and Rhodocyclales) were less affected by seasons. This pattern suggests that this pathway itself may not be selected for by season but instead may be linked to other traits that have a distinct distribution in bacterial lineages.
Conclusions.
This study provides an overview of microbial N cycling potential in a plant litter system and points to several directions for future research. In particular, the high abundance of DNRA pathway genes is intriguing and suggests that further work on this process in grassland ecosystems is warranted. We also observed that the degree of N pathway specialization among bacterial orders tended to decrease with their increase in abundance in the plant litter, suggesting that N cycling generalists may have an advantage in plant litter. However, it is not clear whether this pattern is specific to this environment or whether it may be a general feature of N-limited environments. Indeed, the results described here will be most useful in direct comparison to other ecosystems.
Supplementary Material
ACKNOWLEDGMENTS
We thank Claudia Weihe for help with sampling and lab work, Steven Allison for general project leadership, Michael Goulden for running the global change experiment, and members of the J. Martiny lab and Katrine Whiteson for useful comments on earlier versions of the manuscript.
This material is based on work supported by the U.S. Department of Energy, Office of Science, Biological and Environmental Research (BER) program, under award DE-PS02-09ER09-25.
Footnotes
Supplemental material for this article may be found at http://dx.doi.org/10.1128/AEM.02222-15.
REFERENCES
- 1.Raich JW, Schlesinger WH. 1992. The global carbon dioxide flux in soil respiration and its relationship to vegetation and climate. Tellus Ser B Chem Phys Meteorol 44:8. [Google Scholar]
- 2.Aerts R. 1997. Climate, leaf litter chemistry and leaf litter decomposition in terrestrial ecosystems: a triangular relationship. Oikos 79:439–449. doi: 10.2307/3546886. [DOI] [Google Scholar]
- 3.Chapin FS III, Matson PA, Mooney HA. 2002. Principles of terrestrial ecosystem ecology. Springer, New York, NY. [Google Scholar]
- 4.Mouginot C, Kawamura R, Matulich KL, Berlemont R, Allison SD, Amend AS, Martiny AC. 2014. Elemental stoichiometry of Fungi and Bacteria strains from grassland leaf litter. Soil Biol Biochem 76:278–285. doi: 10.1016/j.soilbio.2014.05.011. [DOI] [Google Scholar]
- 5.Paul EA, Clark FE. 1996. Soil microbiology and biochemistry. Academic Press, San Diego, CA. [Google Scholar]
- 6.Cleveland CC, Liptzin D. 2007. C:N:P stoichiometry in soil: is there a “Redfield ratio” for the microbial biomass? Biogeochemistry 85:235–252. doi: 10.1007/s10533-007-9132-0. [DOI] [Google Scholar]
- 7.Boberg JB, Finlay RD, Stenlid J, Lindahl BD. 2010. Fungal C translocation restricts N-mineralization in heterogeneous environments. Funct Ecol 24:454–459. doi: 10.1111/j.1365-2435.2009.01616.x. [DOI] [Google Scholar]
- 8.Schimel JP, Bennett J. 2004. Nitrogen mineralization: challenges of a changing paradigm. Ecology 85:591–602. doi: 10.1890/03-8002. [DOI] [Google Scholar]
- 9.Fenn ME, Bytnerowicz A. 1993. Dry deposition of nitrogen and sulfur to Ponderosa and Jeffrey pine in the San Bernardino National Forest in Southern California. Environ Pollut 81:277–285. doi: 10.1016/0269-7491(93)90210-F. [DOI] [PubMed] [Google Scholar]
- 10.Fenn ME, Bytnerowicz A. 1997. Summer throughfall and winter deposition in the San Bernardino Mountains in southern California. Atmos Environ 31:673–683. doi: 10.1016/S1352-2310(96)00238-5. [DOI] [Google Scholar]
- 11.Boonpragob K, Nash TH. 1990. Seasonal variation of elemental status in the Lichen Ramalina-Menziesii Tayl from 2 sites in Southern California—evidence for dry deposition accumulation. Environ Exp Bot 30:415–428. doi: 10.1016/0098-8472(90)90020-5. [DOI] [Google Scholar]
- 12.Schimel JP, Hattenschwiler S. 2007. Nitrogen transfer between decomposing leaves of different N status. Soil Biol Biochem 39:1428–1436. doi: 10.1016/j.soilbio.2006.12.037. [DOI] [Google Scholar]
- 13.Miki T, Ushio M, Fukui S, Kondoh M. 2010. Functional diversity of microbial decomposers facilitates plant coexistence in a plant-microbe-soil feedback model. Proc Natl Acad Sci U S A 107:14251–14256. doi: 10.1073/pnas.0914281107. [DOI] [PMC free article] [PubMed] [Google Scholar]
- 14.Geisseler D, Horwath WR, Joergensen RG, Ludwig B. 2010. Pathways of nitrogen utilization by soil microorganisms—a review. Soil Biol Biochem doi: 10.1016/jsoilbio.2010.08.021. [DOI] [Google Scholar]
- 15.Brown JR, Blankinship JC, Niboyet A, van Groenigen KJ, Dijkstra P, Le Roux X, Leadley PW, Hungate BA. 2012. Effects of multiple global change treatments on soil N2O fluxes. Biogeochemistry 109:85–100. doi: 10.1007/s10533-011-9655-2. [DOI] [Google Scholar]
- 16.Parton W, Silver WL, Burke IC, Grassens L, Harmon ME, Currie WS, King JY, Adair EC, Brandt LA, Hart SC, Fasth B. 2007. Global-scale similarities in nitrogen release patterns during long-term decomposition. Science 315:361–364. doi: 10.1126/science.1134853. [DOI] [PubMed] [Google Scholar]
- 17.Knorr M, Frey SD, Curtis PS. 2005. Nitrogen additions and litter decomposition: a meta-analysis. Ecology 86:3252–3257. doi: 10.1890/05-0150. [DOI] [Google Scholar]
- 18.Gholz HL, Wedin DA, Smitherman SM, Harmon ME, Parton WJ. 2000. Long-term dynamics of pine and hardwood litter in contrasting environments: toward a global model of decomposition. Glob Change Biol 6:751–765. doi: 10.1046/j.1365-2486.2000.00349.x. [DOI] [Google Scholar]
- 19.Moore AM. 1986. Temperature and moisture dependence of decomposition rates of hardwood and coniferous leaf litter. Soil Biol Biochem 18:427–435. doi: 10.1016/0038-0717(86)90049-0. [DOI] [Google Scholar]
- 20.Cisneros-Dozal LM, Trumbore SE, Hanson PJ. 2007. Effect of moisture on leaf litter decomposition and its contribution to soil respiration in a temperate forest. J Geophys Res Biogeosci 112:G01013. doi: 10.1029/2006JG000197. [DOI] [Google Scholar]
- 21.Seager R, Ting MF, Held I, Kushnir Y, Lu J, Vecchi G, Huang HP, Harnik N, Leetmaa A, Lau NC, Li CH, Velez J, Naik N. 2007. Model projections of an imminent transition to a more arid climate in southwestern North America. Science 316:1181–1184. doi: 10.1126/science.1139601. [DOI] [PubMed] [Google Scholar]
- 22.Allison SD, Lu Y, Weihe C, Goulden ML, Martiny AC, Treseder KK, Martiny JBH. 2013. Microbial abundance and composition influence litter decomposition response to environmental change. Ecology 94:714–725. doi: 10.1890/12-1243.1. [DOI] [PubMed] [Google Scholar]
- 23.Potts DL, Suding KN, Winston GC, Rocha AV, Goulden ML. 2012. Ecological effects of experimental drought and prescribed fire in a southern California coastal grassland. J Arid Environ 81:59–66. doi: 10.1016/j.jaridenv.2012.01.007. [DOI] [Google Scholar]
- 24.Frey SD, Knorr M, Parrent JL, Simpson RT. 2004. Chronic nitrogen enrichment affects the structure and function of the soil microbial community in temperate hardwood and pine forests. Forest Ecol Manag 196:159–171. doi: 10.1016/j.foreco.2004.03.018. [DOI] [Google Scholar]
- 25.Fenn ME, Allen EB, Weiss SB, Jovan S, Geiser LH, Tonnesen GS, Johnson RF, Rao LE, Gimeno BS, Yuan F, Meixner T, Bytnerowicz A. 2010. Nitrogen critical loads and management alternatives for N-impacted ecosystems in California. J Environ Manag 91:2404–2423. doi: 10.1016/j.jenvman.2010.07.034. [DOI] [PubMed] [Google Scholar]
- 26.Allen EB, Padgett PE, Bytnerowicz A, Minnich R. 1998. Nitrogen deposition effects on coastal sage vegetation of southern California. USDA Forest Service, Riverside, CA. [Google Scholar]
- 27.Egerton-Warburton LM, Allen EB. 2000. Shifts in arbuscular mycorrhizal communities along an anthropogenic nitrogen deposition gradient. Ecol Appl 10:484–496. doi: 10.1890/1051-0761(2000)010[0484:SIAMCA]2.0.CO;2. [DOI] [Google Scholar]
- 28.Fenn ME, Baron JS, Allen EB, Rueth HM, Nydick KR, Geiser L, Bowman WD, Sickman JO, Meixner T, Johnson DW, Neitlich P. 2003. Ecological effects of nitrogen deposition in the western United States. Bioscience 53:404–420. doi: 10.1641/0006-3568(2003)053[0404:EEONDI]2.0.CO;2. [DOI] [Google Scholar]
- 29.Kimball S, Goulden ML, Suding KN, Parker S. 2014. Altered water and nitrogen input shifts succession in a southern California coastal sage community. Ecol Appl 24:1390–1404. doi: 10.1890/13-1313.1. [DOI] [PubMed] [Google Scholar]
- 30.Matulich KL, Weihe C, Allison SD, Amend AS, Berlemont R, Goulden M, Martiny AC, Martiny JBH. 2015. Temporal variation overshadows the response of leaf litter microbial composition to simulated global change. ISME J doi: 10.1038/ismej.2015.58. [DOI] [PMC free article] [PubMed] [Google Scholar]
- 31.Berlemont R, Allison SD, Weihe C, Lu Y, Brodie EL, Martiny JBH, Martiny AC. 2014. Cellulolytic potential under environmental changes in microbial communities from grassland litter. Front Microbiol 5:639. doi: 10.3389/fmicb.2014.00639. [DOI] [PMC free article] [PubMed] [Google Scholar]
- 32.Matulich KL, Martiny JBH. 2015. Microbial composition alters the response of litter decomposition to environmental change. Ecology 96:9. [DOI] [PubMed] [Google Scholar]
- 33.Alster CJ, German DP, Lu Y, Allison SD. 2013. Microbial enzymatic responses to drought and to nitrogen addition in a southern California grassland. Soil Biol Biochem 64:68–79. doi: 10.1016/j.soilbio.2013.03.034. [DOI] [Google Scholar]
- 34.Brumelle S, Nemetz P, Casey D. 1984. Estimating means and variances: the comparative efficiency of composite and grab samples. Environ Monit Assess 4:81–84. doi: 10.1007/BF01047623. [DOI] [PubMed] [Google Scholar]
- 35.Sokal RR, Rohlf FJ. 2012. Biometry: the principles and practice of statistics in biological research, 4th ed W H Freeman and Co, New York, NY. [Google Scholar]
- 36.Meyer F, Paarmann D, D'Souza M, Olson R, Glass EM, Kubal M, Paczian T, Rodriguez A, Stevens R, Wilke A, Wilkening J, Edwards RA. 2008. The metagenomics RAST server—a public resource for the automatic phylogenetic and functional analysis of metagenomes. BMC Bioinformatics 9:386. doi: 10.1186/1471-2105-9-386. [DOI] [PMC free article] [PubMed] [Google Scholar]
- 37.Kanehisa M, Goto S, Furumichi M, Tanabe M, Hirakawa M. 2010. KEGG for representation and analysis of molecular networks involving diseases and drugs. Nucleic Acids Res 38:D355–D360. doi: 10.1093/nar/gkp896. [DOI] [PMC free article] [PubMed] [Google Scholar]
- 38.Overbeek R, Begley T, Butler RM, Choudhuri JV, Chuang HY, Cohoon M, de Crecy-Lagard V, Diaz N, Disz T, Edwards R, Fonstein M, Frank ED, Gerdes S, Glass EM, Goesmann A, Hanson A, Iwata-Reuyl D, Jensen R, Jamshidi N, Krause L, Kubal M, Larsen N, Linke B, McHardy AC, Meyer F, Neuweger H, Olsen G, Olson R, Osterman A, Portnoy V, Pusch GD, Rodionov DA, Ruckert C, Steiner J, Stevens R, Thiele I, Vassieva O, Ye Y, Zagnitko O, Vonstein V. 2005. The subsystems approach to genome annotation and its use in the project to annotate 1000 genomes. Nucleic Acids Res 33:5691–5702. doi: 10.1093/nar/gki866. [DOI] [PMC free article] [PubMed] [Google Scholar]
- 39.Prestat E, David MM, Hultman J, Tas N, Lamendella R, Dvornik J, Mackelprang R, Myrold DD, Jumpponen A, Tringe SG, Holman E, Mavromatis K, Jansson JK. 2014. FOAM (Functional Ontology Assignments for Metagenomes): a hidden Markov model (HMM) database with environmental focus. Nucleic Acids Res 42:e145. doi: 10.1093/nar/gku702. [DOI] [PMC free article] [PubMed] [Google Scholar]
- 40.Wilke A, Harrison T, Wilkening J, Field D, Glass EM, Kyrpides N, Mavrommatis K, Meyer F. 2012. The M5nr: a novel non-redundant database containing protein sequences and annotations from multiple sources and associated tools. BMC Bioinformatics 13:141. doi: 10.1186/1471-2105-13-141. [DOI] [PMC free article] [PubMed] [Google Scholar]
- 41.Dehal PS, Joachimiak MP, Price MN, Bates JT, Baumohl JK, Chivian D, Friedland GD, Huang KH, Keller K, Novichkov PS, Dubchak IL, Alm EJ, Arkin AP. 2010. MicrobesOnline: an integrated portal for comparative and functional genomics. Nucleic Acids Res 38:D396–D400. doi: 10.1093/nar/gkp919. [DOI] [PMC free article] [PubMed] [Google Scholar]
- 42.Batmalle CS, Chiang HI, Zhang K, Lomas MW, Martiny AC. 2014. Development and bias assessment of a method for targeted metagenomic sequencing of marine cyanobacteria. Appl Environ Microbiol 80:1116–1125. doi: 10.1128/AEM.02834-13. [DOI] [PMC free article] [PubMed] [Google Scholar]
- 43.Oksanen J, Blanchet FG, Kindt R, Legendre P, Minchin PR, O'Hara RB, Simpson GL, Solymos P, Stevens MH, Wagner H. 2013. vegan: Community Ecology Package. R package, version 2.0-7. http://vegan.r-forge.r-project.org/. [Google Scholar]
- 44.R Development Core Team. 2011. R: a language and environment for statistical computing. R Foundation for Statistical Computing, Vienna, Austria: . www.r-project.org. [Google Scholar]
- 45.Anderson MJ, Gorley RN, Clarke KR. 2008. Permanova+ for Primer: guide to software and statistical methods. PRIMER-E Ltd, Plymouth, United Kingdom. [Google Scholar]
- 46.Clarke KR, Warwick RM. 2001. Change in marine communities: an approach to statistical analysis and interpretation, 2nd ed PRIMER-E Ltd, Plymouth, United Kingdom. [Google Scholar]
- 47.Harell FE., Jr 2001. Regression modeling strategies with applications to linear models, logistic regression, and survival analysis. Springer-Verlag, New York, NY. doi: 10.1007/978-1-4757-3462-1. [DOI] [Google Scholar]
- 48.Clarke KR, Gorley RN. 2006. Primer v6: user manual/tutorial. PRIMER-E Ltd, Plymouth, United Kingdom. [Google Scholar]
- 49.Stone MM, DeForest JL, Plante AF. 2014. Changes in extracellular enzyme activity and microbial community structure with soil depth at the Luquillo Critical Zone Observatory. Soil Biol Biochem 75:237–247. doi: 10.1016/j.soilbio.2014.04.017. [DOI] [Google Scholar]
- 50.Sinsabaugh RL, Hill BH, Follstad Shah JJ. 2009. Ecoenzymatic stoichiometry of microbial organic nutrient acquisition in soil and sediment. Nature 462:795–798. doi: 10.1038/nature08632. [DOI] [PubMed] [Google Scholar]
- 51.Prosser JI. 2015. Dispersing misconceptions and identifying opportunities for the use of ‘omics’ in soil microbial ecology. Nat Rev Microbiol 13:439–446. doi: 10.1038/nrmicro3468. [DOI] [PubMed] [Google Scholar]
- 52.Gubry-Rangin C, Nicol GW, Prosser JI. 2010. Archaea rather than bacteria control nitrification in two agricultural acidic soils. FEMS Microbiol Ecol 74:566–574. doi: 10.1111/j.1574-6941.2010.00971.x. [DOI] [PubMed] [Google Scholar]
- 53.Attard E, Recous S, Chabbi A, De Berranger C, Guillaumaud N, Labreuche J, Philippot L, Schmid B, Le Roux X. 2011. Soil environmental conditions rather than denitrifier abundance and diversity drive potential denitrification after changes in land uses. Glob Change Biol 17:1975–1989. doi: 10.1111/j.1365-2486.2010.02340.x. [DOI] [Google Scholar]
- 54.Graham EB, Wieder WR, Leff JW, Weintraub SR, Townsend AR, Cleveland CC, Philippot L, Nemergut DR. 2014. Do we need to understand microbial communities to predict ecosystem function? A comparison of statistical models of nitrogen cycling processes. Soil Biol Biochem 68:279–282. [Google Scholar]
- 55.Varin T, Lovejoy C, Jungblut AD, Vincent WF, Corbeil J. 2010. Metagenomic profiling of Arctic microbial mat communities as nutrient scavenging and recycling systems. Limnol Oceanogr 55:1901–1911. doi: 10.4319/lo.2010.55.5.1901. [DOI] [Google Scholar]
- 56.Yu K, Zhang T. 2012. Metagenomic and metatranscriptomic analysis of microbial community structure and gene expression of activated sludge. PLoS One 7:e38183. doi: 10.1371/journal.pone.0038183. [DOI] [PMC free article] [PubMed] [Google Scholar]
- 57.Quinn RA, Lim YW, Maughan H, Conrad D, Rohwer F, Whiteson KL. 2014. Biogeochemical forces shape the composition and physiology of polymicrobial communities in the cystic fibrosis lung. mBio 5(2):e00956-13. doi: 10.1128/mBio.00956-13. [DOI] [PMC free article] [PubMed] [Google Scholar]
- 58.Booth MS, Stark JM, Rastetter E. 2005. Controls on nitrogen cycling in terrestrial ecosystems: a synthetic analysis of literature data. Ecol Monogr 75:139–157. doi: 10.1890/04-0988. [DOI] [Google Scholar]
- 59.Myrold DD, Posavatz NR. 2007. Potential importance of bacteria and fungi in nitrate assimilation in soil. Soil Biol Biochem 39:1737–1743. doi: 10.1016/j.soilbio.2007.01.033. [DOI] [Google Scholar]
- 60.Burger M, Jackson LE. 2003. Microbial immobilization of ammonium and nitrate in relation to ammonification and nitrification rates in organic and conventional cropping systems. Soil Biol Biochem 35:29–36. doi: 10.1016/S0038-0717(02)00233-X. [DOI] [Google Scholar]
- 61.Rice CW, Tiedje JM. 1989. Regulation of nitrate assimilation by ammonium in soils and in isolated soil-microorganisms. Soil Biol Biochem 21:597–602. doi: 10.1016/0038-0717(89)90135-1. [DOI] [Google Scholar]
- 62.Recous S, Mary B, Faurie G. 1990. Microbial immobilization of ammonium and nitrate in cultivated soils. Soil Biol Biochem 22:913–922. doi: 10.1016/0038-0717(90)90129-N. [DOI] [Google Scholar]
- 63.Nishio T, Komada M, Arao T, Kanamori T. 2001. Simultaneous determination of transformation rates of nitrate in soil. Jpn Agric Res Q 35:11–17. [Google Scholar]
- 64.Rediers H, Vanderleyden J, De Mot R. 2009. Nitrate respiration in Pseudomonas stutzeri A15 and its involvement in rice and wheat root colonization. Microbiol Res 164:461–468. doi: 10.1016/j.micres.2007.03.003. [DOI] [PubMed] [Google Scholar]
- 65.Rutting T, Boeckx P, Muller C, Klemedtsson L. 2011. Assessment of the importance of dissimilatory nitrate reduction to ammonium for the terrestrial nitrogen cycle. Biogeosciences 8:1779–1791. doi: 10.5194/bg-8-1779-2011. [DOI] [Google Scholar]
- 66.Woods DD. 1938. The reduction of nitrate to ammonia by Clostridium welchii. Biochem J 32:2000–2012. doi: 10.1042/bj0322000. [DOI] [PMC free article] [PubMed] [Google Scholar]
- 67.Cole JA. 1990. Physiology, biochemistry and genetics of nitrate dissimilation to ammonia, p 57–76. In Revsbech NP, Sørensen J (ed), Denitrification in soil and sediment. FEMS Symposium Series no. 56. Springer Science+Business Media, New York, NY. [Google Scholar]
- 68.Silver WL, Herman DJ, Firestone MK. 2001. Dissimilatory nitrate reduction to ammonium in upland tropical forest soils. Ecology 82:2410–2416. doi: 10.1890/0012-9658(2001)082[2410:DNRTAI]2.0.CO;2. [DOI] [Google Scholar]
- 69.Muller C, Abbasi MK, Kammann C, Clough TJ, Sherlock RR, Stevens RJ, Jager HJ. 2004. Soil respiratory quotient determined via barometric process separation combined with nitrogen-15 labeling. Soil Sci Soc Am J 68:1610–1615. doi: 10.2136/sssaj2004.1610. [DOI] [Google Scholar]
- 70.Muller C, Rutting T, Kattge J, Laughlin RJ, Stevens RJ. 2007. Estimation of parameters in complex N-15 tracing models by Monte Carlo sampling. Soil Biol Biochem 39:715–726. doi: 10.1016/j.soilbio.2006.09.021. [DOI] [Google Scholar]
- 71.Butterbach-Bahl K, Gundersen P. 2011. Nitrogen processes in terrestrial ecosystems, p 99–125. In Sutton MA, Howard CM, Erisman JW, Billen G, Bleeker A, Grennfelt P, van Grinsven H, Grizzetti B (ed), The European nitrogen assessment. Cambridge University Press, Cambridge, United Kingdom. [Google Scholar]
- 72.Fazzolari E, Nicolardot B, Germon JC. 1998. Simultaneous effects of increasing levels of glucose and oxygen partial pressures on denitrification and dissimilatory nitrate reduction to ammonium in repacked soil cores. Eur J Soil Biol 34:47–52. doi: 10.1016/S1164-5563(99)80006-5. [DOI] [Google Scholar]
- 73.Pett-Ridge J, Silver WL, Firestone MK. 2006. Redox fluctuations frame microbial community impacts on N-cycling rates in a humid tropical forest soil. Biogeochemistry 81:95–110. doi: 10.1007/s10533-006-9032-8. [DOI] [Google Scholar]
- 74.Reith F, Drake HL, Kusel K. 2002. Anaerobic activities of bacteria and fungi in moderately acidic conifer and deciduous leaf litter. FEMS Microbiol Ecol 41:27–35. doi: 10.1111/j.1574-6941.2002.tb00963.x. [DOI] [PubMed] [Google Scholar]
- 75.van der Lee GEM, de Winder B, Bouten W, Tietema A. 1999. Anoxic microsites in Douglas fir litter. Soil Biol Biochem 31:1295–1301. doi: 10.1016/S0038-0717(99)00048-6. [DOI] [Google Scholar]
- 76.Bouwman AF, Beusen AHW, Griffioen J, Van Groenigen JW, Hefting MM, Oenema O, Van Puijenbroek PJTM, Seitzinger S, Slomp CP, Stehfest E. 2013. Global trends and uncertainties in terrestrial denitrification and N2O emissions. Philos Trans R Soc Lond B Biol Sci 368:20130112. doi: 10.1098/rstb.2013.0112. [DOI] [PMC free article] [PubMed] [Google Scholar]
- 77.Hartley AE, Schlesinger WH. 2000. Environmental controls on nitric oxide emission from northern Chihuahuan desert soils. Biogeochemistry 50:279–300. doi: 10.1023/A:1006377832207. [DOI] [Google Scholar]
- 78.Nielsen UN, Ball BA. 2014. Impacts of altered precipitation regimes on soil communities and biogeochemistry in arid and semi-arid ecosystems. Glob Chang Biol doi: 10.1111/gcb.12789. [DOI] [PubMed] [Google Scholar]
- 79.Cleveland CC, Townsend AR, Schimel DS, Fisher H, Howarth RW, Hedin LO, Perakis SS, Latty EF, Von Fischer JC, Elseroad A, Wasson MF. 1999. Global patterns of terrestrial biological nitrogen (N2) fixation in natural ecosystems. Glob Biogeochem Cycles 13:623–645. doi: 10.1029/1999GB900014. [DOI] [Google Scholar]
- 80.Smil V. 1999. Nitrogen in crop production: an account of global flows. Glob Biogeochem Cycles 13:647–662. doi: 10.1029/1999GB900015. [DOI] [Google Scholar]
- 81.Resendis-Antonio O, Hernandez M, Salazar E, Contreras S, Batallar GM, Mora Y, Encarnacion S. 2011. Systems biology of bacterial nitrogen fixation: high-throughput technology and its integrative description with constraint-based modeling. BMC Syst Biol 5:120. doi: 10.1186/1752-0509-5-120. [DOI] [PMC free article] [PubMed] [Google Scholar]
- 82.Wang Q, Quensen JF, Fish JA, Lee TK, Sun YN, Tiedje JM, Cole JR. 2013. Ecological patterns of nifH genes in four terrestrial climatic zones explored with targeted metagenomics using FrameBot, a new informatics tool. mBio 4(5):e00592-13. doi: 10.1128/mBio.00592-13. [DOI] [PMC free article] [PubMed] [Google Scholar]
- 83.Fierer N, Leff JW, Adams BJ, Nielsen UN, Bates ST, Lauber CL, Owens S, Gilbert JA, Wall DH, Caporaso JG. 2012. Cross-biome metagenomic analyses of soil microbial communities and their functional attributes. Proc Natl Acad Sci U S A 109:21390–21395. doi: 10.1073/pnas.1215210110. [DOI] [PMC free article] [PubMed] [Google Scholar]
- 84.Vega Thurber R, Willner-Hall D, Rodriguez-Mueller B, Desnues C, Edwards RA, Angly F, Dinsdale E, Kelly L, Rohwer F. 2009. Metagenomic analysis of stressed coral holobionts. Environ Microbiol 11:2148–2163. doi: 10.1111/j.1462-2920.2009.01935.x. [DOI] [PubMed] [Google Scholar]
- 85.Mason OU, Scott NM, Gonzalez A, Robbins-Pianka A, Baelum J, Kimbrel J, Bouskill NJ, Prestat E, Borglin S, Joyner DC, Fortney JL, Jurelevicius D, Stringfellow WT, Alvarez-Cohen L, Hazen TC, Knight R, Gilbert JA, Jansson JK. 2014. Metagenomics reveals sediment microbial community response to Deepwater Horizon oil spill. ISME J 8:1464–1475. doi: 10.1038/ismej.2013.254. [DOI] [PMC free article] [PubMed] [Google Scholar]
- 86.Cobo-Díaz JF, Fernández-González AJ, Villadas PJ, Robles AB, Toro N, Fernández-López M. 2015. Metagenomic assessment of the potential microbial nitrogen pathways in the rhizosphere of a Mediterranean forest after a wildfire. Microb Ecol doi: 10.1007/s00248-015-0586-7. [DOI] [PubMed] [Google Scholar]
- 87.Luo C, Rodriguez RL, Johnston ER, Wu L, Cheng L, Xue K, Tu Q, Deng Y, He Z, Shi JZ, Yuan MM, Sherry RA, Li D, Luo Y, Schuur EA, Chain P, Tiedje JM, Zhou J, Konstantinidis KT. 2014. Soil microbial community responses to a decade of warming as revealed by comparative metagenomics. Appl Environ Microbiol 80:1777–1786. doi: 10.1128/AEM.03712-13. [DOI] [PMC free article] [PubMed] [Google Scholar]
- 88.Tas N, Prestat E, McFarland JW, Wickland KP, Knight R, Berhe AA, Jorgenson T, Waldrop MP, Jansson JK. 2014. Impact of fire on active layer and permafrost microbial communities and metagenomes in an upland Alaskan boreal forest. ISME J 8:1904–1919. doi: 10.1038/ismej.2014.36. [DOI] [PMC free article] [PubMed] [Google Scholar]
- 89.Yuste JC, Penuelas J, Estiarte M, Garcia-Mas J, Mattana S, Ogaya R, Pujol M, Sardans J. 2011. Drought-resistant fungi control soil organic matter decomposition and its response to temperature. Glob Change Biol 17:1475–1486. doi: 10.1111/j.1365-2486.2010.02300.x. [DOI] [Google Scholar]
- 90.Cruz-Martinez K, Suttle KB, Brodie EL, Power ME, Andersen GL, Banfield JF. 2009. Despite strong seasonal responses, soil microbial consortia are more resilient to long-term changes in rainfall than overlying grassland. ISME J 3:738–744. doi: 10.1038/ismej.2009.16. [DOI] [PubMed] [Google Scholar]
- 91.Cregger MA, Schadt CW, McDowell NG, Pockman WT, Classen AT. 2012. Response of the soil microbial community to changes in precipitation in a semiarid ecosystem. Appl Environ Microbiol 78:8587–8594. doi: 10.1128/AEM.02050-12. [DOI] [PMC free article] [PubMed] [Google Scholar]
- 92.Gutknecht JLM, Field CB, Balser TC. 2012. Microbial communities and their responses to simulated global change fluctuate greatly over multiple years. Glob Change Biol 18:2256–2269. doi: 10.1111/j.1365-2486.2012.02686.x. [DOI] [Google Scholar]
- 93.Schimel J, Balser TC, Wallenstein M. 2007. Microbial stress-response physiology and its implications for ecosystem function. Ecology 88:1386–1394. doi: 10.1890/06-0219. [DOI] [PubMed] [Google Scholar]
- 94.Letunic I, Bork P. 2011. Interactive Tree Of Life v2: online annotation and display of phylogenetic trees made easy. Nucleic Acids Res 39:W475–W478. doi: 10.1093/nar/gkr201. [DOI] [PMC free article] [PubMed] [Google Scholar]
Associated Data
This section collects any data citations, data availability statements, or supplementary materials included in this article.