

Touch inhibits Aδ and C-fibre cortical potentials. Touch also suppresses the nociceptive blink reflex, a response generated before nociceptive input reaches the cortex.
Keywords: Electrophysiology, EEG, Somatosensory-evoked potentials, Laser-evoked potentials, Nociceptive blink reflex, Gate control theory, Analgesia, Pain modulation
Abstract
The neural mechanisms of the powerful analgesia induced by touching a painful body part are controversial. A long tradition of neurophysiologic studies in anaesthetized spinal animals indicate that touch can gate nociceptive input at spinal level. In contrast, recent studies in awake humans have suggested that supraspinal mechanisms can be sufficient to drive touch-induced analgesia. To investigate this issue, we evaluated the modulation exerted by touch on established electrophysiologic markers of nociceptive function at both subcortical and cortical levels in humans. Aδ and C skin nociceptors were selectively activated by high-power laser pulses. As markers of subcortical and cortical function, we recorded the laser blink reflex, which is generated by brainstem circuits before the arrival of nociceptive signals at the cortex, and laser-evoked potentials, which reflect neural activity of a wide array of cortical areas. If subcortical nociceptive responses are inhibited by concomitant touch, supraspinal mechanisms alone are unlikely to be sufficient to drive touch-induced analgesia. Touch induced a clear analgesic effect, suppressed the laser blink reflex, and inhibited both Aδ-fibre and C-fibre laser-evoked potentials. Thus, we conclude that touch-induced analgesia is likely to be mediated by a subcortical gating of the ascending nociceptive input, which in turn results in a modulation of cortical responses. Hence, supraspinal mechanisms alone are not sufficient to mediate touch-induced analgesia.
1. Introduction
Touch can relieve pain. The analgesic effect of touching a sore body part is a common everyday experience. Nevertheless, its underlying mechanisms are debated. Surprisingly, few neurophysiologic studies of touch-induced analgesia have been conducted in humans and have yielded controversial results. Most investigations of this effect have been conducted in anesthetized or “spinal” animals, after total transection of the spinal cord.38 These studies showed that tactile input segmentally inhibits nociceptive input at spinal level.4,50,51
However, it remains unclear if and how these neural mechanisms, which have been characterized in anaesthetized spinal animals, translate first to the awake animal and finally to the awake human.10,40 In particular, the full transection of the spinal cord used in the spinal animal eliminates, by definition, any descending control of spinal circuitry, as well as the transmission of the ascending nociceptive volley to the brain.
Neurophysiologic and psychophysical investigations of touch-induced analgesia in humans have suggested that modulation entirely occurs at supraspinal levels.19,46 Nonetheless, some of this evidence is difficult to evaluate, because it depends on subtle details of the physiological method, such as the estimated arrival times of tactile and nociceptive volleys at particular neural centers.
For instance, Inui et al.19 observed that cortical responses to nociceptive stimulation of Aδ fibers conducting at 9 to 16 m/s47 are modulated by tactile stimulation of Aβ fibers conducting at 36 to 78 m/s,24 even when the Aβ stimulation occurs up to 60 milliseconds after the onset of the nociceptive input. They took the 60-millisecond delay between the Aδ and the subsequent Aβ stimulation as evidence that the tactile modulation of nociceptive input occurs at cortical level. However, because of the significant variability in conduction velocity of Aδ nociceptive afferents,56 the possibility that tactile input reaches the spinal cord before nociceptive input cannot be ruled out. Stronger evidence would require the combination of several physiological measures, each reflecting a specific level of nociceptive processing hierarchy, notably the subcortical and cortical stages.
We therefore induced a robust touch-induced analgesia36 and simultaneously recorded established electrophysiologic markers of subcortical and cortical nociceptive processing. Specifically, we combined selective laser stimulation of Aδ and C skin nociceptors with von Frey stimulation of Aβ mechanoreceptors in the same region (ie, within ∼1 cm). As marker of subcortical nociceptive processing, we recorded the laser blink reflex (LBR), a response generated by brain stem circuits before ascending nociceptive signals reach the cortex.31,39,49 As markers of cortical nociceptive processing, we recorded the laser-evoked brain potentials (LEPs), a response generated by a set of cortical areas activated by the ascending Aδ- and C-fiber input.6,7,15 If LBR was suppressed by concomitant touch, then supraspinal mechanisms alone are unlikely to be sufficient to drive touch-induced analgesia, which would therefore be mediated by a subcortical gating of the ascending nociceptive volley.
2. Methods
2.1. Participants
Twenty-one healthy right-handed volunteers (9 females) aged 19 to 30 years old (mean ± SD, 22.6 ± 3.2) participated in the experiment, after having given written informed consent. Experimental procedures were approved by the ethics committee of University College London (2492/001).
2.2. Nociceptive stimulation
We used radiant heat pulses generated by an infrared neodymium: yttrium-aluminum-perovskite laser with a wavelength of 1.34 μm (Electronical Engineering, Italy). These laser pulses selectively excite Aδ and C nociceptive free nerve endings in the epidermis,5 without coactivating lower-threshold Aβ fibers in the dermis.35,53 Because of the different conduction velocity of thinly myelinated Aδ fibers and unmyelinated C fibers, laser pulses elicit a double sensation: an initial Aδ-fiber-related pricking pain, followed by a C-fiber-related burning pain.32
Laser pulses were directed to a rectangular skin area (4 × 2 cm, main axis mediolateral) centred on the dorsum of the right hand and defined before the beginning of the experimental session. An He–Ne visible laser pointed to the stimulated area. The laser beam was transmitted through an optic fiber, and its diameter was set at approximately 3 mm (∼7 mm2) by focusing lenses. The duration of each laser pulse was 4 milliseconds.
We first identified, in each participant, the pinprick detection threshold (corresponding to the activation threshold of Aδ fibers; Ref. 6) using ascending staircases. The threshold was defined as the first stimulus energy that elicited a pinprick sensation in 3 consecutive repetitions.35 In the main experiment, we delivered stimuli at 2 energies, both suprathreshold for Aδ fibers: 0.1 J and 0.2 J above the pinprick detection threshold. The 2 energies were 0.7 ± 0.1 J and 0.8 ± 0.1 J. We used 2 stimulus energies, rather than one, to introduce some variability in the ratings and keep participants engaged in the task.36 Because the 2 energies could not be easily discriminated, they were collapsed in the statistical analyses.
To avoid receptor fatigue or sensitization, the laser beam was shifted after each trial within the predefined stimulated area. Because variations in baseline skin temperature may modulate pain perception,9 an infrared thermometer was used to ensure that the hand temperature remained constant across blocks.
2.3. Tactile stimulation
Tactile stimuli were delivered using a pair of von Frey hairs (1 g, diameter 0.4 mm), along a proximal–distal axis intersecting the location of the laser stimulus (Fig. 1). The 2 tactile stimuli were equidistant to the site of laser stimulation (1.5 cm on each side). The stimulation was delivered by a computer-controlled 3-axis robot (Arrick Robotics, Tyler, TX), and its duration was between 3 and 3.4 seconds (rectangular distribution). The rationale for using a pair of tactile stimuli was to keep the focus of tactile spatial attention centered on the site of laser stimulation, thus avoiding any shift of attention towards the tactile stimulus.28,36 Indeed, when 2 successive stimuli are delivered at different spatial locations (eg, a tactile stimulus followed by a nociceptive stimulus), attention is shifted from the location of the first stimulus to the location of the second stimulus. The spatial configuration of the conditioning stimuli in our experiment (Fig. 1) minimized this attentional shift.
Figure 1.
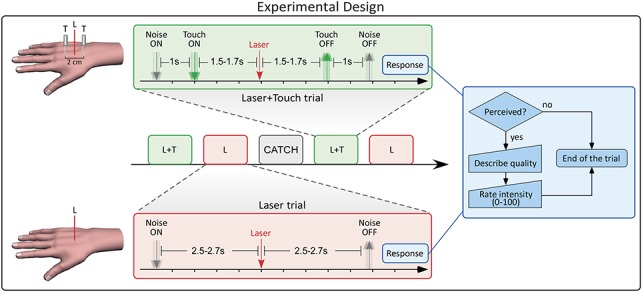
Experimental paradigm. Each trial corresponded to one of the following 3 experimental conditions: Laser (L), Laser + Touch (L + T), and Catch. In each condition, white noise was played for 7 seconds. In the L + T condition, a robot delivered a pair of tactile stimuli from 1.5 to 1.7 seconds before until 1.5 to 1.7 seconds after the onset of the laser pulse. In the L condition, no tactile stimulation was delivered. In the Catch condition, neither nociceptive nor tactile stimulation occurred. At the end of the white noise, participants were instructed to respond, by verbally reporting both the quality and the intensity of the sensation evoked by laser stimulation.
2.4. Electrophysiologic recording
The electroencephalogram (EEG) was recorded using 30 Ag–AgCl electrodes placed on the scalp according to the International 10-20 system, using the nose as reference. The LBR was recorded from the orbicularis oculi muscle ipsilateral to the stimulated hand, using 2 electromyographic (EMG) surface electrodes. The active electrode was placed over the mid lower eyelid and the reference electrode a few centimeters laterally to the outer canthus. Electrophysiologic signals were amplified and digitized using a sampling rate of 1024 Hz (SD32; Micromed, Treviso, Italy).
2.5. Experimental design
Participants sat comfortably with their right hand resting on a table. They were instructed to focus on the stimuli, keep their eyes open, and gaze at a fixation point. A black curtain blocked the view of the hand.
Each trial corresponded to one of the following experimental conditions: Laser (L), Laser + Touch (L + T), and Catch (C). The timeline of events in the L and L + T conditions is shown in Figure 1. In each trial, white noise was played for 7 seconds, starting 2.5 to 2.7 seconds before the laser stimulation, until 4.3 to 4.5 seconds after the laser stimulation. The noise provided an auditory cue for the forthcoming laser stimulation, while masking the robot movement.
In the L + T condition, the robot delivered a pair of tactile stimuli 1.5 to 1.7 seconds before the onset of the laser pulse (ie, 1 second after the onset of the white noise). The hair filament was removed 1.5 to 1.7 seconds after the laser pulse. Therefore, the tactile stimulation lasted between 3 and 3.4 seconds (rectangular distribution).
The L condition was identical to the L + T condition, with the only exception that the robot made an upward movement instead of delivering the tactile stimulation. Therefore, no tactile stimulus was delivered in this condition. The laser pulse was delivered 2.5 to 2.7 seconds after the onset of the white noise.
In the C condition, the white noise was played for 7 seconds and the robot, again, moved upwards. Neither nociceptive nor tactile stimulation occurred.
At the end of the white noise, participants were instructed to verbally report both the quality and the intensity of the sensation evoked by laser stimulation (see 2.6). The next trial started between 6 and 8.5 seconds after the participant responded.
Trials were delivered in blocks of 5. Each block consisted of 2 L trials, 2 L + T trials, and 1 C trial, in randomised order. In each pair of trials involving laser stimulation (ie, both L and L + T conditions), 1 stimulus was 0.1 J above threshold and the other 0.2 J above threshold. Thus, within each condition, the 2 laser energies were equally frequent. The order of energies was also randomized. In each participant, 18 blocks of stimulation were delivered.
2.6. Psychophysical measures
Three different behavioral measures were collected at the end of each trial (Fig. 1) in the following order:
(1) Detection: Participants were asked to report if they detected the laser stimulus.
(2) Quality of sensation: If the laser stimulus was detected, participants were asked to describe the first evoked sensation, using 8 verbal descriptors shown to reflect the activation of either Aδ fibers (pinprick) or C fibers (warm, dull, drawing, burning, pressing). These adjectives have been demonstrated to best discriminate between first and second pain.1,53 If none of the above descriptors was appropriate, the volunteers were invited to use any other word of their choice.
(3) Perceived pain intensity: If the laser stimulus was detected, participants were asked to report the intensity of the evoked sensation, using a numerical rating scale ranging from 0 (no pain) to 100 (worst imaginable pain).
2.7. Electroencephalogram data analysis
2.7.1. Preprocessing
The EEG data were preprocessed and analysed using Letswave (http://www.nocions.org/letswave/) and EEGLAB.11 Continuous EEG data were band-pass filtered from 1 to 30 Hz, segmented into epochs using a time window ranging from −1 to +2 seconds relative to the onset of the laser stimulus, and baseline corrected using the interval from −1 to 0 as reference. Trials contaminated by eye blinks and movements were corrected using independent component analysis.11 In all data sets, independent components related to eye movement showed a large Electro-Oculogram channel contribution and a frontal scalp distribution. In addition, epochs with amplitude values exceeding ±80 μV (ie, epochs likely to be contaminated by artifacts) were excluded. Next, epochs were averaged time locked to the onset of the laser stimulus, to identify the LEPs elicited by the concomitant stimulation of Aδ and C fibers. Laser-evoked potentials consist of several transient responses that are time locked and phase locked to the onset of laser stimuli.42
2.7.2. Aδ-laser-evoked potentials
Epochs belonging to the same experimental condition were averaged across trials, which resulted in 2 average waveforms (L and L + T) for each subject. For each condition, the peak latency and amplitude of the N1, N2, P2, and P4 waves of the Aδ-LEPs were measured as follows. The Aδ-N2 and Aδ-P2 waves, defined as the most negative and positive deflections after stimulus onset, were measured at the vertex (Cz), referenced to the nose. The Aδ-N1 and Aδ-P4 waves, defined as the smallest negative and positive deflections preceding the Aδ-N2 wave and following the Aδ-P2 wave, were measured at the central electrode contralateral to the stimulated side (C3), referenced to Fz.16 To test whether touch modulated the amplitude of Aδ-LEPs, we performed a point-by-point paired-sample t test between the responses obtained in the L and L + T conditions. To account for multiple comparisons in the point-by-point statistical testing, significant time points (P < 0.05) were clustered based on their temporal adjacency (cluster-level statistical analysis). For each cluster, we calculated the pseudo-t statistic of the 2 conditions, estimated its distribution by permutation testing (5000 times), and generated the bootstrap P values for the null hypothesis.37 This procedure identified the clusters in which the responses in the L and L + T conditions were significantly different.17
To test whether touch modulated the latency of Aδ-LEPs, we conducted an omnibus analysis of variance on the latency of the Aδ-N1, Aδ-N2, Aδ-P2, and Aδ-P4 peaks, with 2 within-subject factors: “condition” (2 levels: L, L + T) and “wave” (4 levels: N1, N2, P2, P4). In 2 of 21 participants, no Aδ-P4 waves were detectable in the L + T condition. These 2 participants were excluded from the latency analysis.
2.7.3. C-laser-evoked potentials
“Ultralate” LEP waves, reflecting the cortical response elicited by the afferent C-fiber input, are notoriously variable across individuals. To minimize interindividual variability, LEP waveforms were peak aligned using a validated procedure.15 Briefly, single-subject peak latencies of the Aδ-N2, Aδ-P2, C-N2, and C-P2 waves were first aligned to their respective averages, and then the amplitude of the signal between each pair of consecutive LEP waves was linearly interpolated. This procedure yielded 1 aligned LEP waveform for each subject and condition, in which the peak latencies of Aδ-N2, Aδ-P2, C-N2, and C-P2 were identical across all subjects. To compare C-LEPs in the L and L + T conditions, we performed the same point-by-point analysis with cluster-level permutation testing used for Aδ-LEPs.
2.8. Laser blink reflex analysis
Electromyographic data were also preprocessed and analysed using Letswave. Continuous EMG data were high-pass filtered at 55 Hz, segmented into epochs using a time window ranging from −1 to +2 seconds relative to the onset of the laser stimulus, and full-wave rectified. Extracted epochs were averaged for each subject and condition. To compare the LBR response in the L and L + T conditions, we performed the same point-by-point analysis with cluster-level permutation testing used for Aδ and C-LEPs.
3. Results
3.1. Psychophysics
3.1.1. Probability of detection
The probability of detecting the laser stimulus was significantly reduced in the L + T condition (mean ± SE, 96.4% ± 1%) relative to the L condition (mean ± SE, 99.3% ± 0.3%; Wilcoxon signed rank test, P = 0.003; Fig. 2A). This finding is in line with previous evidence.36
Figure 2.
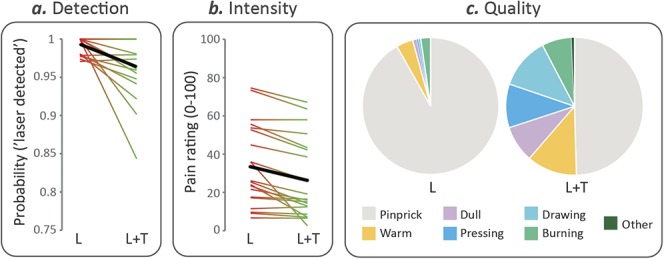
Psychophysical results. Probability of detecting the laser stimulus (A), and average rating of subjective pain intensity when the laser was detected (B), in the “Laser” (L) and “Laser + Touch” (L + T) conditions. Each thin line represents a single subject, whereas the thick line depicts the group average. (C) Average frequency of occurrence of the descriptors of the quality of the elicited sensation when the laser was detected, in the L and L + T conditions.
3.1.2. Perceived intensity
Subjective pain intensity was also significantly reduced in the L + T (mean rating ± SE, 25.4 ± 4.7) relative to the L condition (mean rating ± SE, 33.4 ± 4.8; Wilcoxon signed rank test, P < 0.0001). Figure 2B shows that touch-induced analgesia, demonstrated by a reduction in pain intensity ratings, was present in 19 of 21 participants.
3.1.3. Quality of sensation
The frequency of occurrence of the different descriptors is shown in Figure 2C. The label “pinprick,” which represents an established correlate of Aδ-fiber activation fibers,1 was chosen in 91.8% ± 1.5% of trials in the L condition but only in 49.6% ± 6.6% of trials in the L + T condition (Wilcoxon signed rank test, P < 0.0001).
3.2. Tactile modulation of Aδ-laser-evoked potentials
Figure 3 depicts the grand average LEP waveforms in the L and L + T conditions, at electrodes Cz and C3, together with the scalp topographies of the main waves at their peak latencies (Aδ-N1, Aδ-N2, Aδ-P2, and Aδ-P4). Touch had a dramatic modulatory effect on all Aδ-LEP waves. Importantly, this modulation was highly consistent across participants, as demonstrated by a reduction of Aδ-LEP amplitudes in every single participant (Fig. 3, right insets).
Figure 3.
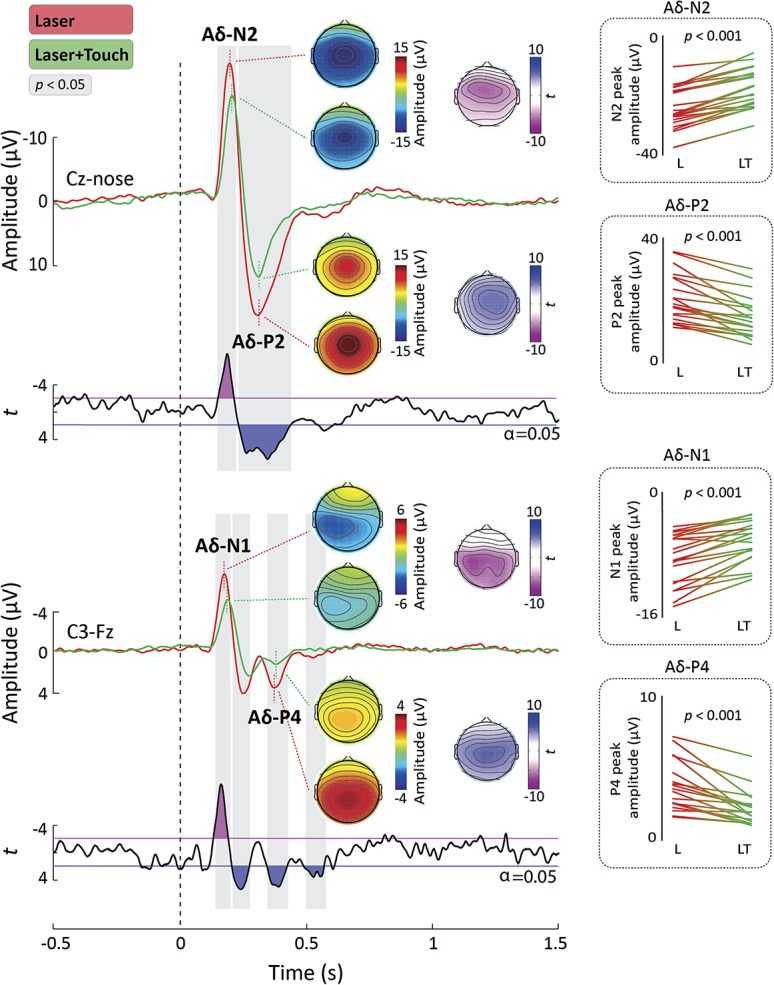
Aδ-laser-evoked potentials (Aδ-LEPs). Laser-evoked potentials (LEPs) were elicited by the stimulation of the right hand dorsum and recorded from 32 electrodes. Displayed signals show group-level LEPs recorded from the vertex (Cz vs nose) and from the contralateral central electrode (C3 vs Fz). Point-by-point t values are shown below the LEPs. Time intervals during which the LEP was significantly different in the “Laser” (L) and “Laser + Touch” (L + T) conditions are highlighted in gray. Scalp topographies of the response amplitude in the L and L + T conditions are displayed at the peak latency of the Aδ-N1, Aδ-N2, Aδ-P2, and Aδ-P4 waves. The topographical distribution of t values reflecting the statistical comparison between the L and L + T conditions is shown for each of the 4 waves. The line graphs on the right-hand side show the single-subject peak amplitudes of each wave in the 2 conditions. The P values reflect the significance of the paired t test between the peak amplitudes in the L and L + T conditions (Bonferroni-corrected t tests, α = 0.0125, 2-tailed).
3.2.1. Response amplitude
The point-by-point t test (Fig. 3) showed that the amplitude of LEPs in the L + T condition was significantly reduced relative to the L condition in 2 time windows: 148 to 222 milliseconds, encompassing the latency of the Aδ-N1 and Aδ-N2 waves, and 228 to 436 milliseconds, encompassing the latency of the Aδ-P2 wave. The scalp distribution of these significant differences (represented using statistical t values) is also shown in Figure 3. In the first time window, the modulatory effect of touch extended bilaterally towards the temporal regions, whereas in the second time window it was more centrally distributed.
To further test the touch-induced modulation of the Aδ-N1 and Aδ-P4 waves, we also performed a point-by-point t test on the waveform obtained from the central electrode contralateral to the stimulated hand (C3). There was a significant reduction of LEP amplitude in several time intervals: 141 to 202 milliseconds, encompassing the latency of the Aδ-N1 wave,58 222 to 309 milliseconds and 328 to 436 milliseconds, encompassing the latency of the Aδ-P4 wave,16 and 520 to 610 milliseconds. The topography of the statistical t values (Fig. 3) clearly shows that, at the latency of the Aδ-N1 peak, the L and L + T conditions maximally differed at the level of central electrodes. This is in line with previous evidence that the Aδ-N1 is generated by somatotopically-arranged primary sensorimotor regions.16,58
3.2.2. Response latency
Finally, we investigated whether touch modulated the peak latency of the Aδ-N1, Aδ-N2, Aδ-P2, and Aδ-P4 waves. The omnibus analysis of variance revealed significant main effects of both “condition” (F1,18 = 17.34, P = 0.001) and “wave” (F3,54 = 391.03, P < 0.0001). Furthermore, there was a significant interaction between “condition” and “wave” (F3,54 = 3.43, P = 0.023). We explored this interaction with Bonferroni-corrected t tests (resulting in α = 0.0125, 2-tailed) comparing the peak latency of each Aδ-LEP wave between the 2 conditions. There was a significant increase of the latency of both the Ad-N1 (t20 = 24.28, P < 0.0001), Ad-N2 peaks (t20 = 26.49, P < 0.0001), and Ad-P4 (t18 = 22.25, P = 0.037) in the L 1 T relative to the L condition (Fig. 3). In contrast touch did not significantly alter the latency of the Ad-P2 wave (t20 = 20.23, P = 0.819).
3.3. Tactile modulation of C-laser-evoked potentials
Figure 4 shows the grand average LEP waveforms in the L and L + T conditions, at Cz, after peak alignment. Similarly to Aδ-LEPs, C-LEPs were also strongly suppressed by tactile input. The point-by-point paired sample t test comparing LEP waveforms showed that there was a significant amplitude reduction in the L + T condition in the 743 to 884 milliseconds time interval, encompassing the latency of the C-N2 wave. There was also a trend for smaller amplitude in the L + T condition in the time window of the C-P2 wave.3,15
Figure 4.
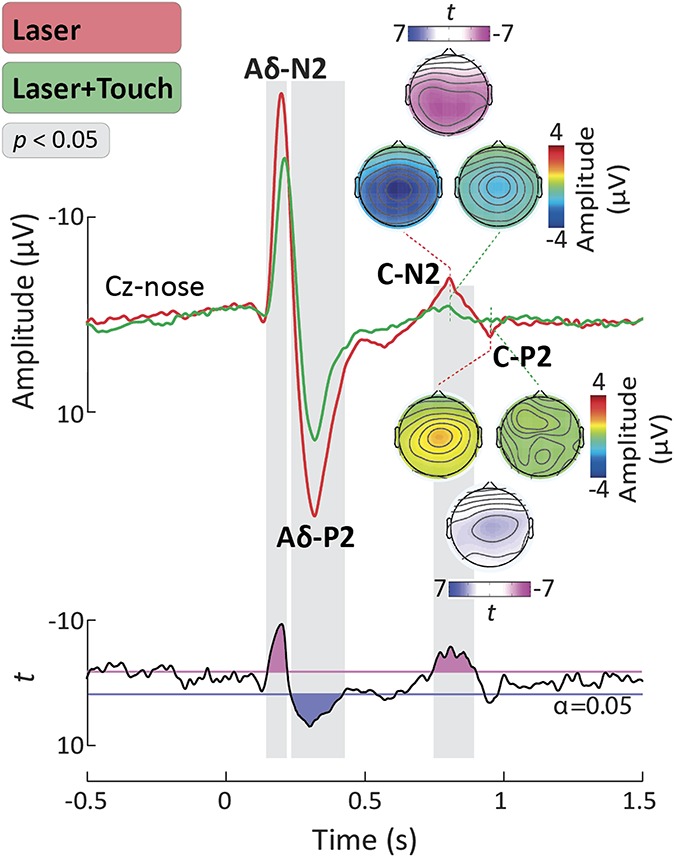
C-laser-evoked potentials (C-LEPs). Waveforms were aligned according to the peak latency of the Aδ-N2, Aδ-P2, C-N2, and C-P2 waves, using a validated method. Displayed signals show group-level LEPs recorded from the vertex (Cz vs nose). Point-by-point t values are shown below the LEPs. Time intervals during which the LEP was significantly different in the “Laser” (L) and “Laser + Touch” (L + T) conditions are highlighted in gray. Scalp topographies of the response amplitude in the L and L + T conditions are displayed at the peak latency of the C-N2 and C-P2 waves, together with the topographical distribution of t values reflecting the statistical comparison between the L and L + T conditions.
3.4. Modulation of the laser blink reflex
Figure 5 shows the average LBR waveforms in the L and L + T conditions. In both conditions, laser stimulation of the hand evoked a clear blink reflex with an onset latency of approximately 110 milliseconds. As previously described,52 this LBR onset latency reflects the conduction velocity of Aδ afferents. Crucially, the LBR magnitude was significantly reduced in the L + T condition compared with the L condition. Point-by-point t tests revealed a significant reduction between 118 and 160 milliseconds after stimulus onset (Fig. 5).
Figure 5.
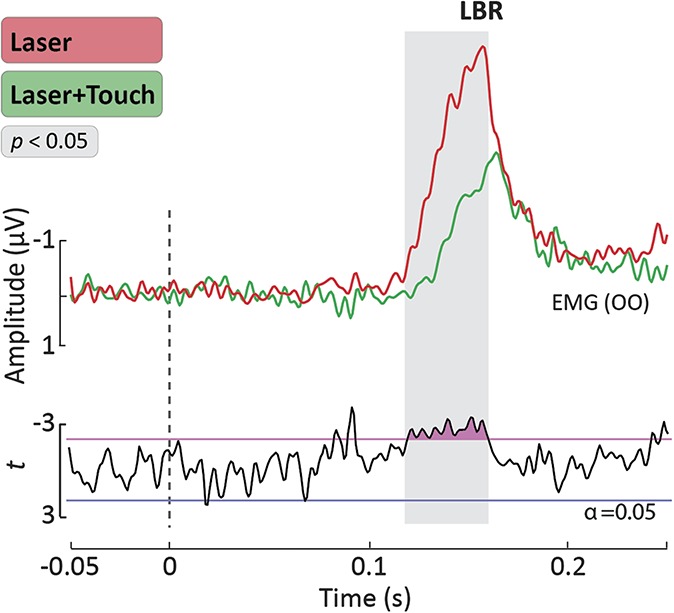
Laser Blink Reflex (LBR). Group-level average waveforms of the LBR elicited by laser stimulation of the hand. The EMG signals were recorded from the OO muscle ipsilateral to the stimulated hand, using surface electrodes. Point-by-point t values are displayed below the LBR waveforms. The time interval during which the LBR was significantly different in the “Laser” and “Laser + Touch” conditions is highlighted in gray. OO, orbicularis oculi.
4. Discussion
This study yielded 2 key findings: (1) the LBR, a marker of subcortical nociceptive processing at brainstem level, was clearly suppressed by concomitant touch and (2) the earliest cortical response to nociceptive input (ie, the Aδ-N1 wave), which reflects the first arrival of the ascending nociceptive input to the cortex, was also strongly suppressed. These findings indicate that touch inhibits a concomitant nociceptive input at subcortical level, in line with experimental findings in spinal animals.4,38 Our results do not exclude the possibility that supraspinal mechanisms contribute to touch-induced analgesia in humans. However, they provide evidence that supraspinal mechanisms alone do not mediate touch-induced analgesia, as a number of studies have previously suggested.19,46
4.1. Tactile modulation of pain perception
We all have experienced that touching a sore skin region or its surroundings relieves pain. Here, we provide a quantitative characterization of this phenomenon. Indeed, a brief stimulation of Aβ afferents significantly reduced the probability to detect a concurrent laser pulse (Fig. 2). Furthermore, when the laser pulse was detected, its intensity was perceived as lower, and its quality less frequently described as “pinprick” compared with when the laser pulse was delivered in isolation (Fig. 2).
Our results are consistent with several reports of pain relief as effect of other types of innocuous Aβ stimulation, including brushing, vibration, and transcutaneous electrical stimulation.19,22,23,34,46 These analgesic effects strongly depend on the relative spatial location of the tactile and nociceptive stimuli within the same dermatome. In general, the closer the Aβ and Aδ stimuli, the more powerful the analgesia.36
4.2. Tactile modulation of subcortical nociceptive responses
High-energy laser stimulation of intraepidermal free nerve endings elicits a clear blink reflex in the orbicularis oculi muscle (LBR; Fig. 5). The LBR is a well-characterized response: it is entirely mediated by a subcortical circuit at brain stem level31,39 and is a purely nociceptive reflex, as showed by its sensitivity to the opiate fentanyl.49
We recorded a clear LBR and observed that it was inhibited by concomitant Aβ input (Fig. 5). This finding is important, as the LBR circuitry is engaged well before the nociceptive input reaches its cortical targets. Therefore, the notion that supraspinal mechanisms entirely mediate touch-induced analgesia19,46 seems unlikely. Instead, our findings indicate that touch-induced analgesia is most likely consequent to a subcortical gating of the ascending nociceptive input, which in turn results in a modulation of higher-level cortical responses. This is in line with previous evidence of spinal gating of nociceptive inputs by concomitant tactile stimulation, such as the inhibition of the spinal withdrawal reflex (RIII) by transcutaneous electrical nerve stimulation.8,14
4.3. Tactile modulation of cortical responses elicited by nociceptive input
Laser-generated radiant heat pulses selectively activate both Aδ- and C-fiber free nerve endings in the epidermis.6,7,15 However, because of the different conduction velocity of thinly myelinated Aδ fibers and unmyelinated C fibers, laser pulses elicit a typical double sensation: an initial Aδ-fiber-related pricking pain is followed by a C-fiber-related burning pain.32
Laser-evoked potentials show clear components at latencies compatible with the conduction velocity of Aδ fibers.6 The components reflecting the later arrival of the C-fiber input to the cortex33,45 are much more difficult to detect because of the lower saliency content of the C-fiber sensation after the Aδ-fiber sensation. For this reason, C-LEPs have been initially suggested to be only detectable when the concomitant activation of Aδ fibers was avoided or reduced.41,45 However, it has been recently shown that when (1) laser pulses are delivered within a small skin territory and (2) LEP peaks are aligned in the time domain, C-LEPs can be clearly detected even when preceded by an Aδ-LEP.15 Indeed, given the slow and variable conduction velocity of C fibers,55 changes of just 1 cm in their length result in latency shifts of ∼10 milliseconds.15 Traditionally, LEPs are recorded by randomly shifting the laser beam within a large area (eg, 5 × 5 cm2) of the hand or foot dorsum, a procedure that would introduce a significant jitter in arrival time at the cortex. In contrast, when laser pulses are delivered to a small transversal area on the hand dorsum, the conduction distance to the cortex is held constant; hence, the latency jitter of the C-LEP response is dramatically reduced, enhancing C-LEP detectability.
Here, we used exactly this approach to dissect the modulatory effect of touch on the cortical responses elicited by Aδ- and C-fiber stimulation. We found that the amplitude of nearly all components of both Aδ-LEPs and C-LEPs was suppressed by Aβ input. Importantly, tactile input strongly reduced the magnitude of the earliest cortical component of Aδ-LEPs, the Aδ-N1 wave, which reflects the arrival of the ascending nociceptive input to the cortex. Indeed, the modulatory effect of Aβ on the Aδ-LEP waveform started as early as 125 milliseconds poststimulus and was maximal over the central–parietal electrodes contralateral to the stimulated side (Fig. 3).57 The Aδ-N1 is generated in the primary somatosensory cortex,12,13,54,58 and its amplitude is strongly related to the magnitude of the incoming nociceptive input.26 The observation that the LEP components reflecting the first arrival of the nociceptive input to the cortex are already inhibited by concomitant Aβ stimulation is consistent with the view that touch-induced analgesia is mediated by a gating of the nociceptive afferent input at subcortical level.
Furthermore, we found that the peak latency of the first 2 Aδ-LEP components (the Aδ-N1 and Aδ-N2 waves) was increased in the L + T relative to the L condition, whereas that of the late components was not. This observation is also important, as selective modulation of the latency of early components of the evoked potential is more likely to reflect modulation of the physiological properties of the incoming nociceptive volley.18
The biphasic vertex potential (Aδ-N2 and Aδ-P2 waves) following the Aδ-N1 wave was also modulated by Aβ input. In contrast to the Aδ-N1, the Aδ N2–P2 complex reflects multimodal neural activities43 and is thought to be contributed by neural activity arising from the bilateral operculoinsular and anterior cingulate cortices.13,29,30 The inhibition of the Aδ N2–P2 complex by concomitant Aβ stimulation is consistent with previous reports19,23,25,44 and is also parsimoniously explained by a subcortical gating of the afferent nociceptive input.
Furthermore, the late Aδ-P4 wave was also inhibited by concomitant Aβ stimulation (Fig. 3). The Aδ-P4 is a positive wave appearing at the latest part of the Aδ-LEP waveform. Scalp topography, functional microstate, and source analysis indicate that the Aδ-P4 is a functionally independent LEP component, reflecting a late somatotopically organised activation of the primary sensorimotor cortex.16 Interestingly, both the latency and amplitude variability of the Aδ-P4 wave are strongly coupled to those of the Aδ-N1 wave on a trial-by-trial basis but not to those of the Aδ-N2/P2 waves—a result suggesting that the Aδ-N1/P4 components are generated in parallel to the Aδ-N2/P2 components.16 Indeed, these waves can be independently modulated, eg, by cognitive factors such as spatial attention.27,28 Thus, the present evidence that Aβ input suppresses both early and late Aδ-LEP components further indicates that touch-induced analgesia is mediated by bottom-up, rather than top–down inhibition.
The cortical response evoked by C-fiber input was also suppressed by tactile stimulation (Fig. 4). This observation demonstrates that Aβ input inhibits the afferent volley ascending within both the Aδ and C pathways. No previous work explored the effect of touch on C-LEPs. One study attempted to evaluate the specific effect of Aβ stimulation on C-fiber function, by inducing an ischemic block of myelinated afferents and showed no significant modulation of C-evoked pain.48 This negative result is likely explained by the long distance between the Aβ- and C-fiber stimuli, which were delivered on the shoulder and on the forearm, respectively. Indeed, as we have already discussed, touch–pain interactions are strongly dependent on the spatial proximity between tactile and nociceptive stimuli.36,51
Evidence of tactile modulation of C-fiber activity is clinically relevant because C fibers drive central sensitization,59 which underlies several clinical pain conditions.20 Indeed, transcutaneous electrical nerve stimulation has been demonstrated to be effective in temporarily relieving hyperalgesia in musculoskeletal and postoperative pain.2,21 The present evidence of tactile gating of C-fiber responses may provide a neurophysiologic substrate for these clinical observations.
Conflict of interest statement
The authors have no conflicts of interest to declare.
Acknowledgements
F. Mancini, P. Haggard, and G. D. Iannetti were supported by a Wellcome Trust Project Grant (094863/Z/10/Z). F. Mancini and G. D. Iannetti are also supported by a Wellcome Trust strategic award (COLL JLARAXR). P. Haggard is additionally supported by an ESRC Professorial Fellowship (ES/J023140/1) and by EU project VERE WP1 (257695). A.-L. Beaumont was supported by a studentship from the Fondation Bettencourt Schueller. L. Hu is supported by the National Natural Science Foundation of China (31200856 and 31471082).
Author contributions: F. Mancini and A.-L. Beaumont contributed equally to this work.
Footnotes
Sponsorships or competing interests that may be relevant to content are disclosed at the end of this article.
References
- [1].Beissner F, Brandau A, Henke C, Felden L, Baumgärtner U, Treede R-D, Oertel BG, Lötsch J. Quick discrimination of A(delta) and C fiber mediated pain based on three verbal descriptors. PLoS One 2010;5:e12944. [DOI] [PMC free article] [PubMed] [Google Scholar]
- [2].Bjordal JM, Johnson MI, Ljunggreen AE. Transcutaneous electrical nerve stimulation (TENS) can reduce postoperative analgesic consumption. A meta-analysis with assessment of optimal treatment parameters for postoperative pain. Eur J Pain 2003;7:181–8. [DOI] [PubMed] [Google Scholar]
- [3].Bragard D, Chen AC, Plaghki L. Direct isolation of ultra-late (C-fibre) evoked brain potentials by CO2 laser stimulation of tiny cutaneous surface areas in man. Neurosci Lett 1996;209:81–4. [DOI] [PubMed] [Google Scholar]
- [4].Braz J, Solorzano C, Wang X, Basbaum AI. Transmitting pain and itch messages: a contemporary view of the spinal cord circuits that generate gate control. Neuron 2014;82:522–36. [DOI] [PMC free article] [PubMed] [Google Scholar]
- [5].Bromm B, Jahnke MT, Treede RD. Responses of human cutaneous afferents to CO2 laser stimuli causing pain. Exp Brain Res 1984;55:158–66. [DOI] [PubMed] [Google Scholar]
- [6].Bromm B, Treede RD. Nerve fibre discharges, cerebral potentials and sensations induced by CO2 laser stimulation. Hum Neurobiol 1984;3:33–40. [PubMed] [Google Scholar]
- [7].Bromm B, Treede RD. Human cerebral potentials evoked by CO2 laser stimuli causing pain. Exp Brain Res 1987;67:153–62. [DOI] [PubMed] [Google Scholar]
- [8].Chan CW, Tsang H. Inhibition of the human flexion reflex by low intensity, high frequency transcutaneous electrical nerve stimulation (TENS) has a gradual onset and offset. PAIN 1987;28:239–53. [DOI] [PubMed] [Google Scholar]
- [9].Churyukanov M, Plaghki L, Legrain V, Mouraux A. Thermal detection thresholds of Adelta- and C-fibre afferents activated by brief CO2 laser pulses applied onto the human hairy skin. PLoS One 2012;7:e35817. [DOI] [PMC free article] [PubMed] [Google Scholar]
- [10].Craig AD. A rat is not a monkey is not a human: comment on Mogil (Nature Rev. Neurosci. 10, 283-294 (2009)). Nat Rev Neurosci 2009;10:466. [DOI] [PubMed] [Google Scholar]
- [11].Delorme A, Makeig S. EEGLAB: an open source toolbox for analysis of single-trial EEG dynamics including independent component analysis. J Neurosci Methods 2004;134:9–21. [DOI] [PubMed] [Google Scholar]
- [12].Frot M, Magnin M, Mauguiere F, Garcia-Larrea L. Human SII and posterior insula differently encode thermal laser stimuli. Cereb Cortex 2007;17:610–20. [DOI] [PubMed] [Google Scholar]
- [13].Garcia-Larrea L, Frot M, Valeriani M. Brain generators of laser-evoked potentials: from dipoles to functional significance. Neurophysiol Clin 2003;33:279–92. [DOI] [PubMed] [Google Scholar]
- [14].Garcia-Larrea L, Sindou M, Mauguiere F. Nociceptive flexion reflexes during analgesic neurostimulation in man. PAIN 1989;39:145–56. [DOI] [PubMed] [Google Scholar]
- [15].Hu L, Cai MM, Xiao P, Luo F, Iannetti GD. Human brain responses to concomitant stimulation of A delta and C nociceptors. J Neurosci 2014;34:11439–51. [DOI] [PMC free article] [PubMed] [Google Scholar]
- [16].Hu L, Valentini E, Zhang ZG, Liang M, Iannetti GD. The primary somatosensory cortex contributes to the latest part of the cortical response elicited by nociceptive somatosensory stimuli in humans. Neuroimage 2014;84:383–93. [DOI] [PubMed] [Google Scholar]
- [17].Hu L, Xiao P, Zhang ZG, Mouraux A, Iannetti GD. Single-trial time-frequency analysis of electrocortical signals: baseline correction and beyond. Neuroimage 2014;84:876–87. [DOI] [PubMed] [Google Scholar]
- [18].Iannetti GD, Leandri M, Truini A, Zambreanu L, Cruccu G, Tracey I. A delta nociceptor response to laser stimuli: selective effect of stimulus duration on skin temperature, brain potentials and pain perception. Clin Neurophysiol 2004;115:2629–37. [DOI] [PubMed] [Google Scholar]
- [19].Inui K, Tsuji T, Kakigi R. Temporal analysis of cortical mechanisms for pain relief by tactile stimuli in humans. Cereb Cortex 2006;16:355–65. [DOI] [PubMed] [Google Scholar]
- [20].Jensen TS, Baron R, Haanpaa M, Kalso E, Loeser JD, Rice AS, Treede RD. A new definition of neuropathic pain. PAIN 2011;152:2204–5. [DOI] [PubMed] [Google Scholar]
- [21].Johnson M, Martinson M. Efficacy of electrical nerve stimulation for chronic musculoskeletal pain: a meta-analysis of randomized controlled trials. PAIN 2007;130:157–65. [DOI] [PubMed] [Google Scholar]
- [22].Kakigi R, Shibasaki H. Mechanisms of pain relief by vibration and movement. J Neurol Neurosurg Psychiatry 1992;55:282–6. [DOI] [PMC free article] [PubMed] [Google Scholar]
- [23].Kakigi R, Watanabe S. Pain relief by various kinds of interference stimulation applied to the peripheral skin in humans: pain-related brain potentials following CO2 laser stimulation. J Peripher Nerv Syst 1996;1:189–98. [PubMed] [Google Scholar]
- [24].Kakuda N. Conduction velocity of low-threshold mechanoreceptive afferent fibers in the glabrous and hairy skin of human hands measured with microneurography and spike-triggered averaging. Neurosci Res 1992;15:179–88. [DOI] [PubMed] [Google Scholar]
- [25].Krabbenbos IP, Brandsma D, van Swol CF, Boezeman EH, Tromp SC, Nijhuis HJ, van Dongen EP. Inhibition of cortical laser-evoked potentials by transcutaneous electrical nerve stimulation. Neuromodulation 2009;12:141–5. [DOI] [PubMed] [Google Scholar]
- [26].Lee MC, Mouraux A, Iannetti GD. Characterizing the cortical activity through which pain emerges from nociception. J Neurosci 2009;29:7909–16. [DOI] [PMC free article] [PubMed] [Google Scholar]
- [27].Legrain V, Guerit JM, Bruyer R, Plaghki L. Attentional modulation of the nociceptive processing into the human brain: selective spatial attention, probability of stimulus occurrence, and target detection effects on laser evoked potentials. PAIN 2002;99:21–39. [DOI] [PubMed] [Google Scholar]
- [28].Legrain V, Mancini F, Sambo CF, Torta DM, Ronga I, Valentini E. Cognitive aspects of nociception and pain. Bridging neurophysiology with cognitive psychology. Neurophysiol Clin 2012;42:325–36. [DOI] [PubMed] [Google Scholar]
- [29].Lenz FA, Rios M, Chau D, Krauss GL, Zirh TA, Lesser RP. Painful stimuli evoke potentials recorded from the parasylvian cortex in humans. J Neurophysiol 1998;80:2077–88. [DOI] [PubMed] [Google Scholar]
- [30].Lenz FA, Rios M, Zirh A, Chau D, Krauss G, Lesser RP. Painful stimuli evoke potentials recorded over the human anterior cingulate gyrus. J Neurophysiol 1998;79:2231–4. [DOI] [PubMed] [Google Scholar]
- [31].Leon L, Casanova-Molla J, Lauria G, Valls-Sole J. The somatosensory blink reflex in upper and lower brainstem lesions. Muscle Nerve 2011;43:196–202. [DOI] [PubMed] [Google Scholar]
- [32].Lewis T, Ponchin E. The double pain response of the human skin to a single stimulus. Clin Sci 1937;3:67–76. [Google Scholar]
- [33].Magerl W, Ali Z, Ellrich J, Meyer RA, Treede RD. C- and A delta-fiber components of heat-evoked cerebral potentials in healthy human subjects. PAIN 1999;82:127–37. [DOI] [PubMed] [Google Scholar]
- [34].Malow RM, Dougher MJ. A signal detection analysis of the effects of transcutaneous stimulation on pain. Psychosom Med 1979;41:101–8. [DOI] [PubMed] [Google Scholar]
- [35].Mancini F, Bauleo A, Cole J, Lui F, Porro CA, Haggard P, Iannetti GD. Whole-body mapping of spatial acuity for pain and touch. Ann Neurol 2014;75:917–24. [DOI] [PMC free article] [PubMed] [Google Scholar]
- [36].Mancini F, Nash T, Iannetti GD, Haggard P. Pain relief by touch: a quantitative approach. PAIN 2014;155:635–42. [DOI] [PMC free article] [PubMed] [Google Scholar]
- [37].Maris E, Oostenveld R. Nonparametric statistical testing of EEG- and MEG-data. J Neurosci Methods 2007;164:177–90. [DOI] [PubMed] [Google Scholar]
- [38].Mendell LM. Constructing and deconstructing the gate theory of pain. PAIN 2014;155:210–16. [DOI] [PMC free article] [PubMed] [Google Scholar]
- [39].Miwa H, Yamaji Y, Abe H, Mizuno Y. Evaluation of the somatosensory evoked blink response in patients with neurological disorders. J Neurol Neurosurg Psychiatry 1996;60:539–43. [DOI] [PMC free article] [PubMed] [Google Scholar]
- [40].Mogil JS. Animal models of pain: progress and challenges. Nat Rev Neurosci 2009;10:283–94. [DOI] [PubMed] [Google Scholar]
- [41].Mouraux A, Guerit JM, Plaghki L. Non-phase locked electroencephalogram (EEG) responses to CO2 laser skin stimulations may reflect central interactions between A partial partial differential- and C-fibre afferent volleys. Clin Neurophysiol 2003;114:710–22. [DOI] [PubMed] [Google Scholar]
- [42].Mouraux A, Iannetti GD. Across-trial averaging of event-related EEG responses and beyond. Magn Reson Imaging 2008;26:1041–54. [DOI] [PubMed] [Google Scholar]
- [43].Mouraux A, Iannetti GD. Nociceptive laser-evoked brain potentials do not reflect nociceptive-specific neural activity. J Neurophysiol 2009;101:3258–69. [DOI] [PubMed] [Google Scholar]
- [44].Mouraux A, Plaghki L. Cortical interactions and integration of nociceptive and non-nociceptive somatosensory inputs in humans. Neuroscience 2007;150:72–81. [DOI] [PubMed] [Google Scholar]
- [45].Nahra H, Plaghki L. The effects of A-fiber pressure block on perception and neurophysiological correlates of brief non-painful and painful CO2 laser stimuli in humans. Eur J Pain 2003;7:189–99. [DOI] [PubMed] [Google Scholar]
- [46].Nahra H, Plaghki L. Modulation of perception and neurophysiological correlates of brief CO2 laser stimuli in humans using concurrent large fiber stimulation. Somatosens Mot Res 2003;20:139–47. [DOI] [PubMed] [Google Scholar]
- [47].Naka D, Kakigi R. Simple and novel method for measuring conduction velocity of A delta fibers in humans. J Clin Neurophysiol 1998;15:150–3. [DOI] [PubMed] [Google Scholar]
- [48].Nathan PW, Rudge P. Testing the gate-control theory of pain in man. J Neurol Neurosurg Psychiatry 1974;37:1366–72. [DOI] [PMC free article] [PubMed] [Google Scholar]
- [49].Romaniello A, Valls-Sole J, Iannetti GD, Truini A, Manfredi M, Cruccu G. Nociceptive quality of the laser-evoked blink reflex in humans. J Neurophysiol 2002;87:1386–94. [DOI] [PubMed] [Google Scholar]
- [50].Salter MW, Henry JL. Differential responses of nociceptive vs. non-nociceptive spinal dorsal horn neurones to cutaneously applied vibration in the cat. PAIN 1990;40:311–22. [DOI] [PubMed] [Google Scholar]
- [51].Salter MW, Henry JL. Physiological characteristics of responses of wide dynamic range spinal neurones to cutaneously applied vibration in the cat. Brain Res 1990;507:69–84. [DOI] [PubMed] [Google Scholar]
- [52].Sambo CF, Forster B, Williams SC, Iannetti GD. To blink or not to blink: fine cognitive tuning of the defensive peripersonal space. J Neurosci 2012;32:12921–7. [DOI] [PMC free article] [PubMed] [Google Scholar]
- [53].Sikandar S, Ronga I, Iannetti GD, Dickenson AH. Neural coding of nociceptive stimuli-from rat spinal neurones to human perception. PAIN 2013;154:1263–73. [DOI] [PubMed] [Google Scholar]
- [54].Spiegel J, Hansen C, Treede RD. Laser-evoked potentials after painful hand and foot stimulation in humans: evidence for generation of the middle-latency component in the secondary somatosensory cortex. Neurosci Lett 1996;216:179–82. [DOI] [PubMed] [Google Scholar]
- [55].Torebjork HE, Hallin RG. Identification of afferent C units in intact human skin nerves. Brain Res 1974;67:387–403. [DOI] [PubMed] [Google Scholar]
- [56].Treede RD. Transduction and transmission properties of primary nociceptive afferents. Ross Fiziol Zh Im I M Sechenova 1999;85:205–11. [PubMed] [Google Scholar]
- [57].Treede RD, Kief S, Holzer T, Bromm B. Late somatosensory evoked cerebral potentials in response to cutaneous heat stimuli. Electroencephalogr Clin Neurophysiol 1988;70:429–41. [DOI] [PubMed] [Google Scholar]
- [58].Valentini E, Hu L, Chakrabarti B, Hu Y, Aglioti SM, Iannetti GD. The primary somatosensory cortex largely contributes to the early part of the cortical response elicited by nociceptive stimuli. Neuroimage 2012;59:1571–81. [DOI] [PubMed] [Google Scholar]
- [59].Woolf CJ. Central sensitization: implications for the diagnosis and treatment of pain. PAIN 2011;152(3 suppl):S2–15. [DOI] [PMC free article] [PubMed] [Google Scholar]