

Abstract
Background
Cardiovascular research output and citations of publications from Africa have historically been low yet may be increasing. However, data from the continent are limited.
Methods and Results
To evaluate the cardiovascular research output and citations from 52 African countries between 1999 and 2008, we created a bibliometric filter to capture cardiovascular research articles published in the Web of Knowledge based on specialist journals and title words. Two coauthors with expertise in cardiovascular medicine tested and refined this filter to achieve >90% precision and recall. We matched retrieved records with their associated citation reports and calculated the running 5‐year citation count postpublication, including the year of publication. Publications from Africa were identified by author addresses. South Africa published 872 cardiovascular research papers, Egypt 393, Tunisia 264, and Nigeria 192 between 1999 and 2008. The number of publications increased over the time period for a small number of countries (range 0.1 to 4.8 more publications per year by fractional count). Most countries' citations were low (<50), but citations were greatest for South Africa (7063), Egypt (2557), Tunisia (903), and Nigeria (540). The same countries had the greatest annual increase in 5‐year citation index values: 65 (95% CI: 30, 99) for South Africa, 46 (34, 58) for Egypt, 22 (15, 28) for Tunisia, and 8 (2, 14) for Nigeria. The burden of cardiovascular disease had a weak and inconsistent relationship to cardiovascular publications (r2=0.07, P=0.05). Greater gross domestic product was associated with more cardiovascular publications in 2008 (r2=0.53, P<0.0001).
Conclusions
The increases in cardiovascular research outputs from Africa are concentrated in a few countries. The reasons for regional differences in research outputs require further investigation, particularly relative to competing disease burdens. Higher prioritization of cardiovascular research funding from African countries is warranted.
Keywords: cardiovascular diseases, publications, research, trends
Introduction
Cardiovascular disease (CVD) is the leading cause of death worldwide.1 Although communicable diseases such as HIV infection and malaria currently account for the majority of years of life lost in Africa,2 CVD is the leading cause of death among adults >30 years old, and the burden of CVDs is projected to double between 2005 and 2030.3–4 The CVD burden is already increasing rapidly in many African countries.5 There are health system challenges in Africa that hinder effective chronic CVD care.6 Research is an integral component of designing a systems response to the CVD epidemic,7 yet the health research necessary to guide effective policies for CVD prevention and treatment in Africa is lacking.8–10
Evaluating CVD research production over time is 1 mechanism to assess whether local research output matches the health needs of the population and ultimately leads to better patient outcomes. Bibliometrics is a research method to quantitatively evaluate scientific literature and measure trends in research output over time.11–12 The scope of prior bibliometric research in Africa has been limited to a few health disciplines and lacks country‐level comparisons or objective measures of influence in the literature.13–15 Much of this prior research analyzing research production has been country‐, hospital‐, or journal‐specific.16–18 Collaboration with foreign countries on research publications is also common in Africa and can lead to higher‐impact publications.16,19 In addition, limited resources and the burden of communicable diseases may lead to a false dichotomy between directing attention and resources to, for example, HIV and CVD.20 Our objective was to evaluate trends in cardiovascular research publications in Africa disaggregated by country from 1999 to 2008 and the relative importance of these publications as measured by average number of citations per paper. An additional aim was to compare cardiovascular research publications against measures of country‐level development and burdens of CVD and HIV.
Methods
Data Selection
We used a cardiovascular bibliometric filter with demonstrated >90% recall and precision to retrieve all biomedical publications, including articles, reviews, and conference proceedings, published between 1999 and 2008 from Thomson Reuters Web of Knowledge and an address‐based filter to identify biomedical research publications as previously described.12,21 We analyzed publications from African as well as non‐African countries. Precision represents the proportion of filter output considered to be cardiovascular research, while recall represents the proportion of known cardiovascular research that the filter identifies. Testing was undertaken and results were interpreted by 2 coauthors who are cardiovascular research specialists (G.S.B., M.D.H.). Testing included reviewing random samples of 400 titles of publications drawn from the filter output mixed with 100 titles of publications from cardiovascular departments. The tester was asked to decide whether titles represented cardiovascular research publications. Iterative amendments were made to the filter, which included inclusion or exclusion of keywords or headings based on the tester's responses. Full details of the bibliometric filter creation, testing, and application has been published.12
After removing duplicates, we merged this output with the corresponding citation report from the Web of Knowledge for each publication and calculated 5‐year citation count postpublication (total citations 5 years postpublication, including the year of publication) to provide comparable citation estimates over time through 2012. We included all unique records with matched citation counts and author addresses. For each publication, we determined authorship by country as both integer and fractional address counts from reported addresses. Integer counts assign an equal count of 1 to each country contributing to a publication, whereas fractional counts assign a weighted value summing to 1 based on the total number of addresses and proportion from each country. Fractional counts can be added over time and reflect better the relative contribution of countries. Neither integer nor fractional counts were weighted by author position, corresponding author, or reprint address.
Publication data were aggregated by year and country for total number of cardiovascular publications authored (by integer and fractional count), and total number of 5‐year citation counts attributable to included publications. Countries were classified by 2011 World Bank income group, and high‐income countries were additionally differentiated as members of the Organization for Economic Cooperation and Development (OECD) or non‐OECD members. A list of OECD member countries can be found at http://www.oecd.org/general/listofoecdmembercountries-ratificationoftheconventionontheoecd.htm. World Bank income groups include low‐income ($1045 or less), lower‐middle‐income ($1046 to $4125), upper‐middle‐income ($4126 to $12 745), and high‐income ($12 476 or more) economies based on per‐capita gross national income in 2013. Analyses of economic development included human development index and gross domestic product (GDP) per capita (available for years 2000 and 2008) from the World Bank. Deaths and disability‐adjusted life years (DALYs) from HIV and CVD were matched by country from the Global Burden of Disease (GBD) database (http://ghdx.healthmetricsandevaluation.org/global-burden-disease-study-2010-gbd-2010-data-downloads) and the World Health Organization (WHO) Health Statistics and Information Systems Programme (http://www.who.int/healthinfo/en/). DALYs from CVD indicate the sum of years of life lost due to premature death and years lived with disability from CVD. We used the Global Burden of Disease and WHO databases to estimate the percentage of all DALYS due to CVD in the top 15 countries in Africa in 2002, 2004, and 2010. We calculated the mean percentage of DALYS due to CVD by averaging the DALY figures from 2002, 2004, and 2010. We used the United Nations Millennium Development geographic classification system to classify countries according to regions within Africa (http://millenniumindicators.un.org/unsd/methods/m49/m49regin.htm).
Statistical Analysis
To provide comparable estimates and avoid overestimation of contributions, we conducted all analyses using fractional publication counts and further adjusted 5‐year citation counts by fractional counts. We determined annual changes in fractional cardiovascular publication output by country, region, and all of Africa using linear regression models with a baseline (year 0) of 1999. Models were replicated using 5‐year citation counts (adjusted for fractional contribution) to determine trends in citation indices. For comparison, models of fractional cardiovascular publications and adjusted 5‐year citation indices were also created by World Bank income group among countries outside of Africa. Coefficients from linear regression models are interpreted as annual change.
We created aggregated fractional publication counts by country from 1999 to 2008 to model the association of CVD and HIV mortality with cardiovascular research output. We explored the association through a univariable linear regression model of CVD mortality as an independent predictor of fractional publications. We additionally adjusted our univariable model for either HIV mortality as an independent predictor, or the ratio of CVD to HIV mortality. All statistical analyses were performed with SAS version 9.3 (SAS Institute, Cary, NC).
This study was exempted from ethics review by the Northwestern University Institutional Review Board.
Results
We retrieved a total of 456 120 publications from 1999 to 2008 from the Thomson Reuters Web of Knowledge as reported in a prior publication on global cardiovascular research output.12 After we removed duplicates and matched records with citation reports, we included 430 712 publications with complete information in the present analysis. Overall, the number of cardiovascular publications retrieved increased over time, from 37 849 publications in 1999 to 54 459 in 2008.
Figure 1 shows the trend in number of fractional cardiovascular publications globally from 1999 to 2008. Africa (n=52 countries) had more cardiovascular publications than other low‐income countries (n=9) (lower panel) but fewer than all other World Bank income groups in 1999 (upper panel). There was an increase in the number of publications from Africa, particularly after 2005. The estimated annual increase in the number of cardiovascular publications for Africa was 18 (95% CI: 7, 29), which was comparable to other high‐income non‐OECD countries (24 [95% CI: 17, 31]) and greater than other low‐income countries (1 [95% CI: 1, 2]). The annual increase in the number of cardiovascular publications for the rest of the world is shown in Table 1.
Figure 1.
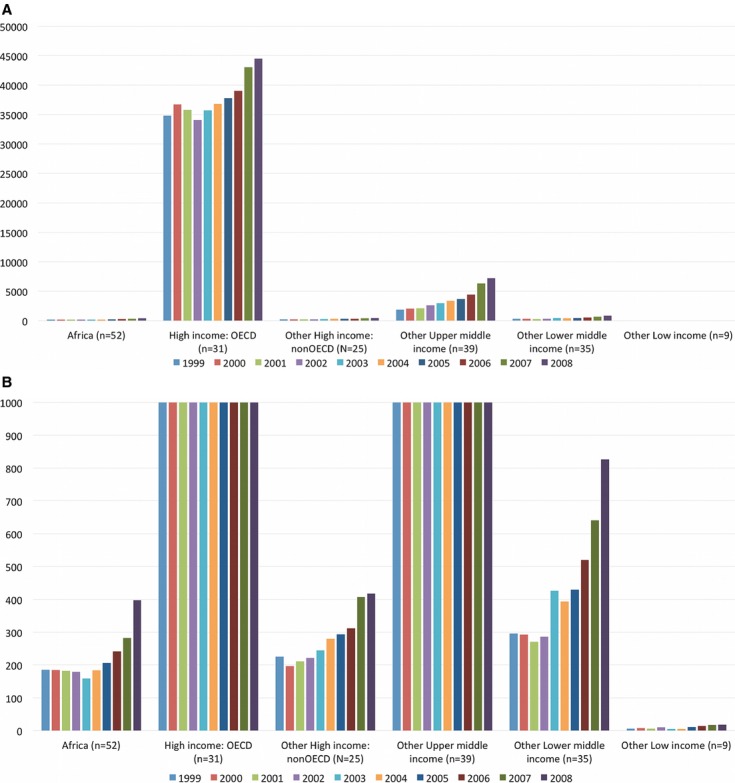
Trends in fractional cardiovascular publications by World Bank income group (1999–2008). Africa and world income groups' cardiovascular publications were retrieved from Thomson Reuters Web of Knowledge according to year. A, The upper panel displays the range of cardiovascular publications per year from zero to 50 000, which best displays the range of cardiovascular publications for high‐income Organization for Economic Cooperation and Development (OECD) and other upper‐middle‐income countries. B, The lower portion of the graph displays the range of cardiovascular publications from zero to 1000 per year, which displays the range of publications for Africa, other high‐income non‐OECD, other lower‐middle‐income, and other low‐income countries.
Table 1.
Linear Regression Models for Average Number of Cardiovascular Publications in 1999 and Annual Change in Fractional Cardiovascular Publications Between 1999 and 2008 From Africa and the Rest of the World
| Countries Group* | Cardiovascular Publications in 1999* | Annual Change in Cardiovascular Publication Production (%)* |
|---|---|---|
| Africa, n=52 | 139 (82, 196) | 18 (7, 29) |
| Countries outside of Africa | ||
| High‐income OECD, n=31 | 33 470 (31 259, 35 681) | 966 (552, 1380) |
| Other high‐income, Non‐OECD, n=25 | 173 (136, 210) | 24 (17, 31) |
| Other upper‐middle‐income, n=39 | 1129 (324, 1934) | 562 (411, 713) |
| Other lower‐middle‐income, n=35 | 196 (100, 292) | 54 (36, 72) |
| Other low‐income, n=9 | 4 (0, 8) | 1 (1, 2) |
OECD indicates Organization for Economic Cooperation and Development.
n represents the number of countries within each group.
Baseline year: 1999. Numbers presented are average number of cardiovascular publications with 95% CI.
Per‐year increment. Aggregated fractional cardiovascular publications in year i=cardiovascular publications in 1999+annual change in cardiovascular publications×(year i−1999).
Table 2 shows the trend in percentage of DALYs due to CVD for the top 15 countries in Africa (2002, 2004, and 2010) compared with the percentage of biomedical research related to CVD between 1999 and 2013. There was a slight increase in DALYs due to CVD over time for most countries. Northern African countries had the greatest DALYs due to CVD, with estimates in 2010 being >15% in Egypt and Tunisia. There was an inconsistent relationship between DALYs due to CVD and the percentage of biomedical research publications related to CVD. Côte d'Ivoire, Cameroon, and Senegal had a similar average number of DALYs due to CVD between 2002 and 2010 (4.0% or 4.1%), but the range of publications related to CVD was 1.8% to 5.2% among these countries between 1999 and 2008 (Table 2). In other cases (eg, Mozambique or Nigeria), the percentage of publications related to CVD was greater than the percentage of DALYs due to CVD, and this trend persisted from the periods 1999–2008 and 2009–2013.
Table 2.
Disability‐Adjusted Life Years and Percentage of Biomedical Research Publications Due to Cardiovascular Disease From the Top 15 Countries in Africa
| Country | Percentage of DALYs Due to CVD* | Mean Percentage of DALYs Due to CVD, 2002–2010* | Percentage of Biomedical Research Publications Due to CVD, 1999–2008 | Percentage of Biomedical Research Publications Due to CVD, 2009–2013 | ||
|---|---|---|---|---|---|---|
| 2002 | 2004 | 2010 | ||||
| Egypt | 16.1 | 17.1 | 24.5 | 19.2 | 6.4 | 7.9 |
| Tunisia | 15.4 | 12.0 | 18.2 | 15.2 | 7.3 | 6.6 |
| Morocco | 10.7 | 12.0 | 13.2 | 12.0 | 6.5 | 5.6 |
| Algeria | 7.2 | 8.7 | 13.4 | 9.8 | 6.2 | 6.3 |
| Ghana | 4.6 | 5.3 | 6.6 | 5.5 | 3.1 | 2.4 |
| South Africa | 4.7 | 5.8 | 5.6 | 5.3 | 6.1 | 5.4 |
| Côte d'Ivoire | 3.6 | 4.2 | 4.4 | 4.1 | 3.5 | 3.3 |
| Cameroon | 3.7 | 4.4 | 4.0 | 4.1 | 5.2 | 4.1 |
| Senegal | 3.9 | 5.2 | 3.0 | 4.0 | 1.8 | 4.8 |
| Zimbabwe | 2.1 | 2.7 | 5.4 | 3.4 | 1.7 | 1.6 |
| Ethiopia | 3.0 | 3.6 | 3.6 | 3.4 | 2.3 | 1.7 |
| Kenya | 3.2 | 3.0 | 3.2 | 3.1 | 1.0 | 1.7 |
| Nigeria | 3.1 | 3.8 | 2.5 | 3.1 | 4.4 | 5.0 |
| Tanzania | 2.6 | 3.9 | 2.5 | 3.0 | 1.6 | 1.7 |
| Mozambique | 2.1 | 3.5 | 2.3 | 2.7 | 6.0 | 7.3 |
The percentage of disability‐adjusted life years (DALYs) due to cardiovascular disease (CVD) measures the percentage of total years of life lost due to premature death and years lived with disability that were due to CVD in a given country.
Mean percentage of DALYs due to CVD is the average of the DALY figures from 2002, 2004, and 2010.
Table 3 shows the number of cardiovascular publications, 5‐year citation counts, and estimated annual change for 5 regions in Africa between 1999 and 2008. The Northern and Southern African regions had the greatest number of publications during this period (n=904 and n=877, respectively), which was mostly accounted for by South Africa (n=872), Egypt (n=393), Morocco (n=182), and Tunisia (n=264) (Table 4). The Northern, Southern, Western, Eastern, and Middle Africa regi‐ons accounted for 41%, 40%, 12%, 5%, and 3% of total cardio‐vascular publications during this time period, respectively. There were more than 5.4 million citations to cardiovascular publications from around the globe between 1999 and 2008. Of these, 13 112 citations (0.24%) were to publications from Africa. Northern and Southern Africa had the greatest increase in 5‐year citation index during this period (77 [95% CI: 57, 98] and 66 [95% CI: 31, 100], respectively), which were mostly accounted for by South Africa (65 [95% CI: 30, 99]), Egypt (46 [95% CI: 34, 58]), and Tunisia (22 [95% CI: 15, 28]).
Table 3.
Cardiovascular Research Publications*, 5‐Year Citation Count, and Estimated Annual Change From Regions in Africa* (1999–2008)
| Region | 1999 | 2000 | 2001 | 2002 | 2003 | 2004 | 2005 | 2006 | 2007 | 2008 | Annual Change |
|---|---|---|---|---|---|---|---|---|---|---|---|
| Number of cardiovascular research publications | |||||||||||
| Eastern Africa, n=17 | 14 | 12 | 7 | 7 | 5 | 10 | 14 | 9 | 9 | 15 | 0.1 (−0.6, 0.9) |
| Middle Africa, n=9 | 6 | 4 | 5 | 7 | 6 | 1 | 3 | 5 | 10 | 11 | 0.5 (−0.1, 1.1) |
| Northern Africa, n=6 | 54 | 53 | 70 | 73 | 65 | 83 | 77 | 101 | 146 | 183 | 12.1 (7.3, 17.0) |
| Southern Africa, n=5 | 94 | 96 | 87 | 77 | 64 | 69 | 88 | 91 | 84 | 128 | 1.7 (−2.2, 5.5) |
| Western Africa, n=15 | 18 | 21 | 14 | 16 | 18 | 21 | 25 | 34 | 32 | 61 | 3.6 (1.6, 5.6) |
| Africa, n=52 | 186 | 185 | 182 | 179 | 159 | 184 | 206 | 241 | 282 | 398 | 18.1 (7.4, 28.8) |
| 5‐year citation count | |||||||||||
| Eastern Africa, n=17 | 13 | 53 | 80 | 31 | 24 | 29 | 140 | 76 | 70 | 73 | 5.9 (−1.7, 13.4) |
| Middle Africa, n=9 | 35 | 6 | 25 | 18 | 15 | 27 | 18 | 27 | 145 | 57 | 7.2 (−0.6, 15.0) |
| Northern Africa, n=6 | 129 | 206 | 258 | 332 | 280 | 347 | 408 | 586 | 739 | 914 | 77.2 (56.7, 97.6) |
| Southern Africa, n=5 | 406 | 654 | 642 | 582 | 490 | 551 | 835 | 907 | 793 | 1263 | 65.6 (31.4, 99.9) |
| Western Africa, n=15 | 44 | 92 | 39 | 47 | 54 | 57 | 95 | 92 | 117 | 194 | 11.7 (4.6, 18.8) |
| Africa, n=52 | 628 | 1010 | 1043 | 1010 | 864 | 1010 | 1495 | 1687 | 1865 | 2500 | 167.6 (109.0, 226.1) |
Fractional counts.
Countries in each region are listed in Table 4.
Table 4.
Cardiovascular Research Publications and Annual Change From Countries in Africa (1999–2008)
| Region | Country | 1999 | 2000 | 2001 | 2002 | 2003 | 2004 | 2005 | 2006 | 2007 | 2008 | Annual Change |
|---|---|---|---|---|---|---|---|---|---|---|---|---|
| Eastern Africa | Burundi | 0 | 0 | 0 | 0 | 0 | 0 | 0 | 0 | 0 | 0 | 0 (0, 0) |
| Comoros | 0 | 0 | 0 | 0 | 0 | 0 | 0 | 0 | 0 | 0.1 | 0 (0, 0) | |
| Djibouti | 0 | 0 | 0.3 | 0 | 0 | 0 | 0 | 0.2 | 0 | 0 | 0 (0, 0) | |
| Eritrea | 0 | 0 | 0 | 1 | 0 | 0 | 1 | 1 | 0.3 | 0 | 0 (−0.1, 0.2) | |
| Ethiopia | 2.5 | 0.5 | 1.5 | 1.6 | 0.3 | 6.4 | 5 | 0.6 | 1.3 | 5.0 | 0.2 (−0.2, 0.7) | |
| Kenya | 5.4 | 3.1 | 1.4 | 0.7 | 0 | 0.4 | 0.9 | 0.1 | 2 | 2.1 | −0.3 (−0.6, 0.1) | |
| Madagascar | 0 | 0 | 0 | 0 | 0.5 | 0.3 | 0 | 0.4 | 0 | 1.3 | 0.1 (0, 0.2) | |
| Malawi | 0 | 0 | 0.2 | 0.3 | 0.3 | 0.6 | 2.6 | 0.3 | 0.7 | 1.4 | 0.2 (0, 0.3) | |
| Mauritius | 0 | 0.2 | 1.4 | 0 | 1 | 0 | 0 | 0 | 0 | 0.3 | 0 (−0.2, 0.1) | |
| Mozambique | 0.4 | 0 | 0 | 0.5 | 0.3 | 0 | 0.6 | 1.8 | 1.7 | 0.4 | 0.1 (0, 0.3) | |
| Rwanda | 0 | 0 | 0 | 0 | 0 | 0 | 0 | 0 | 0.3 | 0 | 0 (0, 0) | |
| Seychelles | 0.1 | 0.9 | 0 | 0.4 | 1 | 0.4 | 0.3 | 0.7 | 1.3 | 0.6 | 0.1 (0, 0.1) | |
| Somalia | 0 | 0 | 0 | 0 | 0 | 0 | 0 | 0 | 0 | 0 | 0 (0, 0) | |
| Tanzania | 3 | 2.5 | 1.8 | 0.5 | 0.4 | 1.6 | 0.1 | 2.3 | 0.2 | 1.0 | −0.2 (−0.4, 0) | |
| Uganda | 1.3 | 1 | 0 | 1 | 0.5 | 0 | 2.9 | 1 | 1 | 2.3 | 0.1 (−0.1, 0.3) | |
| Zambia | 0 | 0 | 0 | 1 | 0 | 0 | 0 | 0 | 0 | 0 | 0 (−0.1, 0.1) | |
| Zimbabwe | 1.4 | 3.5 | 0 | 0 | 1 | 0.1 | 0.3 | 0.7 | 0.2 | 0.1 | −0.2 (−0.4, 0) | |
| Region | 14.1 | 11.6 | 6.6 | 6.9 | 5.2 | 9.7 | 13.7 | 9.0 | 8.9 | 14.6 | 0.1 (−0.6, 0.9) | |
| Middle Africa | Angola | 0.3 | 0 | 0 | 0 | 0 | 0 | 0 | 0 | 0 | 0.5 | 0 (0, 0.1) |
| Cameroon | 2.3 | 1.8 | 3.9 | 5.4 | 4.4 | 1.3 | 2.9 | 4.8 | 8.0 | 7.1 | 0.5 (0.1, 0.9) | |
| Central Afr. Rep. | 0 | 0 | 0 | 0 | 0 | 0 | 0 | 0 | 0 | 0 | 0 (0, 0) | |
| Chad | 0 | 1 | 0 | 0 | 0 | 0 | 0 | 0.1 | 0 | 0 | 0 (−0.1, 0) | |
| Dem. Rep. of the Congo | 0 | 1 | 0 | 0 | 0 | 0 | 0.3 | 0 | 1 | 2.2 | 0.1 (0, 0.23) | |
| Equ. Guinea | 0 | 0 | 0 | 0 | 0 | 0 | 0 | 0 | 0 | 0 | 0 (0, 0) | |
| Gabon | 0.3 | 0 | 0 | 0 | 0.2 | 0 | 0 | 0.2 | 0.1 | 1.2 | 0.1 (0, 0.1) | |
| Rep. of Congo | 2.8 | 0 | 1 | 1.3 | 1 | 0 | 0 | 0.1 | 1.4 | 0.4 | 0 (−0.3, 0.1) | |
| Sao Tome & Principe | 0 | 0 | 0 | 0 | 0 | 0 | 0 | 0 | 0 | 0 | 0 (0, 0) | |
| Region | 5.6 | 3.8 | 4.9 | 6.7 | 5.6 | 1.3 | 3.2 | 5.2 | 10.4 | 11.3 | 0.5 (−0.1, 1.1) | |
| Northern Africa | Algeria | 1 | 0.2 | 3 | 1.7 | 5.8 | 2.8 | 4.9 | 3.5 | 9.6 | 11.2 | 1.0 (0.6, 1.5) |
| Egypt | 22.8 | 28.5 | 27.3 | 39.1 | 26.5 | 39.0 | 31.9 | 35.1 | 62.0 | 80.8 | 4.8 (2.2, 7.3) | |
| Libya | 1 | 1.5 | 0 | 0 | 0 | 0 | 0.2 | 1.5 | 4.2 | 3.5 | 0.3 (0, 0.6) | |
| Morocco | 17.1 | 13.2 | 17.1 | 22.4 | 16.5 | 12.2 | 10.2 | 20.0 | 22.7 | 31.7 | 1.0 (−0.2, 2.3) | |
| Sudan | 0.5 | 0 | 0 | 0 | 0 | 1 | 0.8 | 1 | 4.5 | 1.3 | 0.3 (0.1, 0.5) | |
| Tunisia | 11.6 | 9.3 | 22.2 | 9.7 | 16.3 | 28.2 | 28.8 | 40.3 | 43.5 | 54.1 | 4.7 (3.4, 6.1) | |
| Region | 54.0 | 52.6 | 69.6 | 72.8 | 65.0 | 83.1 | 76.7 | 101.4 | 146.4 | 182.7 | 12.1 (7.3, 17.0) | |
| Southern Africa | Botswana | 0 | 0 | 0.3 | 0 | 1 | 0 | 1.2 | 0.7 | 0 | 0.5 | 0.1 (0, 0.2) |
| Lesotho | 0 | 0 | 0 | 0 | 0 | 0 | 0 | 0 | 0 | 0.3 | 0 (0, 0) | |
| Namibia | 0.3 | 0 | 0 | 0 | 0 | 0 | 0 | 0.3 | 0 | 0 | 0 (0, 0) | |
| South Africa | 94.1 | 95.7 | 86.5 | 76.5 | 63.3 | 68.6 | 86.3 | 90.3 | 84.0 | 126.7 | 1.6 (−2.2, 5.4) | |
| Swaziland | 0 | 0 | 0 | 0 | 0 | 0 | 0 | 0 | 0 | 0.1 | 0 (0, 0) | |
| Region | 94.4 | 95.7 | 86.8 | 76.5 | 64.3 | 68.6 | 87.5 | 91.3 | 84.0 | 127.6 | 1.7 (−2.2, 5.5) | |
| Western Africa | Benin | 0 | 1.3 | 0 | 0.6 | 0 | 0 | 1 | 0 | 1 | 1.1 | 0.1 (−0.1, 0.2) |
| Burkina Faso | 0.4 | 2.5 | 0 | 3.4 | 0 | 0.8 | 0 | 0.1 | 1.4 | 0.2 | −0.1 (−0.4, 0.2) | |
| Gambia | 0 | 1.1 | 4 | 0 | 1 | 0.5 | 0.5 | 0 | 0.2 | 0.2 | −0.1 (−0.4, 0.1) | |
| Ghana | 1.1 | 3.1 | 0 | 0.2 | 2.1 | 1.2 | 2.2 | 2.1 | 1.7 | 1 | 0 (−0.2, 0.3) | |
| Guinea | 0 | 0 | 0 | 0 | 0 | 0 | 0 | 0 | 0 | 0 | 0 (0, 0) | |
| Guinea‐Bissau | 0 | 0 | 0 | 0 | 0 | 0 | 0 | 0 | 0.2 | 0 | 0 (0, 0) | |
| Ivory Coast | 1 | 1 | 2.3 | 0.5 | 2 | 0.5 | 2 | 0.6 | 3.3 | 4.5 | 0.3 (0, 0.5) | |
| Liberia | 0 | 0 | 0 | 0 | 0 | 0 | 0 | 0 | 0 | 0 | 0 (0, 0) | |
| Mali | 0 | 0.2 | 0 | 0 | 0.2 | 0 | 0 | 0 | 0.4 | 0 | 0 (0, 0) | |
| Mauritania | 0 | 0 | 0 | 0 | 0 | 0 | 0 | 0.2 | 0 | 0 | 0 (0, 0) | |
| Niger | 0 | 0 | 0 | 0 | 1.2 | 0 | 0 | 0 | 0 | 0 | −0.01 (−0.09, 0.08) | |
| Nigeria | 15.2 | 11.8 | 7 | 11.4 | 9.7 | 16.7 | 17.2 | 28.7 | 22.1 | 52.6 | 3.3 (1.3, 5.3) | |
| Senegal | 0 | 0.3 | 1 | 0 | 2.2 | 1.5 | 1.8 | 2.3 | 2.0 | 1.7 | 0.2 (0.1, 0.4) | |
| Sierra Leone | 0 | 0 | 0 | 0 | 0 | 0 | 0 | 0 | 0 | 0 | 0 (0, 0) | |
| Togo | 0 | 0 | 0 | 0 | 0 | 0 | 0 | 0 | 0 | 0.1 | 0 (0, 0) | |
| Region | 17.7 | 21.2 | 14.3 | 16.1 | 18.3 | 21.2 | 24.7 | 34.1 | 32.2 | 61.3 | 3.6 (1.6, 5.6) | |
| Africa | 185.8 | 185.0 | 182.1 | 178.9 | 158.6 | 183.9 | 205.8 | 240.8 | 282.0 | 397.5 | 18.1 (7.4, 28.8) | |
Figure 2 shows a heatmap of the total cardiovascular research output from Africa between 1999 and 2008 by country, where darker color corresponds to a greater number of publications. More than 80% of the publications from Africa during 1999 to 2008 were accounted for by South Africa, Egypt, Tunisia, Morocco, and Nigeria. Forty‐one countries (79%) had at least 1 year between 1999 and 2008 with zero cardiovascular publications. The number of publications increased over the time period by >1 fractional publication per year for a small number of countries (10 [12%]), but most countries' outputs were static and/or very small (Table 4). Most countries in Africa (87%, 45 of 52) had at least 1 year when the 5‐year citation index per cardiovascular publication was zero due to lack of or very few publications, and 12 (23%) had no citations within 5 years of publication in any year from 1999 to 2008 (Table 5). In 2008, there were 2500 citations to cardiovascular publications from Africa. More than 85% of these citations were of cardiovascular publications from South Africa (1261), Egypt (563), Tunisia (229), and Nigeria (148).
Figure 2.
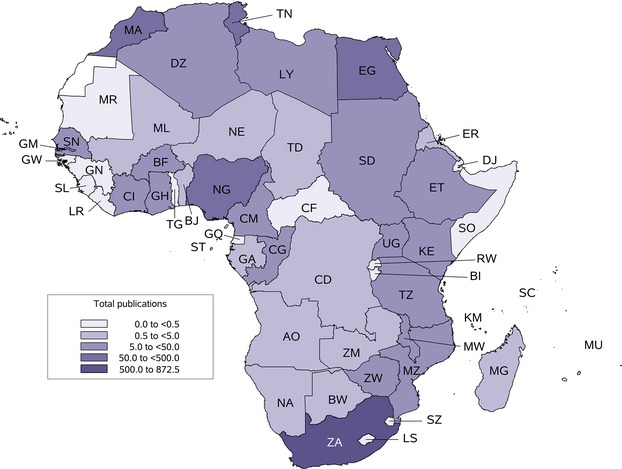
Heatmap of the number of cardiovascular publications from Africa by country (1999–2008). Total cardiovascular publications by fractional counts are displayed according to color intensity for 52 countries. The lightest shade represents 0.0 to <0.5 fractional count of cardiovascular publications from a country over the entire time period. Lighter shades successively represent 0.5 to <5.0, 5.0 to <50.0, 50.0 to <500.0, and 500.0 to 872.5 publications. Country abbreviations in alphabetical order are: AO indicates Angola; BF, Burkina Faso; BI, Burundi; BJ, Benin; BW, Botswana; CD, Democratic Republic of the Congo; CF, Central African Republic; CG, Republic of the Congo; CI, Côte D'Ivoire; CM, Cameroon; DJ, Djibouti; DZ, Algeria; EG, Egypt; ER, Eritrea; ET, Ethiopia; GA, Gabon; GH, Ghana; GM, Gambia; GN, Guinea; GQ, Equatorial Guinea; GW, Guinea‐Bissau; KE, Kenya; KM, Comoros; LR, Liberia; LS, Lesotho; LY, Libya; MA, Morocco; MG, Madagascar; ML, Mali; MR, Mauritania; MU, Mauritius; MW, Malawi; MZ, Mozambique; NA, Namibia; NG, Nigeria; RW; Rwanda; SC, Seychelles; SD, Sudan; SL, Sierra Leone; SN, Senegal; SO, Somalia; ST, Sao Tome and Principe; SZ, Swaziland; TD, Chad; TG, Togo; TN, Tunisia; TZ, Tanzania; UG, Uganda; ZA, South Africa; ZM, Zambia; ZW, Zimbabwe. No data were available for Western Sahara.
Table 5.
Five‐Year Citation Count and Annual Change From Countries in Africa (1999–2008)
| Region | Country | 1999 | 2000 | 2001 | 2002 | 2003 | 2004 | 2005 | 2006 | 2007 | 2008 | Annual Change |
|---|---|---|---|---|---|---|---|---|---|---|---|---|
| Eastern Africa | Burundi | 0 | 0 | 0 | 0 | 0 | 0 | 0 | 0 | 0 | 0 | 0 (0, 0) |
| Comoros | 0 | 0 | 0 | 0 | 0 | 0 | 0 | 0 | 0 | 0.7 | 0 (0, 0.1) | |
| Djibouti | 0 | 0 | 3.3 | 0 | 0 | 0 | 0 | 3 | 0 | 0 | 0 (−0.3, 0.3) | |
| Eritrea | 0 | 0 | 0 | 0 | 0 | 0 | 3 | 9 | 0 | 0 | 0.3 (−0.3, 1.0) | |
| Ethiopia | 2.5 | 0.5 | 2.8 | 1.1 | 0 | 9.5 | 16 | 4.5 | 10.3 | 7.8 | 1.1 (0.2, 2.0) | |
| Kenya | 4.9 | 0.3 | 22.1 | 19.3 | 0 | 0.7 | 49.9 | 0 | 11 | 12.6 | 0.8 (−2.8, 4.3) | |
| Madagascar | 0 | 0 | 0 | 0 | 1 | 1.8 | 0 | 1.7 | 0 | 1 | 0.1 (0, 0.3) | |
| Malawi | 0 | 0 | 0.6 | 0.3 | 12.5 | 0.3 | 3.2 | 6.8 | 6.6 | 11.0 | 1.0 (0.2, 1.9) | |
| Mauritius | 0 | 4 | 46.4 | 0 | 0 | 0 | 0 | 0 | 0 | 2.5 | −1.4 (−4.6, 1.7) | |
| Mozambique | 0.5 | 0 | 0 | 0 | 0.3 | 0 | 17.1 | 5.3 | 16.5 | 8.1 | 1.6 (0.5, 2.7) | |
| Rwanda | 0 | 0 | 0 | 0 | 0 | 0 | 0 | 0 | 5.3 | 0 | 0.2 (−0.1, 0.6) | |
| Seychelles | 1.7 | 2.8 | 0 | 3.5 | 0 | 5.2 | 4.6 | 25.3 | 16.3 | 5.6 | 1.6 (0.1, 3.1) | |
| Somalia | 0 | 0 | 0 | 0 | 0 | 0 | 0 | 0 | 0 | 0 | 0 (0, 0) | |
| Tanzania | 1 | 25.8 | 4.4 | 6.7 | 4.1 | 11 | 1.4 | 13.8 | 0.2 | 7.4 | −0.5 (−2.2, 1.2) | |
| Uganda | 1.7 | 3 | 0 | 0 | 5.5 | 0 | 42 | 2 | 3 | 6 | 1.0 (−1.8, 3.9) | |
| Zambia | 0 | 0 | 0 | 0 | 0 | 0 | 0 | 0 | 0 | 0 | 0 (0, 0) | |
| Zimbabwe | 0.9 | 16.9 | 0 | 0 | 1 | 0.3 | 3 | 4.2 | 0.6 | 10.4 | 0 (−1.3, 1.3) | |
| Region | 13.1 | 53.2 | 79.5 | 30.8 | 24.4 | 28.7 | 140.2 | 75.6 | 69.9 | 73.1 | 5.9 (−1.7, 13.4) | |
| Middle Africa | Angola | 2.5 | 0 | 0 | 0 | 0 | 0 | 0 | 0 | 0 | 2 | 0 (−0.3, 0.2) |
| Cameroon | 7.8 | 3.2 | 24.8 | 16.0 | 13.8 | 26.5 | 16.9 | 26.8 | 110.1 | 36.3 | 6.2 (0.8, 11.7) | |
| Central Afr. Rep. | 0 | 0 | 0 | 0 | 0 | 0 | 0 | 0 | 0 | 0 | 0 (0, 0) | |
| Chad | 0 | 0 | 0 | 0 | 0 | 0 | 0 | 0 | 0 | 0 | 0 (0, 0) | |
| Dem. Rep. of the Congo | 0 | 3 | 0 | 0 | 0 | 0 | 1 | 0 | 7 | 12.8 | 0.9 (0.1, 1.7) | |
| Equ. Guinea | 0 | 0 | 0 | 0 | 0 | 0 | 0 | 0 | 0 | 0 | 0 (0, 0) | |
| Gabon | 19.7 | 0 | 0 | 0 | 1.6 | 0 | 0 | 0 | 2.2 | 4.1 | −0.8 (−2.1, 0.5) | |
| Rep. of Congo | 5.5 | 0 | 0 | 1.5 | 0 | 0 | 0 | 0 | 26 | 1.5 | 0.9 (−0.9, 2.6) | |
| Sao Tome & Principe | 0 | 0 | 0 | 0 | 0 | 0 | 0 | 0 | 0 | 0 | 0 (0, 0) | |
| Region | 35.5 | 6.2 | 24.8 | 17.5 | 15.4 | 26.5 | 17.9 | 26.8 | 145.3 | 56.7 | 7.2 (−0.6, 15.0) | |
| Northern Africa | Algeria | 0 | 2.6 | 17 | 6.2 | 29.4 | 5.6 | 20.6 | 12.2 | 43.1 | 34.5 | 3.6 (1.3, 5.8) |
| Egypt | 77.7 | 141.4 | 112.5 | 224.4 | 180.8 | 238.8 | 245.2 | 367.6 | 406.0 | 563.1 | 46.2 (33.9, 58.5) | |
| Libya | 3 | 0.5 | 0 | 0 | 0 | 0 | 1.6 | 4.6 | 13.2 | 1.5 | 0.6 (−0.2, 1.5) | |
| Morocco | 15.7 | 51.3 | 66.2 | 60.1 | 39.9 | 27.7 | 18.2 | 70.5 | 93.5 | 84.4 | 4.8 (−0.4, 10.0) | |
| Sudan | 0 | 0 | 0 | 0 | 0 | 3 | 1.7 | 2 | 7.12 | 1 | 0.5 (0.1, 0.9) | |
| Tunisia | 32.4 | 10.0 | 61.9 | 41.5 | 30.4 | 72 | 120.3 | 128.7 | 176.4 | 229.3 | 21.5 (14.8, 28.3) | |
| Region | 128.8 | 205.8 | 257.6 | 332.2 | 280.5 | 347.1 | 407.5 | 585.7 | 739.3 | 913.8 | 77.2 (56.7, 97.6) | |
| Southern Africa | Botswana | 0 | 0 | 0.3 | 0 | 6 | 0 | 46.7 | 0.7 | 0 | 0 | 0.8 (−2.5, 4.1) |
| Lesotho | 0 | 0 | 0 | 0 | 0 | 0 | 0 | 0 | 0 | 0 | 0 (0, 0) | |
| Namibia | 2.3 | 0 | 0 | 0 | 0 | 0 | 0 | 1 | 0 | 0 | −0.1 (−0.3, 0.1) | |
| South Africa | 403.8 | 653.6 | 641.9 | 581.9 | 484.1 | 550.6 | 787.8 | 905.5 | 792.8 | 1260.7 | 64.8 (30.5, 99.1) | |
| Swaziland | 0 | 0 | 0 | 0 | 0 | 0 | 0 | 0 | 0 | 2.11 | 0.1 (0, 0.3) | |
| Region | 406.0 | 653.6 | 642.2 | 581.9 | 490.1 | 550.6 | 834.5 | 907.2 | 792.8 | 1262.8 | 65.6 (31.4, 99.9) | |
| Western Africa | Benin | 0 | 2.5 | 0 | 1 | 0 | 0 | 0 | 0 | 0 | 16.7 | 0.8 (−0.3, 1.9) |
| Burkina Faso | 1.2 | 4.5 | 0 | 4.3 | 0 | 0.7 | 0 | 0 | 16.9 | 0.4 | 0.4 (−0.8, 1.6) | |
| Gambia | 0 | 4.3 | 15.5 | 0 | 3 | 0.5 | 4.5 | 0 | 0.8 | 1.8 | −0.5 (−1.5, 0.6) | |
| Ghana | 4.3 | 7.1 | 0 | 0.4 | 18.8 | 22.2 | 15.4 | 22.9 | 22 | 11.5 | 2.0 (0.5, 3.6) | |
| Guinea | 0 | 0 | 0 | 0 | 0 | 0 | 0 | 0 | 0 | 0 | 0 (0, 0) | |
| Guinea‐Bissau | 0 | 0 | 0 | 0 | 0 | 0 | 0 | 0 | 0.8 | 0 | 0 (0, 0.1) | |
| Ivory Coast | 0 | 16.5 | 1.25 | 0.8 | 0 | 3.3 | 5 | 1.8 | 6.3 | 11.1 | 0.3 (−0.9, 1.5) | |
| Liberia | 0 | 0 | 0 | 0 | 0 | 0 | 0 | 0 | 0 | 0 | 0 (0, 0) | |
| Mali | 0 | 0.6 | 0 | 0 | 1.4 | 0 | 0 | 0 | 2.8 | 0 | 0.1 (−0.1, 0.3) | |
| Mauritania | 0 | 0 | 0 | 0 | 0 | 0 | 0 | 0 | 0 | 0 | 0 (0, 0) | |
| Niger | 0 | 0 | 0 | 0 | 0.6 | 0 | 0 | 0 | 0 | 0 | 0 (−0.1, 0) | |
| Nigeria | 39.0 | 53.4 | 21.67 | 40.8 | 24.9 | 25.3 | 64.5 | 57.0 | 65.7 | 147.6 | 8.0 (1.6, 14.3) | |
| Senegal | 0 | 2.8 | 1 | 0 | 5.2 | 5.3 | 5.2 | 10.2 | 1.9 | 4.3 | 0.6 (0, 1.2) | |
| Sierra Leone | 0 | 0 | 0 | 0 | 0 | 0 | 0 | 0 | 0 | 0 | 0 (0, 0) | |
| Togo | 0 | 0 | 0 | 0 | 0 | 0 | 0 | 0 | 0 | 0.3 | 0 (0, 0) | |
| Region | 44.4 | 91.6 | 39.4 | 47.2 | 53.8 | 57.3 | 94.6 | 91.9 | 117.4 | 193.8 | 11.7 (4.6, 18.8) | |
| Africa | 627.8 | 1010.4 | 1043.5 | 1009.6 | 864.1 | 1010.1 | 1494.7 | 1687.1 | 1864.6 | 2500.2 | 167.6 (109.0, 226.1) | |
Figure 3 depicts the positive linear relationship between GDP and cardiovascular publications in 2000 (Figure 3A) and 2008 (Figure 3B). African countries with the highest GDP also had the greatest number of cardiovascular publications in 2000 and 2008 (r2=0.18, P=0.22; r2=0.53, P<0.0001, respectively). The 5 highest‐producing countries remained the same in 2000 and 2008; however, more countries produced any cardiovascular publications in 2008 compared with 2000. There was a similar relationship between fractional cardiovascular publications and human development index (data not shown). An interactive Google Motion Chart through R v2.15.1 (R Foundation for Statistical Consulting, Vienna, Austria), whereby users can manipulate combinations of variables, is available at http://182.74.145.48:8080/ccdcgmc-webapp/generate.ccdcgmc.
Figure 3.
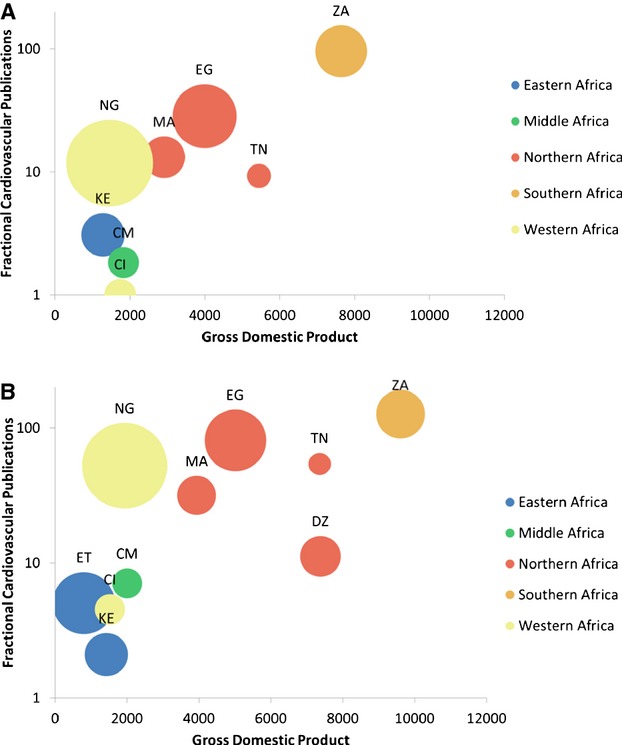
Cardiovascular publications vs gross domestic product in 2000 and 2008. Fractional cardiovascular publications are shown on a logarithmic scale vs gross domestic product for 2000 (A) and 2008 (B). Only countries with a >5.0 fractional count of cardiovascular publications are displayed. Country abbreviations are as in Figure 2 and are color‐coded according to United Nations Millennium Development regional classifications. The size of the bubble represents population size.
The relationship between the number of cardiovascular publications and disease‐specific mortality rates is available in Figure 4. Northern and Southern Africa predominated as the regions with the greatest CVD mortality rates in 2000 and 2008. There was a weak relationship between CVD death rate and number of cardiovascular publications (r2=0.07, P=0.05). This relationship became less precise (r2=0.16, P=0.14) when the outlier (South Africa) was excluded. The death rates per 1000 persons from HIV in 2000 in Eastern, Middle, Northern, Southern, and Western Africa were 1.87, 0.94, 0.06, 4.29, and 0.61, respectively. When comparing the number of cardiovascular publications to the ratio of CVD death rate to HIV death rate, the relationship was further attenuated and remained not statistically significant (r2=0.00, P=0.8).
Figure 4.
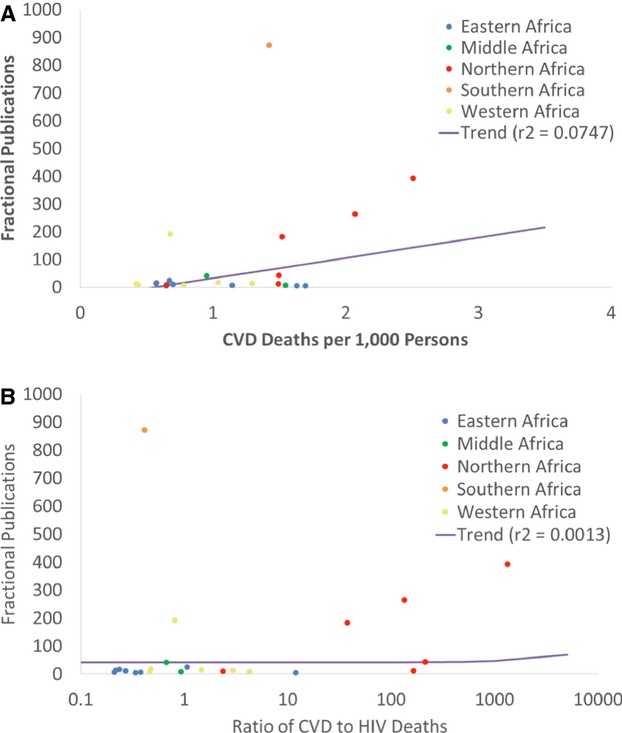
Cardiovascular publications vs cardiovascular disease (CVD) deaths and ratio of CVD to HIV deaths in 2000. Cardiovascular deaths, HIV deaths, and fractional cardiovascular publication data from each country have been aggregated to the regional level. Only countries with a >5.0 fractional count cardiovascular publications are displayed. Fractional cardiovascular publications are displayed vs cardiovascular deaths per 1000 persons for each African region (A) and also vs the ratio of cardiovascular deaths to HIV deaths (B). A regression line shows the relationship between fractional cardiovascular publications and indicator of disease burden in both panels.
Discussion
In this study, we report the numbers and trends in cardiovascular research output from 52 countries in Africa from 1999 to 2008. There are a number of relevant findings. First, African countries had fewer publications than most other income‐group nations of the world, but the overall trend in number of publications over time was similar to high‐income non‐OECD nations. Second, despite an increase in DALYs due to CVD over time, there is an inconsistent relationship between CVD burden and cardiovascular publications. Third, there are important regional differences. More than 85% of the cardiovascular publications from Africa during this time were from Southern, Northern, and (to a lesser degree) Western Africa. Fourth, in terms of publication influence, 45 of 52 countries had at least 1 year when the 5‐year citation index was zero due to lack of or very few publications. Related to this, citations of publications with some African authors represent <1% of global cardiovascular research citations. Lastly, for the same CVD burden, countries with greater HIV mortality tended to have fewer cardiovascular publications, which signals a relationship between competing public health and research priorities.
Comparison With Prior Research
Our findings are consistent with previous research showing a dearth of CVD research publications from sub‐Saharan Africa (SSA). Hofman and colleagues found that CVD accounted for <10% of the research publications from most countries in SSA between 1995 and 2004.22 There has been, however, an increase in cardiovascular research publications from Africa over time. According to a recent global research report, the Southern and Northern African regions had the greatest volume of published papers from 1999 to 2008, led by South Africa and Egypt.14 Gondwe and colleagues demonstrated a similar trend of increasing publications in Malawi, with a 103% increase in the number of articles published from 1996 to 2006.16 These authors also suggested that the main contributors to this publication growth were foreign researchers residing in Malawi, and further analysis to assess the degree to which this phenomenon is occurring in Africa as a whole is warranted.
Regional Differences
Most cardiovascular publications from Africa were from the Northern and Southern regions. Northern Africa is home to the 2 oldest degree‐awarding universities in the world (University of Al‐Karaouine in Morocco, est. 859, and Al‐Azhar University in Egypt, est. 970 or 972), which highlights the longstanding influence of academia in the region. According to the Association of African Universities (www.aau.org), Northern and Southern Africa are also home to a substantial number of universities on the continent. Other factors contributing to the small numbers of cardiovascular publications from other regions are human capital flight (or “brain drain”), political instability, and armed conflict, which would tend to decrease the overall number of publications from a country and affects regions unevenly. Human capital flight is particularly a problem for Africa, given that 1 in every 9 tertiary‐educated persons born in Africa resides in OECD countries.23 Eastern and Middle Africa suffer from the highest emigration rates to OECD countries. Retaining African researchers in Africa increases overall research production from Africa, and this may be 1 method to foster more cardiovascular publications.24
Within SSA, cardiovascular publications were low in the Eastern, Middle, and Western regions relative to Southern Africa. South Africa was the major contributor to cardiovascular publications from Southern Africa. These differences across SSA are likely related to the higher level of economic development in South Africa—an upper‐middle‐income country—relative to most of the other countries that produced cardiovascular publications in the region. Regional economic diversity impacts cardiovascular publication outputs in other regions of the world as well.25 Related to these economic differences, within SSA national investment in biomedical research is greatest in South Africa.26 As a result, South Africa accounts for most of the relationship between cardiovascular publications and death rate as illustrated by the weaker association after excluding South Africa from this analysis. The dearth of cardiovascular research outputs in Eastern, Western, and Middle Africa stands in contrast to the rising burden of cardiovascular disease and its risk factors as demonstrated in national and community‐based studies.27–29 Hypertension, alcohol use, low fruit and vegetable intake, and (in Western and Middle Africa) diabetes appear to be the most common cardiovascular risk factors.30 In addition to the aforementioned factors for low cardiovascular research output from these regions, HIV and other endemic conditions have dominated the biomedical research landscape.31–32 Taken together, these regions' low cardiovascular research outputs and rising burden of cardiovascular and other noncommunicable diseases uncover subregions in Africa where the need for attention to cardiovascular research may be greatest.
Investment in Research and Cardiovascular Publications
The 4 countries producing the most cardiovascular publications in the present analysis (South Africa, Egypt, Tunisia, and Nigeria) were also in the top tiers of GDP and publication output alongside Algeria and Kenya in a previous report.14 Creating an environment supportive of research requires national‐level input for the conduct and governance of health research. Unfortunately, national investment in health research in many African countries has historically been low. In 1990, the Commission on Health Research for Development called for governments in developing countries to allocate 1% of national GDP to research and 2% of national health expenditures to research. By 2005, no African country had met the 1% goal, although South Africa came the closest (0.9%).26 This investment in cardiovascular research publications is the likely reason that South Africa accounts for the observed relationship between cardiovascular research publications and disease burden. In the wake of many high‐level meetings in Africa to reinvigorate the commitment to the 1990 goal, in 2001 the heads of state of African Union countries met in Abuja, Nigeria and pledged to allocate at least 15% of their annual budgets to improve the health sector.33 By 2011 only 1 country, Tanzania, had met the 15% health‐funding target and most countries maintained or even reduced the level of health expenditure.34
While these issues pose a challenge for overall research production, investment specifically in cardiovascular research suffers an additional blow. The agenda for health research in Africa has focused mainly on communicable and acute conditions, which has resulted in little CVD research investment,20,35 despite projections that CVD will be the main public health problem on the continent by 2030 as a result of an increase in CVD risk factors.1,36 Our data show that the number of cardiovascular publications in Africa has a weak relationship to the CVD burden and is further attenuated when compared with the CVD/HIV death rate. In Northern Africa, the recent increase in DALYs stands in contrast to the decrease in proportion of biomedical research devoted to cardiovascular diseases. Despite the numerous burdens of disease in Africa and the substantial projected increase in cardiovascular morbidity in the near future, CVD research has received scant attention. We agree with, and our findings support, calls for more investment in research that is being performed in Africa and led by African researchers to gain an understanding of the evolving spectrum of CVD on the continent and to plan and implement interventions appropriate for the national context.5,8,37
The strengths of this analysis include development and iterative testing of a cardiovascular bibliometric filter with a high level of precision and recall and a long study period with a large number of publications and citations downloaded to evaluate trends over time. There are a number of limitations, however, that should be considered. First, our analysis was conducted on publications indexed in the Thomson Reuters Web of Knowledge and may not represent all cardiovascular publications from countries in Africa where national or regional cardiovascular journals may be underrepresented. However, the Web of Knowledge is the largest bibliometric database currently available and provides standardized author address information for analyses like ours. Second, we used citation indices as a measurement of the influence of publications in the research field, which can underrepresent the actual effects that research results may have on overall health in a particular country.38 Journal citations are only 1, limited measure of the relative importance of a research article to inform practice and improve care, though they are used widely for comparison across (and within) journals.39 Third, countries with few cardiovascular research publications had unstable measures of fractional address count. Lastly, the exploration of relationships between country income status, cardiovascular research publications, and measures of disease burden and development are susceptible to reverse causality or potential confounding.
Conclusions
Despite the increases in CVD burden in Africa, the amount of cardiovascular publications currently being produced is among the lowest in the world and is out of proportion to the disease burden in many countries. A few countries in Northern and Southern Africa produce orders‐of‐magnitude more cardiovascular publications than most others. Institutions and governments should allocate funds for regional and international projects to improve cardiovascular‐scientific outputs. Cardiovascular research is important for Africa, especially as it relates to improving clinical care, reducing human capital flight, and developing locally relevant approaches to sustaining cardiovascular health.
Sources of Funding
This work was supported by Global Forum for Health Research (Geneva, Switzerland) and the Fogarty International Center (Bethesda, MD). Neither participated in the study design, conduct, analysis, interpretation, writing, or decision to publish. Bloomfield is supported by the Fogarty International Center of the National Institutes of Health (K01TW008407). Huffman is supported by a National Heart, Lung, and Blood Institute (NHLBI) Pathway to Independence award (1R00HL107749). P. Prabhakaran and Ajay are supported by a Wellcome Trust Capacity Strengthening Strategic Award to the Public Health Foundation of India and a consortium of United Kingdom universities. D. Prabhakaran receives partial salary support from a contract award (HHS N268200900026C) from the NHLBI and a grant award (D43HD065249) from the National Institute of Child Health and Human Development.
Disclosures
None.
References
- Lozano R, Naghavi M, Foreman K, Lim S, Shibuya K, Aboyans V, Abraham J, Adair T, Aggarwal R, Ahn SY, Alvarado M, Anderson HR, Anderson LM, Andrews KG, Atkinson C, Baddour LM, Barker‐Collo S, Bartels DH, Bell ML, Benjamin EJ, Bennett D, Bhalla K, Bikbov B, Bin Abdulhak A, Birbeck G, Blyth F, Bolliger I, Boufous S, Bucello C, Burch M, Burney P, Carapetis J, Chen H, Chou D, Chugh SS, Coffeng LE, Colan SD, Colquhoun S, Colson KE, Condon J, Connor MD, Cooper LT, Corriere M, Cortinovis M, de Vaccaro KC, Couser W, Cowie BC, Criqui MH, Cross M, Dabhadkar KC, Dahodwala N, De Leo D, Degenhardt L, Delossantos A, Denenberg J, Des Jarlais DC, Dharmaratne SD, Dorsey ER, Driscoll T, Duber H, Ebel B, Erwin PJ, Espindola P, Ezzati M, Feigin V, Flaxman AD, Forouzanfar MH, Fowkes FG, Franklin R, Fransen M, Freeman MK, Gabriel SE, Gakidou E, Gaspari F, Gillum RF, Gonzalez‐Medina D, Halasa YA, Haring D, Harrison JE, Havmoeller R, Hay RJ, Hoen B, Hotez PJ, Hoy D, Jacobsen KH, James SL, Jasrasaria R, Jayaraman S, Johns N, Karthikeyan G, Kassebaum N, Keren A, Khoo JP, Knowlton LM, Kobusingye O, Koranteng A, Krishnamurthi R, Lipnick M, Lipshultz SE, Ohno SL, Mabweijano J, MacIntyre MF, Mallinger L, March L, Marks GB, Marks R, Matsumori A, Matzopoulos R, Mayosi BM, McAnulty JH, McDermott MM, McGrath J, Mensah GA, Merriman TR, Michaud C, Miller M, Miller TR, Mock C, Mocumbi AO, Mokdad AA, Moran A, Mulholland K, Nair MN, Naldi L, Narayan KM, Nasseri K, Norman P, O'Donnell M, Omer SB, Ortblad K, Osborne R, Ozgediz D, Pahari B, Pandian JD, Rivero AP, Padilla RP, Perez‐Ruiz F, Perico N, Phillips D, Pierce K, Pope CA, III, Porrini E, Pourmalek F, Raju M, Ranganathan D, Rehm JT, Rein DB, Remuzzi G, Rivara FP, Roberts T, De León FR, Rosenfeld LC, Rushton L, Sacco RL, Salomon JA, Sampson U, Sanman E, Schwebel DC, Segui‐Gomez M, Shepard DS, Singh D, Singleton J, Sliwa K, Smith E, Steer A, Taylor JA, Thomas B, Tleyjeh IM, Towbin JA, Truelsen T, Undurraga EA, Venketasubramanian N, Vijayakumar L, Vos T, Wagner GR, Wang M, Wang W, Watt K, Weinstock MA, Weintraub R, Wilkinson JD, Woolf AD, Wulf S, Yeh PH, Yip P, Zabetian A, Zheng ZJ, Lopez AD, Murray CJ, AlMazroa MA, Memish ZA. Global and regional mortality from 235 causes of death for 20 age groups in 1990 and 2010: a systematic analysis for the Global Burden of Disease Study 2010. Lancet. 2012; 380:2095-2128. [DOI] [PMC free article] [PubMed] [Google Scholar]
- GBD 2013 Mortality and Causes of Death Collaborators. Global, regional, and national age‐sex specific all‐cause and cause‐specific mortality for 240 causes of death, 1990–2013: a systematic analysis for the Global Burden of Disease Study 2013. Lancet. 2014; 385:117-171. [DOI] [PMC free article] [PubMed] [Google Scholar]
- Mensah GA. Ischaemic heart disease in Africa. Heart. 2008; 94:836-843. [DOI] [PubMed] [Google Scholar]
- Gaziano TA, Reddy KS, Paccaud F, Horton S, Chaturvedi V. In: Jamison DT, Breman J, Measham A, Alleyne G, Claeson M, Evans DB, Jha P, Mills A, Musgrove P. (eds.). Cardiovascular disease. Disease Control Priorities in Developing Countries. 20062nd edNew York, NY: Oxford University Press and World Bank; 2006. 645-662. [Google Scholar]
- Mayosi BM, Lawn JE, van Niekerk A, Bradshaw D, Abdool Karim SS, Coovadia HMLancet South Africa team. Health in South Africa: changes and challenges since 2009. Lancet. 2012; 380:2029-2043. [DOI] [PubMed] [Google Scholar]
- Ali MK, Rabadan‐Diehl C, Flanigan J, Blanchard C, Narayan KM, Engelgau M. Systems and capacity to address noncommunicable diseases in low‐ and middle‐income countries. Sci Transl Med. 2013; 5:181cm4. [DOI] [PubMed] [Google Scholar]
- Fuster V, Kelly BB, Vedanthan R. Global cardiovascular health: urgent need for an intersectoral approach. J Am Coll Cardiol. 2011; 58:1208-1210. [DOI] [PubMed] [Google Scholar]
- Mocumbi AO. Lack of focus on cardiovascular disease in sub‐Saharan Africa. Cardiovasc Diagn Ther. 2012; 2:74-77. [DOI] [PMC free article] [PubMed] [Google Scholar]
- Holmes MD, Dalal S, Volmink J, Adebamowo CA, Njelekela M, Fawzi WW, Willett WC, Adami HO. Non‐communicable diseases in sub‐saharan Africa: the case for cohort studies. PLoS Med. 2010; 7:e1000244. [DOI] [PMC free article] [PubMed] [Google Scholar]
- de‐Graft Aikins A, Unwin N, Agyemang C, Allotey P, Campbell C, Arhinful D. Tackling Africa's chronic disease burden: from the local to the global. Global Health. 2010; 6:5. [DOI] [PMC free article] [PubMed] [Google Scholar]
- Prabhakaran P, Ajay VS, Prabhakaran D, Gottumukkala AK, Shrihari JS, Snehi U, Joseph B, Reddy KS. Global cardiovascular disease research survey. J Am Coll Cardiol. 2007; 50:2322-2328. [DOI] [PubMed] [Google Scholar]
- Huffman MD, Baldridge A, Bloomfield GS, Colantonio LD, Prabhakaran P, Ajay VS, Suh S, Lewison G, Prabhakaran D. Global cardiovascular research output, citations, and collaborations: a time‐trend, bibliometric analysis (1999–2008). PLoS ONE. 2013; 8:e83440. [DOI] [PMC free article] [PubMed] [Google Scholar]
- Hofman K, Ryce A, Prudhomme W, Kotzin S. Reporting of non‐communicable disease research in low‐ and middle‐income countries: a pilot bibliometric analysis. J Med Libr Assoc. 2006; 94:415-420. [PMC free article] [PubMed] [Google Scholar]
- Adams J, King C, Hook D. Global Research Report‐Africa. 2010. 1Leeds: Thomson Reuters; 2010-12. [Google Scholar]
- Benie‐Bi J, Cambon L, Grimaud O, Kivits J, Alla F. Health needs and public health functions addressed in scientific publications in Francophone sub‐Saharan Africa. Public Health. 2013; 127:860-866. [DOI] [PubMed] [Google Scholar]
- Gondwe M, Kavinya T. An analysis of Malawi's publication productivity. Malawi Med J. 2008; 20:90-92. [DOI] [PMC free article] [PubMed] [Google Scholar]
- Masukume G. A 54 year analysis of articles from Mpilo Central Hospital, Bulawayo, Zimbabwe—168 articles cited 999 times. Malawi Med J. 2012; 24:36-38. [PMC free article] [PubMed] [Google Scholar]
- Enqueselassie F. Ethiopian Medical Journal: an overview assessment of the last 50 years. Ethiop Med J. 2012; 50suppl 1:1-58. [PubMed] [Google Scholar]
- Swingler GH, Pillay V, Pienaar ED, Ioannidis JP. International collaboration, funding and association with burden of disease in randomized controlled trials in Africa. Bull World Health Organ. 2005; 83:511-517. [PMC free article] [PubMed] [Google Scholar]
- Sridhar D, Batniji R. Misfinancing global health: a case for transparency in disbursements and decision making. Lancet. 2008; 372:1185-1191. [DOI] [PubMed] [Google Scholar]
- Lewison G, Paraje G. The classification of biomedical journals by research level. Scientometrics. 2004; 60:145-157. [Google Scholar]
- Hofman KJ, Kanyengo CW, Rapp BA, Kotzin S. Mapping the health research landscape in Sub‐Saharan Africa: a study of trends in biomedical publications. J Med Libr Assoc. 2009; 97:41-44. [DOI] [PMC free article] [PubMed] [Google Scholar]
- UN‐DESA, OECD. World migration in figures. A Joint Contribution by UNx2010DESA and the OECD to the United Nations Highx2010Level Dialogue on Migration and Development, October 3–4, 2013. Geneva: United Nations; 2013. [Google Scholar]
- Kellerman R, Klipstein‐Grobusch K, Weiner R, Wayling S, Fonn S. Investing in African research training institutions creates sustainable capacity for Africa: the case of the University of the Witwatersrand School of Public Health masters programme in epidemiology and biostatistics. Health Res Policy Syst. 2012; 10:11. [DOI] [PMC free article] [PubMed] [Google Scholar]
- Colantonio LD, Baldridge AS, Huffman MD, Bloomfield GS, Prabhakaran D. Cardiovascular research publications from Latin America between 1999 and 2008. A bibliometric study. Arq Bras Cardiol. 2015; 104:5-15. [DOI] [PMC free article] [PubMed] [Google Scholar]
- Burke MA, Matlin SA. (eds.). In: Burke MA, Matlin SA. (eds.). Monitoring Financial Flows for Health Research. 20082008 [Google Scholar]
- Moran A, Forouzanfar M, Sampson U, Chugh S, Feigin V, Mensah G. The epidemiology of cardiovascular diseases in sub‐Saharan Africa: the Global Burden of Diseases, Injuries and Risk Factors 2010 Study. Prog Cardiovasc Dis. 2013; 56:234-239. [DOI] [PMC free article] [PubMed] [Google Scholar]
- Mathenge W, Foster A, Kuper H. Urbanization, ethnicity and cardiovascular risk in a population in transition in Nakuru, Kenya: a population‐based survey. BMC Public Health. 2010; 10:569. [DOI] [PMC free article] [PubMed] [Google Scholar]
- Ogah OS, Madukwe OO, Chukwuonye II, Onyeonoro UU, Ukegbu AU, Akhimien MO, Onwubere BJ, Okpechi IG. Prevalence and determinants of hypertension in Abia State Nigeria: results from the Abia State Non‐Communicable Diseases and Cardiovascular Risk Factors Survey. Ethn Dis. 2013; 23:161-167. [PubMed] [Google Scholar]
- Dalal S, Beunza JJ, Volmink J, Adebamowo C, Bajunirwe F, Njelekela M, Mozaffarian D, Fawzi W, Willett W, Adami HO, Holmes MD. Non‐communicable diseases in sub‐Saharan Africa: what we know now. Int J Epidemiol. 2011; 40:885-901. [DOI] [PubMed] [Google Scholar]
- Lemoine M, Girard PM, Thursz M, Raguin G. In the shadow of HIV/AIDS: forgotten diseases in sub‐Saharan Africa: global health issues and funding agency responsibilities. J Public Health Policy. 2012; 33:430-438. [DOI] [PubMed] [Google Scholar]
- Rabkin M, Nishtar S. Scaling up chronic care systems: leveraging HIV programs to support noncommunicable disease services. J Acquir Immune Defic Syndr. 2011; 57:S87-S90. [DOI] [PubMed] [Google Scholar]
- Mbacke CS. African leadership for sustainable health policy and systems research. BMC Health Serv Res. 2013; 13suppl 2:S15. [DOI] [PMC free article] [PubMed] [Google Scholar]
- Institute for Health Metrics and Evaluation. Financing Global Health 2012: The End of the Golden Age? 2012Seattle, WA: IHME; 2012 [Google Scholar]
- Ghaffar A, Ijsselmuiden C, Zicker F. Changing Mindsets. Research Capacity Strengthening in Low‐ and Middle‐Income Countries. 2008Geneva: COHRED, Global Forum for Health Research and UNICEF/UNDP/World Bank/WHO Special Programme for Research and Training in Tropical Diseases (TDR)2008 [Google Scholar]
- Mathers CD, Loncar D. Projections of global mortality and burden of disease from 2002 to 2030. PLoS Med. 2006; 3:e442. [DOI] [PMC free article] [PubMed] [Google Scholar]
- Mocumbi AO, Ferreira MB. Neglected cardiovascular diseases in Africa: challenges and opportunities. J Am Coll Cardiol. 2010; 55:680-687. [DOI] [PubMed] [Google Scholar]
- Lewison G. Beyond SCI citations—new ways to evaluate research. Curr Sci. 2005; 89:1524-1530. [Google Scholar]
- Callaham M, Wears RL, Weber E. Journal prestige, publication bias, and other characteristics associated with citation of published studies in peer‐reviewed journals. JAMA. 2002; 287:2847-2850. [DOI] [PubMed] [Google Scholar]