Abstract
Background
Matrix metalloproteinase (MMP)‐2 deficiency makes humans and mice susceptible to inflammation. Here, we reveal an MMP‐2–mediated mechanism that modulates the inflammatory response via secretory phospholipase A2 (sPLA2), a phospholipid hydrolase that releases fatty acids, including precursors of eicosanoids.
Methods and Results
Mmp2−/− (and, to a lesser extent, Mmp7−/− and Mmp9−/−) mice had between 10‐ and 1000‐fold elevated sPLA2 activity in plasma and heart, increased eicosanoids and inflammatory markers (both in the liver and heart), and exacerbated lipopolysaccharide‐induced fever, all of which were blunted by adenovirus‐mediated MMP‐2 overexpression and varespladib (pharmacological sPLA2 inhibitor). Moreover, Mmp2 deficiency caused sPLA2‐mediated dysregulation of cardiac lipid metabolic gene expression. Compared with liver, kidney, and skeletal muscle, the heart was the single major source of the Ca2+‐dependent, ≈20‐kDa, varespladib‐inhibitable sPLA2 that circulates when MMP‐2 is deficient. PLA2G5, which is a major cardiac sPLA2 isoform, was proinflammatory when Mmp2 was deficient. Treatment of wild‐type (Mmp2+/+) mice with doxycycline (to inhibit MMP‐2) recapitulated the Mmp2−/− phenotype of increased cardiac sPLA2 activity, prostaglandin E2 levels, and inflammatory gene expression. Treatment with either indomethacin (to inhibit cyclooxygenase‐dependent eicosanoid production) or varespladib (which inhibited eicosanoid production) triggered acute hypertension in Mmp2−/− mice, revealing their reliance on eicosanoids for blood pressure homeostasis.
Conclusions
A heart‐centric MMP‐2/sPLA2 axis may modulate blood pressure homeostasis, inflammatory and metabolic gene expression, and the severity of fever. This discovery helps researchers to understand the cardiovascular and systemic effects of MMP‐2 inhibitors and suggests a disease mechanism for human MMP‐2 gene deficiency.
Keywords: heart, inflammation, matrix metalloproteinases, PLA2
Introduction
Matrix metalloproteinases (MMPs) are a family of Zn‐dependent endoproteases historically implicated in extracellular matrix remodeling.1 Interestingly, the phenotype of MMP‐2 deficiency in humans causes autosomal recessive osteolysis/arthritis syndrome and congenital heart defects.2 Arthritis is a largely inflammatory condition linked to the development of pericarditis, cardiomyopathy, congestive heart failure, and ischemic heart disease.3 MMP‐2–deficient mice mimic the human phenotype of arthritis,4 as well as exhibiting lung inflammation associated with impaired immune cell egression from inflamed airways.5 While those observations suggest a protective, anti‐inflammatory role of MMP‐2, there are also reports indicating that MMP‐2 expression can exacerbate myocardial remodeling in mice with pressure overload,6 left ventricular rupture, and late cardiac remodeling after myocardial infarction.7
The mechanism of MMP‐2 in these conditions has not been elucidated, but MMP‐dependent proteolysis has been recurrently implicated.8 MMP‐2–mediated degradation of extracellular matrix proteins, including fibronectin, laminin, and elastin, has been proposed to produce fragments that are chemotactic for cells such as macrophages and play a role in wound healing in the settings of cardiac rupture and myocardial infarction.7 MMP‐2 has also been shown to cleave mediators of inflammation like monocyte chemoattractant protein‐3/CCL7, fractalkine/CX3CL1, and stromal cell–derived factor‐1/CXCL12,8 giving MMP‐2 a role in the dampening of inflammation. Despite identification of numerous substrates of MMP‐2, the molecular mechanisms of the MMP‐2 deficiency phenotype remain largely unexplained.
In this study, we discovered that MMP‐2 is a negative regulator of systemic secreted phospholipase A2 (sPLA2) and, thereby, of downstream eicosanoid production. We began our studies by investigating the liver but unexpectedly found a novel role for the heart in inflammation, fever, and systemic blood pressure homeostasis by way of being a major source of sPLA2.
Materials and Methods
Materials
Doxycycline hyclate, Escherichia coli EH100 (Ra mutant) rough strain lipopolysaccharide (LPS), and cholesterol were obtained from Sigma‐Aldrich. EMEM was obtained from ATCC, and TaqMan quantitative real‐time polymerase chain reaction (qRT‐PCR) primers, TRIzol reagent, random primers, Superscript II, Lipofectamine RNAiMAX, Opti‐MEM, and penicillin‐streptomycin were from Life Technologies. The “high‐carb” TD.88122 mouse diet (contains 74% calories from carbohydrates) was from Harlan Laboratories. The AdEasy system was obtained from Agilent Technologies. Recombinant human pro–MMP‐2 was from EMD Millipore. Varespladib was from Selleck Chemicals. Recombinant human PLA2G10 was from ProSpec. Control and PLA2G5 siRNAs were from Qiagen. sPLA2 Assay Kit, cPLA2 Assay Kit, Prostaglandin E2 Express EIA Kit, 8‐isoprostane EIA Kit, antibodies against PLA2G5, and recombinant human PLA2G5 were obtained from Cayman Chemical. ECL Western blotting detection reagent was from GE Healthcare. Horseradish peroxidise–conjugated anti‐rabbit antibodies were from GE Healthcare or Bio‐Rad. Bio‐Rad Protein Assay was obtained from Bio‐Rad.
Animals
Wild‐type (WT) mice were purchased from Charles River and The Jackson Laboratory. Mmp7−/− and Mmp9−/− mice were purchased from The Jackson Laboratory. Mmp2−/− and Mmp2+/− mice were bred at the University of Alberta. All mice were of a C57BL/6 background and were housed in the Health Sciences Laboratory Animal Services of the University of Alberta at a 12‐hour light/dark cycle. Mice were fed a chow diet ad libitum (PicoLab Rodent Diet 20; Lab Diet), which was used in all experiments unless otherwise specified. Daily food consumption and body weights were similar between WT, Mmp2−/−, Mmp7−/−, and Mmp9−/− mice fed standard chow diet. At the end of the experiments, mice were killed with 65 mg/kg of sodium pentobarbital, the blood was collected with the use of EDTA‐coated syringes and tubes, and the organs were excised and snap‐frozen in liquid nitrogen. Except where specifically stated, all mice were male, aged 10 to 24 weeks; WT and Mmp2−/− mice were age‐matched (±2 weeks). The ages of mice used in specific studies are indicated later. All protocols were conducted in accordance with institutional guidelines issued by the Canadian Council on Animal Care.
In Vivo Responses to Dietary Cholesterol, Fasting, and Fasting‐Refeeding
The dietary regimens in these studies followed previously described protocols.9 In the cholesterol supplementation studies, Mmp2−/− or WT mice (aged 12 to 14 weeks) were fed chow supplemented with 0% or 0.15% cholesterol for 2.5 days, 6.5 days, or 4 weeks. In this study, the mice were not fasted before they were killed.
In the fasting and fasting‐refeeding studies, mice (aged 10 to 22 weeks) were fasted for 16 hours and then killed, or they were fasted for 16 hours and next fed “high‐carb” (TD.88122 mouse diet) for 4 hours and then killed.
In Vivo Pharmacological MMP Inhibition
Mice (20 weeks old) were gavaged with 120 μL of water (vehicle) or MMP inhibitor (doxycycline) regimens of 50 mg/kg per day for 3 days, 50 mg/kg per day for 15 days, or 300 mg/kg per day for 5 days and then killed.
In Vivo Pharmacological sPLA2 Inhibition
Mice (20 weeks old) were gavaged with soybean oil (vehicle) or sPLA2 inhibitor varespladib (10 mg/kg per day) prepared in soybean oil for 2 days and then killed.
Recombinant Adenovirus Construct
Green fluorescent protein (GFP) or human MMP‐2–encoding adenovirus was generated using the AdEasy system. The pOTB7 plasmid containing MMP2 was obtained from ATCC. The MMP2 gene was excised from the plasmid via XhoI and EcoRI digestion, followed by mung bean nuclease digestion to generate blunt ends. The gene was inserted into GFP tracer–containing adenoviral shuttle vector pAdTrack‐CMV EcoRV site, and the orientation of the gene was confirmed through restriction endonuclease digestion. The generated pAdTack‐CMV‐MMP2 plasmid was linearized via PmeI digestion and cotransformed into E coli BJ5183 with adenoviral backbone plasmid; then, pAdEasy‐1. pAdTack‐CMV‐MMP2 was integrated into pAdEasy‐1 via homologous recombination. Recombinants were selected for kanamycin resistance, and recombination was confirmed with the use of restriction endonuclease analysis. Finally, the linearized recombinant plasmid (by PacI) was transfected into HEK293 cells to generate GFP‐expressing adenovirus (AdGFP) or mature human MMP‐2–encoding adenovirus (AdMMP‐2).
qRT‐PCR
Cells were lysed in TRIzol. Tissue was extracted by homogenizing 30‐ to 50‐mg pieces of frozen tissue at 4°C in 1 mL of TRIzol reagent using the Bullet Blender (Next Advance Inc., NY, USA). RNA was isolated from TRIzol according to manufacturer's instructions, and cDNA was generated from RNA by using random primers and Superscript II reverse transcriptase. Expression analysis of the reported genes was performed with TaqMan qRT‐PCR by using the ABI 7900 HT sequence detection system (Applied Biosystems). Gapdh and Actb (to confirm interpretation of data relative to Gapdh) were used as internal standards. The RT‐PCR data chosen for the figures are relative to Gapdh.
Protein Analysis
Total protein content in tissue homogenate was assessed by using Bio‐Rad Protein Assay according to the manufacturer's instructions or SDS‐PAGE followed by Coomassie blue staining.
For determination of PLA2G5 protein, plasma and recombinant PLA2G5 solutions were diluted with a 1:5 volume of SDS‐PAGE loading buffer (15% SDS, 8 mol/L urea, 10% 2‐mercaptoethanol, 25% glycerol, 0.2 mol/L Tris, pH 6.8), heated at 37°C for 20 minutes, and subjected to 10% Tricine‐SDS‐PAGE as previously described.10 After electrophoresis, proteins from the gels were transferred to a nitrocellulose membrane by using the TE22 system (Hoefer). Membranes were visualized with the use of Ponceau S acid staining; scanned to assess protein load; blocked in 5% bovine serum albumin in 20 mmol/L Tris, 150 mmol/L NaCl, pH 7.4, containing 0.1% Tween‐20; probed overnight with primary antibodies to PLA2G5; rinsed; probed for 30 minutes with secondary antibodies; and washed in 20 mmol/L Tris, 150 mmol/L NaCl, pH 7.4, containing 0.1% Tween‐20 to remove excess of antibody. PLA2G5 immunoreactivity was then detected by using ECL detection reagent.
MMP‐2 activity was measured with gelatin zymography, by using SDS‐PAGE gels embedded with 2 mg/mL gelatin. After electrophoresis, the gels were washed 3 times in 2.5% Triton X‐100 for 20 minutes (to remove excess SDS) and then incubated for 16 hours at 37°C in a buffer of 5 mmol/L CaCl2, 150 mmol/L NaCl, 0.5 mmol/L NaN3, and 25 mmol/L Tris, pH 7.4 (for activity development). Gels were stained with Coomassie brilliant blue to visualize bands with gelatinase activity.
Cytokine analysis was outsourced to Eve Technologies (Calgary, Canada) with use of the Mouse Cytokine Array/Chemokine Array 31‐Plex (Eve Technologies).
Measurements of Phospholipases and Eicosanoids
Except where indicated otherwise, secretory, cytosolic, and calcium‐independent PLA2 activities were measured by using the respective assay kits (Cayman), which use diheptanoyl thio‐phosphatidylcholine (PC) or arachidonoyl thio‐PC as substrates to distinguish sPLA2 from cPLA2 and iPLA2.
Prostaglandin (PG) E2 in the heart, liver, and hypothalamus was measured by using the Prostaglandin E2 Express EIA Kit (Cayman). Free 8‐isoprostane concentrations in the plasma were measured by using the 8‐isoprostane EIA Kit (Cayman).
To determine the molecular weight of the plasma and cardiac sPLA2 activities, we subjected plasma or heart homogenates to a novel zymographic technique. Hearts were homogenized by using the Bullet Blender in 10 μL/mg sPLA2 assay buffer (100 mmol/L KCl, 10 mmol/L CaCl2, 0.3 mmol/L Triton X‐100, 25 mmol/L Tris‐HCl, pH 7.4). Bromophenol blue and 20% glycerol were added to the samples for loading into a 10% SDS‐PAGE or 10% T (grams of acrylamide and bisacrylamide per 100 ml of solution ‐ in percent), 3% C (ratio of bisacrylamide to acrylamide and bisacrylamide) Tricine‐SDS‐PAGE gel. After electrophoresis, the gels were reverse‐stained by using our previously developed zinc‐imidazole reverse stain technique.11 Lanes were then cut into equal‐sized sections to cover the full range of molecular weights. The individual sections of gel were incubated for 5 minutes in 200 μL of 100 mmol/L EDTA (to mobilize proteins), washed once with water (to remove excess EDTA), and then washed (2× 10 minutes) with 2.5% Triton X‐100, 10 mmol/L CaCl2, 25 mmol/L Tris, pH 9.0 (to remove excess SDS). Next, 200 μL of sPLA2 assay buffer was added to gel pieces, and the pieces were nebulized by using the Bullet Blender. Samples were centrifuged at 20 000g for 5 minutes, and activity in the eluates (supernatant) was measured by using the sPLA2 assay kit.
Enzyme Inhibition Assays
Indoxam‐inhibition concentration‐response was constructed for 5 different concentrations by measuring the residual activity with use of the microtiter plate fluorescent assay of sPLA2s with pyrene‐labeled phosphatidyl‐glycerol as the substrate as described previously.12
Blood Pressure Measurement
Blood pressure was measured by using a computerized tail‐cuff system (RTBP 2000; Kent Scientific).
Fever Response to LPS
Body temperature of mice housed at 24±0.5°C was measured rectally after administration of an intraperitoneal injection of E coli EH100 (Ra mutant) rough strain LPS (Sigma‐Aldrich) (30 or 100 μg/kg). To measure the effect of sPLA2 inhibition on the fever response to LPS, we examined mice administered varespladib (10 mg/kg per day, orally for 2 days with the second dose immediately preceding the intraperitoneal injection of LPS). To measure the effect of MMP‐2 overexpression on the fever response, we examined mice that were intraperitoneally injected with either AdMMP‐2 or AdGFP (≈108 pfu) and then injected 3 days later with LPS (100 μg/kg).
Cell Culture Studies
For RNA interference studies, we used a stable cell line of Mmp2 deficiency created from fibroblasts isolated from WT, Mmp2−/−, or Mmp9−/− lungs. These cells were chosen for 4 key traits: (1) preserved ability to proliferate in culture without any detectable phenotypic changes after subsequent passages (up to at least 30 passages), (2) expression of PLA2G5, the major cardiac sPLA2, (3) expression of a proinflammatory phenotype, and (4) amenability to efficient transduction with siRNAs against PLA2G5. The cells used for this study were cultured in EMEM with 10% FBS, 100 U/mL penicillin, and 100 μg/mL streptomycin, at a density of ≈104 cells/cm2. Attached fibroblasts were transfected with siRNAs against PLA2G5 or scrambled RNA (control) over a period of 3 days by using Lipofectamine RNAiMAX according to the manufacturer's instructions.
Statistical Analysis
The main unit of statistical analysis for qRT‐PCR and systolic blood pressure measurements was the animal. In qRT‐PCR analyses, the RNA isolated for each mouse was measured in triplicate, and the resulting average value was used to compute the mean of said mRNA for each group. Similarly, the mean of the systolic blood pressure for each group was computed from the average of 8 to 10 individual measurements for each mouse in the group. For PLA2s, PGE2, and isoprostanes, the main unit of statistical analysis was the duplicate of pooled samples, as described in the corresponding figure legends. Unless otherwise indicated, the results are reported as mean±SEM values. Results were analyzed by using SigmaPlot 11 software (Systat Software). The specific statistical tests used are indicated in the corresponding figure legends.
Results
MMP‐2 Is a Negative Regulator of PLA2 Activity and Eicosanoid Synthesis
The PLA2 family of intracellular (cytosolic [cPLA2] and calcium‐independent [iPLA2]) and extracellular (secretory [sPLA2]) enzymes catalyze the hydrolysis of phospholipids to liberate fatty acids esterified at the sn‐2 position.13 Mmp2−/− mice showed a ≈25% elevation of hepatic cPLA2 and iPLA2 activity and dramatically elevated plasma sPLA2 activity (Figure 1A).
Figure 1.
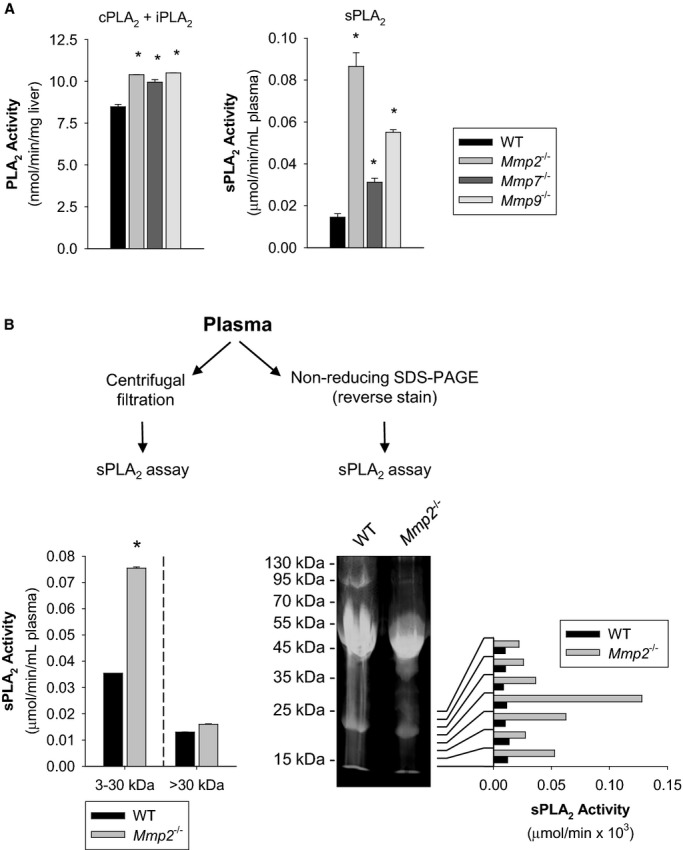
MMP‐2 is a negative regulator of phospholipase A2 activity. A, Enzymatic activities of phospholipase A2. Left: cPLA2 and iPLA2 activity from mouse liver. Right: sPLA2 activity from mouse plasma. The activity of pools of n=4 mice per genotype was measured in duplicate. *P≤0.05 vs WT. All pairwise multiple‐comparison procedures (Holm–Sidak method). B, Left: sPLA2 activity in plasma samples (pools of n=3 mice per genotype) fractionated by weight using centrifugal filters and measured in duplicate. *P≤0.05 vs WT (3 to 30 kDa). All pairwise multiple‐comparison procedures (Holm–Sidak method). Right: Fractionation by molecular weight (nonreducing SDS‐PAGE) of sPLA2 activity in pooled plasma samples (pools of n=3 mice per genotype). After reverse staining (used to visualize plasma protein bands without affecting enzyme activity), protein was eluted from the gel and assessed for sPLA2 activity (vertical bar diagram). cPLA2 indicates cytosolic phospholipase A2; iPLA2, calcium‐independent phospholipase A2; MMP, matrix metalloproteinase; sPLA2, secreted phospholipase A2; WT, wild‐type.
The plasma sPLA2 activity of Mmp2−/− mice was found at a molecular weight range of 3 to 30 kDa through centrifugal filtration (Figure 1B, left).
Development of a novel combination of techniques, involving nonreducing SDS‐PAGE followed by reverse‐stain11 and sPLA2 activity assay, revealed that Mmp2−/− plasma sPLA2 has a molecular weight of ≈20 kDa (Figure 1B, right).
Plasma sPLA2 activity was less elevated in Mmp7−/− and Mmp9−/− mice, indicating a predominant role of MMP‐2 (Figure 1A). Notably, plasma sPLA2 activity was also elevated in Mmp2−/− mice subjected to diverse nutritional regimens including fasting‐refeeding and excess cholesterol supplementation (Figure 2A). In these nutritional regimens, MMP‐2 levels remained unchanged in WT mice (Figure 2B). These data consistently indicate that MMP‐2 is a negative regulator of sPLA2 activity.
Figure 2.
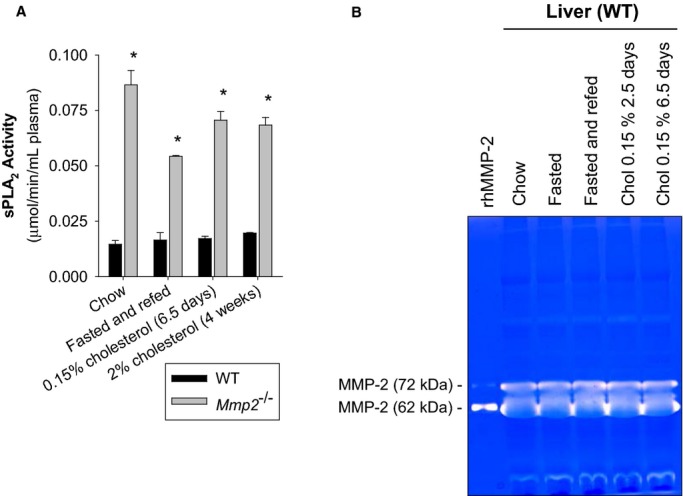
A, Effect of different nutritional regimens on plasma sPLA2 activity. The activity in pools of n=4 (for chow‐fed and 2.5‐day 0.15% cholesterol–fed mice) or n=3 (for fasted‐refed mice and 4‐week 2% cholesterol–fed mice) was measured in duplicate. *P≤0.05 vs WT, t test. B, Effect of diet on hepatic MMP‐2 expression. Gelatin zymography indicating hepatic MMP‐2 activity levels of WT mice that were fed, fasted, fasted‐refed, or cholesterol fed. Pools of n=5 for fasted mice, n=4 for fed, fasted‐refed, and cholesterol‐fed mice. MMP indicates matrix metalloproteinase; sPLA2, secreted phospholipase A2; WT, wild‐type.
The sn‐2 position of phospholipids is enriched in polyunsaturated fatty acids (eg, arachidonic acid), which is the precursor of all eicosanoids, including PGE2 (which is synthesized downstream of cyclooxygenases) and 8‐isoprostanes (which are formed independent of cyclooxygenases).14 In Mmp2−/− mice, hepatic PGE2 (Figure 3A) and plasma 8‐isoprostanes (Figure 3B) were both increased. However, PGE2 levels in Mmp7−/− and Mmp9−/− mice were not as elevated (Figure 3A). Treatment of Mmp2−/− mice with the sPLA2 inhibitor varespladib normalized the levels of plasma sPLA2 and hepatic PGE2 (Figure 3C). These data showed that MMP‐2 deficiency causes excess sPLA2 activity, which, in turn, elevates PGE2.
Figure 3.
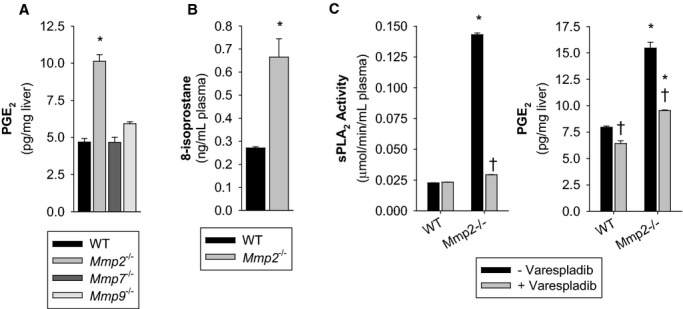
MMP‐2 is a negative regulator of eicosanoid synthesis. A, Hepatic PGE2 concentration in mice. Pools of n=4 for each genotype were measured in duplicate. *P≤0.05 vs WT (control). Multiple comparisons vs control group (Holm–Sidak method). B, Plasma free 8‐isoprostane concentration in mice. Pools of n=4 for each genotype were measured in duplicate. *P≤0.05 vs WT, t test. C, WT mice were administered the sPLA2 inhibitor varespladib (10 mg/kg per day) for 2 days. Left: Plasma sPLA2 activity. Right: Hepatic PGE2 concentration. Pools of n=3 for each treatment group were measured in duplicate. *P≤0.05 vs WT−Varespladib (control). †P≤0.05 vs Mmp2−/−−Varespladib (control). All pairwise multiple‐comparison procedures (Holm–Sidak method). MMP indicates matrix metalloproteinase; PGE2, prostaglandin E2; sPLA2, secreted phospholipase A2; WT, wild‐type.
Mimicking Mmp2 deficiency, administration of the US Food and Drug Administration (FDA)‐approved MMP inhibitor doxycycline to WT mice dose‐dependently increased the activity of plasma sPLA2 and the hepatic PGE2 (Figure 4A).
Figure 4.
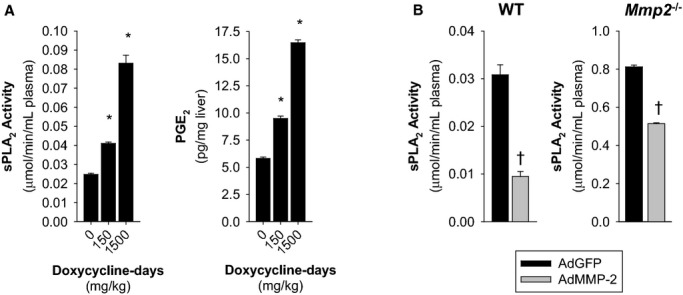
Upregulation of sPLA2 activity by pharmacological MMP‐2 inhibition and downregulation by adenoviral MMP‐2 reconstitution. A, WT mice were orally administered 130 μL of 50 mg/kg per day doxycycline for 3 days (150 mg/kg doxycycline‐days, n=4) or 300 mg/kg per day doxycycline for 5 days (1500 mg/kg doxycycline‐days, n=4). Control mice received water (130 μL) by gavage for either 3 or 5 days (0 doxycycline‐days) and were pooled into a single group of n=7 mice for analysis. Left: Plasma sPLA2 activity. Right: Hepatic PGE2 concentration. Pooled samples of each treatment group were measured in duplicate. *P≤0.05 vs 0 doxycycline‐days (control). All pairwise multiple comparisons vs control group (Holm–Sidak method). B, Plasma sPLA2 activity was decreased by overexpression of human MMP‐2 with an adenoviral construct in WT and Mmp2−/− mice. Analysis of plasma sPLA2 activity in mice transduced with either AdMMP‐2 or AdGFP (≈108 pfu). The data presented corresponds to WT mice sacrificed 2 weeks after intravenous adenoviral injection and Mmp2−/− mice sacrificed 5 days after intraperitoneal adenoviral injection. n=4 mice per genotype. †P≤0.05 vs AdGFP, t test. AdGFP indicates green fluorescent protein–expressing adenovirus; AdMMP, MMP‐2‐encoding adenovirus; MMP, matrix metalloproteinase; PGE2, prostaglandin E2; sPLA2, secreted phospholipase A2; WT, wild‐type.
MMP‐2 upregulation by transducing mice with human MMP‐2–encoding adenovirus (AdMMP‐2) decreased plasma sPLA2 activity (versus AdGFP) in both WT (Figures 4B and 5A) and Mmp2−/− mice (Figures 4B and 5B). This finding was consistent with MMP‐2 being a negative regulator of sPLA2.
Figure 5.
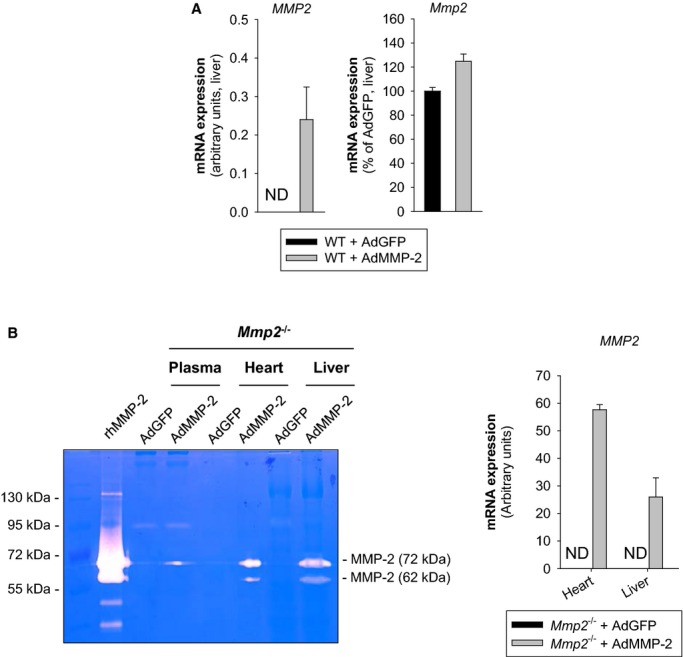
A, Analysis by qRT‐PCR of hepatic levels of human and mouse MMP‐2 level. B, Left: Analysis by gelatin zymography of MMP‐2 levels in plasma, heart, and liver. Right: Analysis by qRT‐PCR of human MMP2 expression in heart and liver. Mice were intraperitoneally injected with AdMMP‐2 or AdGFP (≈108 pfu). The data corresponds to Mmp2−/− mice sacrificed 5 days after adenoviral injection. n=4 mice for each genotype. AdGFP indicates green fluorescent protein–expressing adenovirus; AdMMP, MMP‐2–encoding adenovirus; MMP, matrix metalloproteinase; ND, not detected; qRT‐PCR, quantitative real‐time polymerase chain reaction; rhMMP‐2, recombinant human MMP‐2.
MMP‐2 Is a Negative Regulator of Fever
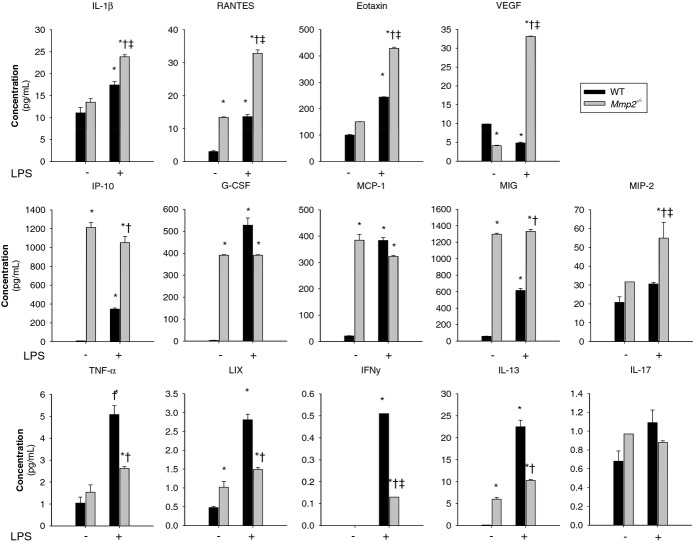
At baseline, Mmp2−/− mice exhibited signs of a proinflammatory state as indicated by the increased mRNA expression of the genes encoding tumor necrosis factor (TNF)‐α (Tnf), interleukin (IL)‐1β (Il1b), monocyte chemoattractant protein‐1 (MCP‐1) (Ccl2), regulated on activation, normal T cell expressed and secreted (RANTES) (Ccl5), and chemokine (C‐C motif) ligand 6 (CCL6) (Ccl6) in the heart and liver and downregulated expression of liver X receptor‐α (Nr1h3) (Figure 6). A pattern supporting a proinflammatory state in Mmp2 deficiency was also suggested by the protein levels of IL‐1β, RANTES, IP‐10, G‐CSF, MCP‐1, MIG, LIX, and IL‐13 (Figure 7).
Figure 6.
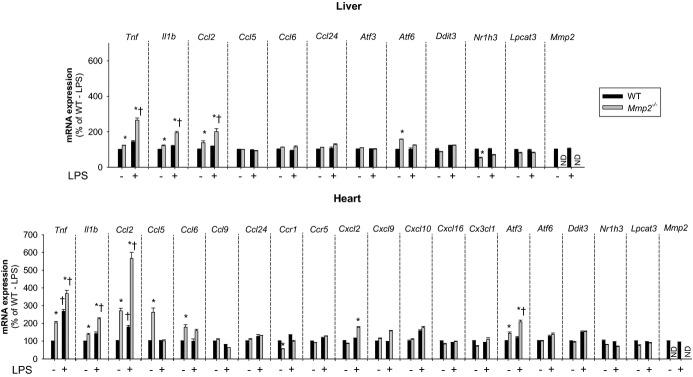
MMP‐2 modulates the transcription of inflammatory genes in the liver and heart at baseline and in response to LPS. qRT‐PCR analysis of inflammatory marker genes in the liver and heart of WT and Mmp2−/− mice. Effect of LPS treatment (30 μg/kg) for 5 hours. n=3 mice per genotype. *P≤0.05 vs WT−LPS (control). †P≤0.05 vs Mmp2−/−−LPS (control). All pairwise multiple comparisons vs control group (Holm–Sidak method). LPS indicates lipopolysaccharide; MMP, matrix metalloproteinase; ND, not detected; qRT‐PCR, quantitative real‐time polymerase chain reaction; WT, wild‐type.
Figure 7.
MMP‐2 modulates the expression of inflammatory cytokines in the heart at baseline and in response to LPS. Numerous cytokines are upregulated in Mmp2−/− mice at baseline and 5 hours after LPS (30 μg/kg) administration (vs WT mice). The panel of selected cytokines was measured using the cytokine 32‐plex assay (Eve Technologies) in WT and Mmp2−/− hearts. n=4 mice per genotype. Pools of each treatment group were measured in duplicate. *P≤0.05 vs WT−LPS (control). †P≤0.05 vs WT+LPS (control). ‡P≤0.05 vs Mmp2−/−−LPS (control). All pairwise multiple comparisons vs control group (Holm–Sidak method). G‐CSF indicates granulocyte colony‐stimulating factor; IL, interleukin; INF, interferon; IP, Interferon gamma‐induced protein; LIX, lipopolysaccharide‐induced CXC chemokine; LPS, lipopolysaccharide; MCP, monocyte‐chemoattractant protein; MIG, monokine induced by gamma interferon; MMP, matrix metalloproteinase; ND, not detected; TNF, tumor necrosis factor; VEGF; vascular endothelial growth factor; WT, wild‐type.
Compared with Mmp2−/− mice, in Mmp7−/− or Mmp9−/− mice, the hepatic expression of Tnf, Il1b, and Ccl2 was not elevated and that of Nr1h3 was not decreased (Figure S1 and data not shown).
In response to bacterial LPS, PGE2 synthesized by the PLA2/cyclooxygenase/PGE synthase pathway promotes fever and inflammation.15 We administered LPS (30 μg/kg) to WT and Mmp2−/− mice and searched for signs of inflammation, endoplasmic reticulum stress, or lipid metabolic dysregulation by using qRT‐PCR and a cytokine array. Five hours after LPS administration, hepatic and cardiac mRNA expression of the genes encoding TNF‐α (Tnf), IL‐1β (Il1b), MCP‐1 (Ccl2), RANTES (Ccl5), and CCL6 (Ccl6) was exacerbated in Mmp2−/− (Figure 6). At the protein level, Mmp2−/− hearts also had pronounced expression of IL‐1β, RANTES, Eotaxin, VEGF, IP‐10, MIG, and MIP‐2. The levels of G‐CSF, MCP‐1, TNF‐α, LIX, IFN‐γ, and IL‐13 were less induced and IL‐17 was unchanged versus WT mice (Figure 7). These data revealed that the inflammatory response to LPS depends strongly on whether MMP‐2 is expressed.
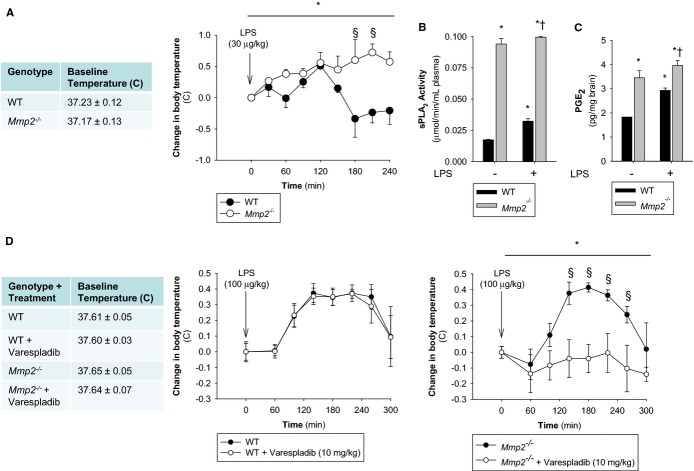
In response to LPS (30 μg/kg), Mmp2−/− mice housed at constant ambient temperature (24±0.5°C) had exacerbated fever with highly elevated sPLA2 and PGE2 (Figures 8A through 8C and S2). Similarly, doxycycline administration to WT mice delayed the resolution of fever (Figure S3A) and increased mRNA expression of the genes encoding TNF‐α (Tnf), IL‐1β (Il1b), and MCP‐1 (Ccl2) (Figure S3B).
Figure 8.
MMP‐2 is a negative regulator of fever. A, Body temperature was measured rectally in WT and Mmp2−/− mice before and after intraperitoneal injection of LPS (30 μg/kg) at the indicated times. n=3 mice per genotype. *P≤0.05 vs Time=0 minute. One‐way repeated‐measures ANOVA. §P≤0.05 vs WT. All pairwise multiple‐comparison procedures (Holm–Sidak method). B, Plasma sPLA2 activity in untreated mice or LPS (30 μg/kg)‐treated mice 5 hours after LPS administration. Pools of n=3 were measured in duplicate. *P≤0.05 vs WT−LPS, t test. †P≤0.05 vs Mmp2−/−−LPS, t test. C, Hypothalamic PGE2 levels in untreated mice or LPS (30 μg/kg) treated mice 5 hours after LPS administration. Pools of n=3 were measured in duplicate. *P≤0.05 vs WT−LPS, t test. †P≤0.05 vs Mmp2−/−−LPS, t test. D, Body temperature was measured rectally in WT and Mmp2−/− mice before and after intraperitoneal injection of LPS (100 μg/kg) at the indicated times. n=3 mice per genotype. Selective blockade of LPS‐induced fever in Mmp2−/− (but not WT) mice by the pan‐sPLA2 inhibitor varespladib. Mice received varespladib (10 mg/kg per day) orally for 2 days, with the second dose immediately preceding intraperitoneal injection of LPS. *P≤0.05 vs Time=0 minute. One way repeated measures ANOVA. §P≤0.05 vs Mmp2−/−−Varespladib. All pairwise multiple‐comparison procedures (Student‐Newman‐Keuls method). ANOVA indicates analysis of variance; LPS, lipopolysaccharide; MMP, matrix metalloproteinase; PGE2, prostaglandin E2; sPLA2, secreted phospholipase A2; WT, wild‐type.
The difference in febrile response between WT and Mmp2−/− mice observed at an LPS dose of 30 μg/kg was not seen at a dose of 100 μg/kg (Figure 8D). Strikingly, pretreatment with varespladib (10 mg/kg per day) completely blocked the development of LPS (100 μg/kg)‐induced fever in Mmp2−/− but not WT mice (Figure 8D).
Transduction with AdMMP‐2, which resulted in hepatic overexpression of human MMP‐2, ameliorated LPS‐induced fever and reduced PGE2 levels in the brain (Figure S4).
Therefore, in the absence of MMP‐2, LPS‐induced fever is signaled through a varespladib‐inhibitable (ie, sPLA2‐dependent) pathway, which would otherwise be inhibited by MMP‐2. The inhibitory effect of MMP‐2 in fever is obliterated when the LPS dose is sufficiently high. These data identify MMP‐2 as a novel negative regulator of LPS‐induced fever.
The Heart Is a Major Source of sPLA2 Activity
We compared sPLA2 activity in plasma, liver, heart, kidney, and skeletal muscle. Strikingly, the sPLA2 activity in Mmp2−/− hearts was 102‐ to 103‐fold greater versus WT hearts and versus Mmp2−/− plasma, depending on the substrate (Figure 9). sPLA2 activity of liver, kidney, and skeletal muscle were not different between WT and Mmp2−/− mice (Figure 9). The sPLA2 elevated in Mmp2−/− mice hydrolyzed both the sPLA2‐specific substrate diheptanoyl thio‐PC and arachidonoyl thio‐PC (Figure 9). The apparent Michaelis‐Menten constant (KMapp) of plasma sPLA2 for diheptanoyl thio‐PC was equal in Mmp2−/− and WT mice (303 and 273 μmol/L, respectively). Plasma values were similar to those of Mmp2−/− and WT hearts (259 and 308 μmol/L, respectively). These data indicated that the plasma and cardiac sPLA2 enzymes were the same. The cardiac sPLA2 depended on calcium for its activity (Figure 10A) and was active over a broad pH range with maximal activity at pH 7.5 (Figure 10B) and a molecular weight of ≈20 kDa (Figure 10C). In haploinsufficient (Mmp2+/−) mice, the levels of cardiac sPLA2 activity were as approximately half those of Mmp2−/− mice (Figure 11A).
Figure 9.
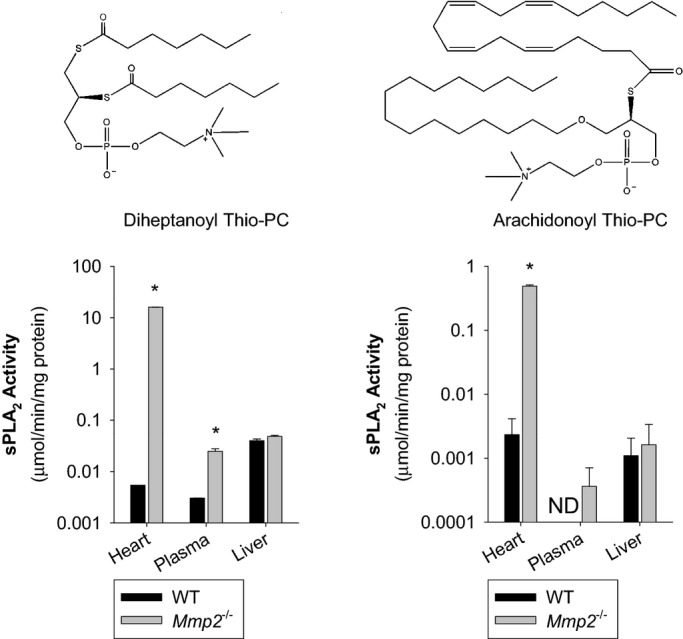
The heart is a major source of sPLA2 activity. sPLA2 activity in the heart, plasma, and liver against the sPLA2 substrates diheptanoyl thio‐PC and arachidonoyl thio‐PC. Pools of n=3 mice per genotype were measured in duplicate. *P≤0.05 vs WT, t test. ND indicates not detected; sPLA2, secreted phospholipase A2; WT, wild‐type.
Figure 10.
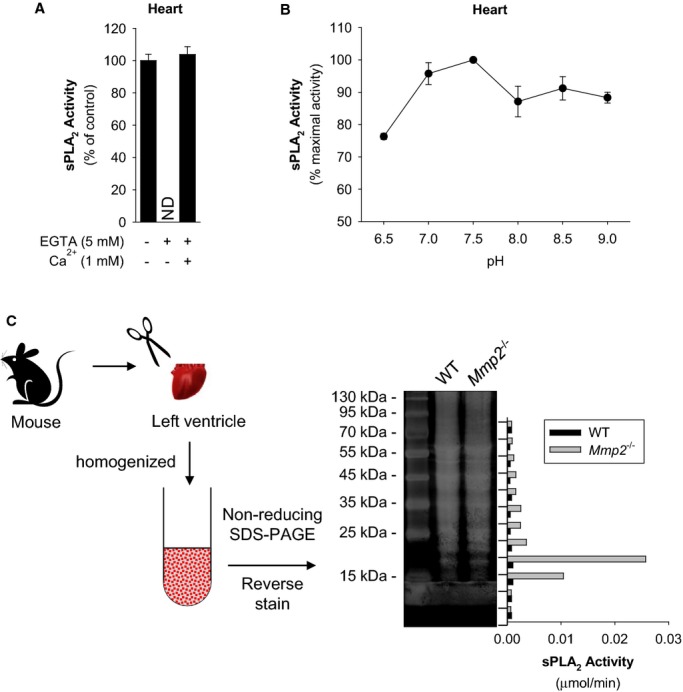
Biochemical characteristics of the sPLA2 elevated in Mmp2 deficiency. A, Cardiac sPLA2 requires Ca++ for activity. The sPLA2 activity in Mmp2−/− heart homogenate was measured in the presence of EGTA (to chelate calcium) or an excess of calcium. Pools of n=3 were measured in duplicate. Similar results were obtained in 3 separate experiments. B, Cardiac sPLA2 has a broad pH optimum in the basic pH range. The sPLA2 activity of Mmp2−/− mouse heart homogenate (pool of n=3 mice) was measured at the indicated pH values in duplicate. Similar results were obtained in 3 separate experiments. C, Molecular weight of cardiac sPLA2 activity. Strategy for analytical isolation of cardiac sPLA2. Hearts were excised and homogenized, cardiac proteins (from 1.5 mg tissue) were resolved by molecular weight (non‐reducing SDS‐PAGE). After reverse staining (for protein band visualization without loss of activity), protein was eluted from the gel and assessed for sPLA2 activity (vertical bar diagram). MMP indicates matrix metalloproteinase; ND, not detected; sPLA2, secreted phospholipase A2; WT, wild‐type.
Figure 11.
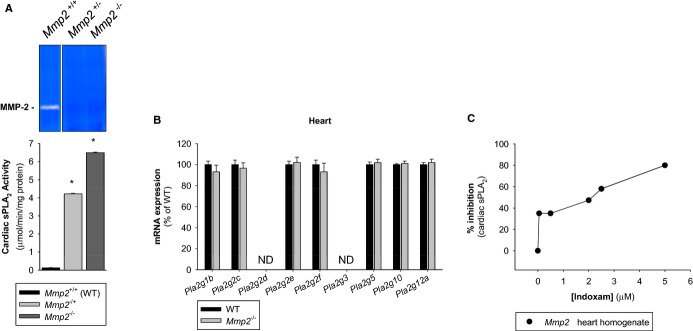
Expression characteristics of the sPLA2 elevated in Mmp2 deficiency. A, Dependence on MMP‐2 expression. Cardiac sPLA2 activity (bottom) and plasma MMP‐2 levels (top) in mice lacking neither copy (Mmp2+/+, n=4), 1 copy (Mmp2+/−, n=3) or 2 copies (Mmp2−/−, n=4) of Mmp2. Pooled samples were measured in duplicate. *P≤0.05 vs WT, t test. B, Lack of regulation by transcription. qRT‐PCR analysis of the entire family of known sPLA2s expressed in C57BL mice. PLA2G2A is not presented as the gene for this enzyme is disrupted in C57BL strain. n=4 mice per genotype. C, Enzyme inhibition assay with indoxam suggests that cardiac sPLA2 may be a mixture of various sPLA2 enzymes. MMP indicates matrix metalloproteinase; ND, not detected; qRT‐PCR, quantitative real‐time polymerase chain reaction; sPLA2, secreted phospholipase A2; WT, wild‐type.
PLA2G5, Which Is a Major Cardiac sPLA2 Isoform, Contributes to Inflammation in MMP‐2 Deficiency
Secreted PLA2s comprise a family of at least 11 lipid hydrolases in humans and mice16: PLA2G1B, PLA2G2(A, C, D, E, F), PLA2G3, PLA2G5, PLA2G10, and PLA2G12(A, B). Some of these enzymes might not be good candidate targets of MMP‐2 in our studies. (1) The C57BL/6 mouse strain is a natural knock‐out for PLA2G2A; thus, this sPLA2 cannot account for the observed effects. (2) Neither PLA2G2F, PLA2G3, nor PLA2G1212,16 could be excluded because they are not effectively inhibited by varespladib (which blunted sPLA2 activity and PGE2 levels in Mmp2−/− mice [Figure 3C]). (3) PLA2G2E could be excluded because it promotes obesity,17 while MMP‐2 deficiency protects against obesity.18 (4) PLA2G2D could also be excluded because it ameliorates inflammation,19 whereas MMP‐2 deficiency results in a proinflammatory state (Figures 6 and 7). (5) PLA2G12A is unlikely because this has very low PLA2 activity.
qRT‐PCR analysis of the entire sPLA2 gene family expressed in C57BL/6 mice indicated that their expression was equal in WT and Mmp2−/− hearts (Figure 11B).
Inhibition studies with the pan‐sPLA2 inhibitor indoxam suggested that cardiac sPLA2 is most likely a mixture of indoxam‐resistant and indoxam‐sensitive sPLA2s with a net IC50 for indoxam of 2 μmol/L (Figure 11C). Possible indoxam‐resistant candidates are PLA2G1B, PLA2G2D, PLA2G2F, and PLA2G10, all of which have an IC50 for indoxam of ≥1 μmol/L.12 Possible indoxam‐sensitive components are PLA2G2E (IC50≈0.035 μmol/L) and PLA2G5 (IC50≈0.170 μmol/L).12 Therefore, cardiac sPLA2 is either a mixture of sPLA2s or a completely novel (ie, a nonclassic) member of the sPLA2 family.
The mRNA for Pla2g5 is highly expressed in cardiac and vascular atherosclerotic tissue.20 In the absence of PLA2G2A (as in our mouse model), PLA2G5 might be a major contributor to the composite sPLA2 activity that circulates in plasma20 and could thus contribute to inflammation in Mmp2 deficiency, at least as a minor component. Indeed, showing that PLA2G5 could contribute to exacerbated inflammation characteristic of Mmp2 deficiency, PLA2G5 expression knock‐down with siRNA (Figure 12A) caused significant downregulation of inflammatory markers in Mmp2−/− but not in WT cell cultures (Figure 12B).
Figure 12.
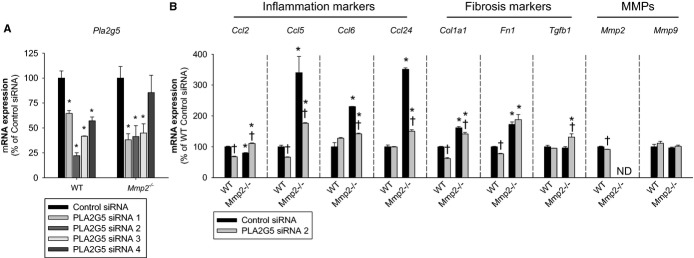
Evidence of proinflammatory actions of PLA2G5 in Mmp2‐deficient cells. A, qRT‐PCR analysis of Pla2g5 expression in mouse fibroblasts treated with siRNA sequences to inhibit the expression of PLA2G5. Sequence 2 was selected for further analyses. Pools of n=4 were measured in triplicate. B, qRT‐PCR analysis of inflammatory marker genes, fibrosis marker genes, and MMPs in fibroblasts treated with siRNA to inhibit the expression of PLA2G5. Pools of n=4 were measured in triplicate. *P≤0.05 vs WT+control siRNA. †P≤0.05 vs Mmp2−/−+control siRNA. All pairwise multiple comparisons vs control group (Holm–Sidak method). MMP indicates matrix metalloproteinase; ND, not detected; qRT‐PCR, quantitative real‐time polymerase chain reaction; WT, wild‐type.
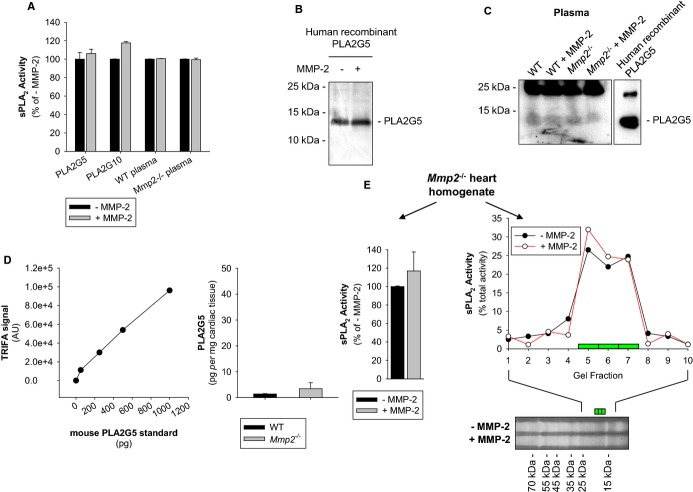
Studies summarized in Figure 13 show that recombinant human MMP‐2 did not cleave or inactivate recombinant human PLA2G5 or PLA2G10. Addition of recombinant human MMP‐2 to plasma ex vivo also did not inhibit plasma sPLA2 activity. To examine the possible involvement of plasma factors, like activators or inhibitors of sPLA2, in the elevation of sPLA2 in Mmp2 deficiency, we further spiked plasma of WT or Mmp2−/− mice with recombinant human PLA2G5 for 4 to 16 hours. We were unable to detect any loss of the plasma PLA2G5 immunoreactivity or enzymatic activity (Figure 13A through 13C). Western immunoblotting and time‐resolved fluorescence immunoassay revealed similar yet very small amounts of PLA2G5 in plasma and cardiac homogenates from WT and Mmp2−/− mice; these data were in line with the notion that MMP‐2 deficiency does not regulate sPLA2 expression (Figure 13C and 13D). Overall, the data obtained by targeting PLA2G5 showed that MMP‐2 does not cleave or inactivate sPLA2 in plasma, suggesting that MMP‐2 might regulate sPLA2 activity in tissue. Addition of recombinant human MMP‐2 to Mmp2−/− heart homogenates had no effect on the activity or the molecular weight of cardiac sPLA2 (Figure 13E). Therefore, we hypothesized that MMP‐2 inhibits the release of active sPLA2 from the heart and tested this through the ex vivo analysis of myocardial releasates (Figure 14A).
Figure 13.
Effect of MMP‐2 on sPLA2 activity. A, Recombinant human PLA2G5 or PLA2G10 (4 μmol/L) were incubated for 4 hours with or without MMP‐2 (400 nmol/L). Plasma of WT or Mmp2−/− mice was incubated for 16 hours with or without MMP‐2 (100 nmol/L). Results shown are representative of 3 separate experiments. B, Western blot with PLA2G5 antibody showing lack of cleavage of recombinant human PLA2G5 by MMP‐2. C, Determination of PLA2G5 content in mouse plasma by Western blot with PLA2G5‐specific antibodies. The analysis suggests similar yet negligible PLA2G5 immunoreactivity in plasma of WT and Mmp2−/− mice. Note that PLA2G5 immunoreactivity was not affected by incubation with MMP‐2. D, Determination of PLA2G5 in the heart of WT and Mmp2−/− mice by time resolved fluorescence immunoassay (TRFIA). The analysis suggests similar yet negligible PLA2G5 immunoreactivity in heart homogenates of either WT or Mmp2−/− mice; this was in line with the qRT‐PCR data for Pla2g5 (shown in Figure 11B). E, MMP‐2 does not cleave cardiac sPLA2. Lack of effect of incubation with recombinant human MMP‐2 on the sPLA2 from Mmp2−/− heart homogenates (pool of n=3 hearts). Heart homogenate was incubated with or without MMP‐2 (400 nmol/L) for 4 hours. Left: Total sPLA2 activity. Right: Electrophoretic migration of sPLA2 activity on Tricine‐SDS‐PAGE (scatter plot). MMP indicates matrix metalloproteinase; qRT‐PCR, quantitative real‐time polymerase chain reaction; sPLA2, secreted phospholipase A2; WT, wild‐type.
Figure 14.
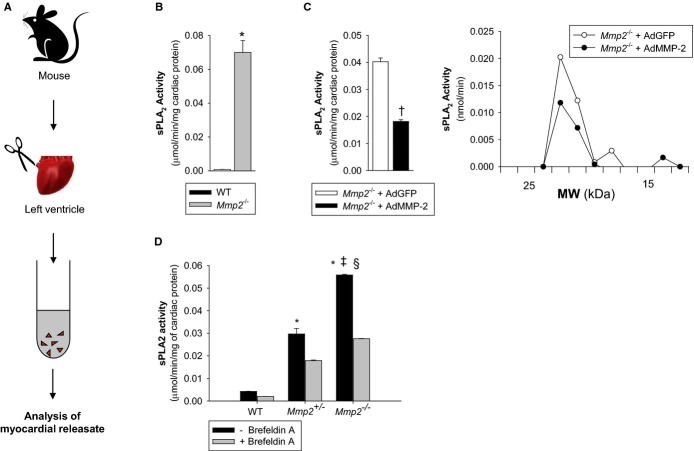
MMP‐2 is a negative regulator of the release of active sPLA2 from the myocardium. A, Scheme of experimental protocol. B, sPLA2 activity released ex vivo from WT or Mmp2−/− myocardial specimens. *P≤0.05 vs WT, t test. C, Left: sPLA2 activity released ex vivo from Mmp2−/− myocardial specimens from mice transduced with either AdMMP‐2 or AdGFP. †P≤0.05 vs Mmp2−/−+AdGFP, t test. Right: To measure the molecular weight of released sPLA2, the myocardial releasates were pooled and resolved by nonreducing SDS‐PAGE followed by sPLA2 activity assay. Data corresponds to an incubation time of 40 minutes for Mmp2−/− mice transduced with AdGFP or AdMMP‐2. D, sPLA2 activity released from ex vivo heart sections in the absence and presence of Brefeldin A (70 μmol/L), a drug that blocks the endoplasmic reticulum to Golgi transition along the classical secretory pathway. ‡P≤0.05 vs Mmp2+/−−Brefeldin A. §P≤0.05 vs Mmp2−/−+Brefeldin A. All pairwise multiple‐comparison procedures (Holm–Sidak method). Data correspond to an incubation time of 100 minutes for nontransduced WT and Mmp2−/− mice. AdGFP indicates green fluorescent protein–expressing adenovirus; AdMMP, MMP‐2‐encoding adenovirus; MMP, matrix metalloproteinase; MW, molecular weight; SDS‐PAGE, sodium‐dodecylsulfate polyacrylamide gel electrophoresis; sPLA2, secreted phospholipase A2; WT, wild‐type.
MMP‐2 Is a Negative Regulator of the Release of Active sPLA2 From the Myocardium
Freshly isolated specimens of Mmp2−/− myocardium released dramatically more sPLA2 activity ex vivo than did similar specimens isolated from WT mice (Figure 14B). This release of sPLA2 activity from Mmp2−/− hearts, as well as the expression of inflammatory markers, was reduced by adenovirus‐mediated expression of human MMP‐2 (Figure 14C). The secreted enzyme was equal in molecular weight (Figure 14C) to the sPLA2 isolated from cardiac homogenates (Figure 1B), suggesting that the active sPLA2 in the heart does not require proteolytic maturation for secretion to occur. MMP‐2 haploinsufficiency caused a reduction in ex vivo myocardial sPLA2 release (Figure 14D). In the presence of Brefeldin A, an inhibitor of the classic secretory pathway, the myocardial release of sPLA2 was significantly blunted (Figure 14D).
The MMP‐2 Inhibitor Doxycycline Replicates Aspects of the Phenotype of Mmp2 Deficiency
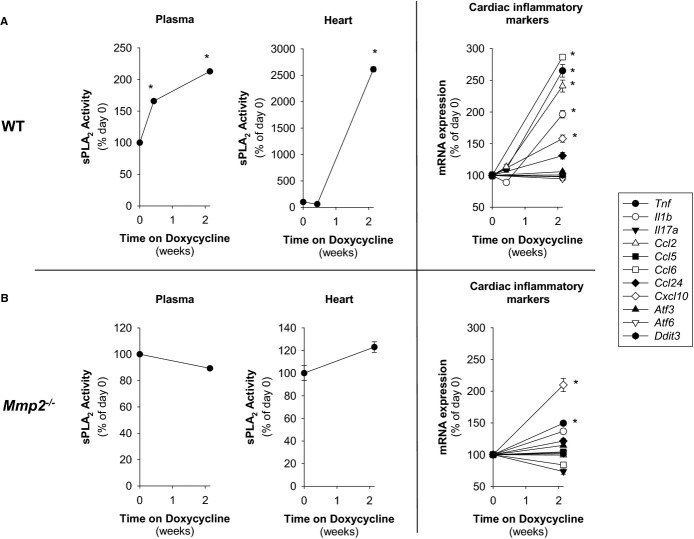
The experiment described in Figure 4A revealed that doxycycline administration can induce an MMP‐2 deficiency phenotype in WT mice. To further characterize whether doxycycline‐induces phenotypic transformation in the heart, we administered doxycycline (50 mg/kg per day for 2 weeks) to WT mice and correlated their plasma and cardiac sPLA2 levels to cardiac inflammatory marker expression (Figure 15A). We used Mmp2−/− mice to define whether doxycycline induction of sPLA2 was due to MMP‐2 inhibition (Figure 15B). We made 3 important observations. (1) Doxycycline upregulated plasma and cardiac sPLA2 activity only in Mmp2+/+ mice, not in Mmp2−/− mice. (2) The elevation of plasma sPLA2 activity by doxycycline preceded that of cardiac sPLA2. (3) Induction of proinflammatory genes in the heart was detectable only after cardiac sPLA2 activity was significantly elevated (as assessed by qRT‐PCR analysis of Ccl2, Tnf, Il1b, Ccl6, and Cxcl10) (Figure 15B).
Figure 15.
The MMP‐2 inhibitor doxycycline replicates aspects of the phenotype of Mmp2 deficiency. A, Analysis of WT mice administered doxycycline (50 mg/kg per day) for 0 to 15 days (2 weeks). (n=4 mice per time point). The sPLA2 activity of pools was measured in duplicate. *P≤0.05 vs day 0. One‐way repeated‐measures ANOVA. All pairwise multiple‐comparison procedures (Student‐Newman‐Keuls method). qRT‐PCR analysis of indicated inflammatory markers was conducted for individual mice. *P≤0.05 vs day 0. All pairwise multiple comparisons (Holm–Sidak method). B, Analysis of Mmp2−/− mice administered doxycycline (50 mg/kg per day) for 0 to 15 days (2 weeks). (n=3 per time point). The sPLA2 activity of pools was measured in duplicate. qRT‐PCR analysis of indicated inflammatory markers was conducted for individual mice. *P≤0.05 vs day 0. All pairwise multiple comparisons (Holm–Sidak method). ANOVA indicates analysis of variance; MMP, matrix metalloproteinase; qRT‐PCR, quantitative real‐time polymerase chain reaction; sPLA2, secreted phospholipase A2; WT, wild‐type.
Therefore, when MMP‐2 is deficient, the heart is a major source of highly active sPLA2. Plasma sPLA2 activity may result from a systemic contribution, including the heart. Development of cardiac inflammation may require prior induction of cardiac sPLA2 activity.
Emerging Functions of the MMP‐2/sPLA2 Axis in Cardiovascular Regulation
Direct evidence of the proinflammatory potential of cardiac sPLA2
Treatment of mice with varespladib decreased the otherwise elevated levels of PGE2 (Figure 16A) and Tnf, Il1b, Ccl2, Ccl5, Ccl6, and Ccl24 mRNA in the heart of Mmp2−/− mice (Figure 16B).
Figure 16.
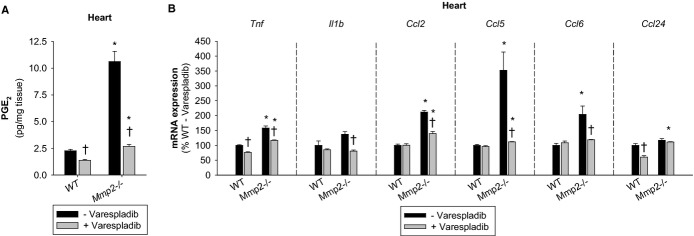
Emerging functions of the MMP‐2/sPLA2 axis in cardiac inflammatory gene expression. A, Cardiac PGE2 concentrations in mice treated with or without varespladib (10 mg/kg per day for 2 days). Pools of n=3 mice per genotype were measured in duplicate. B, qRT‐PCR of inflammatory marker genes in mice treated with or without varespladib (10 mg/kg per day for 2 days). n=3 mice per genotype. *P≤0.05 vs WT−Varespladib (control). †P≤0.05 vs Mmp2−/−−Varespladib (control). All pairwise multiple comparisons vs control group (Holm–Sidak method). MMP indicates matrix metalloproteinase; PGE2, prostaglandin E2; qRT‐PCR, quantitative real‐time polymerase chain reaction; sPLA2, secreted phospholipase A2; WT, wild‐type.
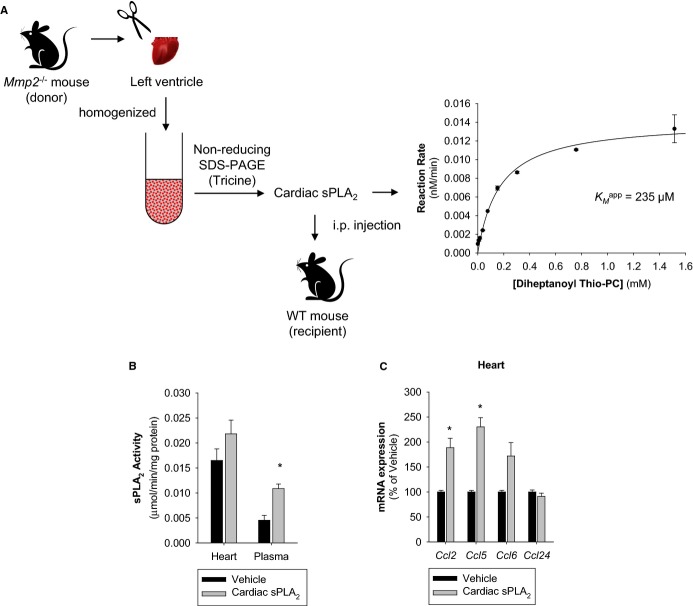
To confirm that cardiac sPLA2 is indeed sufficient to cause inflammation, we purified the active enzyme from Mmp2−/− hearts by using a preparative zymographic technique and injected it into WT mice (Figure 17A). The purified enzyme, which had the same KMapp as the heart homogenate and plasma sPLA2s, had the opposite effect to sPLA2 inhibition with varespladib: it increased plasma sPLA2 activity and caused cardiac inflammation in recipient WT mice (Figure 17B and 17C).
Figure 17.
Proof‐of‐principle of the proinflammatory activity of cardiac sPLA2. A, Strategy for preparative isolation of cardiac sPLA2 from Mmp2−/− mice (donor). Hearts were excised and homogenized, cardiac proteins (from 500 mg tissue) were resolved by nonreducing SDS‐PAGE. After reverse staining, protein eluted from the gel was assessed for sPLA2 activity, and the active fraction was filter‐sterilized and injected into WT mice (recipient). An aliquot was used for enzyme kinetic analysis to confirm its identity (ie, same KMapp) as the sPLA2 found in cardiac homogenates and plasma. B, sPLA2 activity in the plasma and hearts of WT mice injected with cardiac sPLA2 isolated from Mmp2−/− mice. n=3 WT mice. *P≤0.05 vs vehicle, t test. C, qRT‐PCR of inflammatory marker genes in WT mice injected with cardiac sPLA2 isolated from Mmp2−/− mice. n=3 WT mice. *P≤0.05 vs vehicle, t test. MMP indicates matrix metalloproteinase; qRT‐PCR, quantitative real‐time polymerase chain reaction; SDS‐PAGE, sodium‐dodecylsulfate polyacrylamide gel electrophoresis; sPLA2, secreted phospholipase A2; WT, wild‐type.
Role of the MMP‐2/sPLA2 axis in cardiac metabolic homeostasis
Metabolic and inflammatory processes intercept at the level of several transcription factors such as liver X receptor and sterol‐regulatory binding proteins (encoded by Nr1h3 and Srebf, respectively).21–22 To determine whether the MMP‐2/sPLA2 axis impacted cardiac lipid metabolic as well as proinflammatory gene expression, we conducted qRT‐PCR analysis of these transcription factors in mice administered the sPLA2 inhibitor varespladib. Analysis of lipid metabolic genes by qRT‐PCR indicated cardiac metabolic dysregulation in Mmp2−/− mice. This dysregulation was normalized by varespladib, showing that the MMP‐2/sPLA2 axis influences cardiac lipid metabolism as well as inflammation (Figure 18A).
Figure 18.
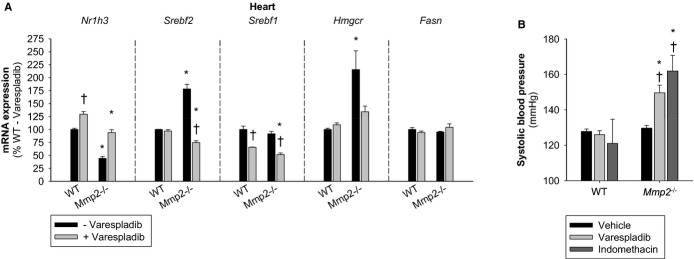
Emerging functions of the MMP‐2/sPLA2 axis in cardiac lipid metabolic gene expression and blood pressure homeostasis. A, qRT‐PCR of key lipid metabolic genes in mice treated with or without varespladib (10 mg/kg per day for 2 days). n=3 mice per genotype. B, Systolic blood pressure of mice orally administered vehicle (soybean oil, 130 μL, 2 doses), varespladib (10 mg/kg per day, 130 μL, 2 doses), or indomethacin (10 mg/kg per day, 130 μL, 1 dose). Blood pressure was measured 4 hours after administration of the last dose. n=3 mice per genotype. *P≤0.05 vs WT−varespladib (control). †P≤0.05 vs Mmp2−/−−vehicle/untreated (control). All pairwise multiple comparisons vs control group (Holm–Sidak method). MMP indicates matrix metalloproteinase; qRT‐PCR, quantitative real‐time polymerase chain reaction; sPLA2, secreted phospholipase A2; WT, wild‐type.
The MMP‐2/sPLA2/cyclooxygenase axis regulates blood pressure homeostasis
Cyclooxygenase‐derived prostanoids are major regulators of systemic blood pressure in both normal physiology and pathophysiology, with some prostaglandins being vasoconstrictive (eg, thromboxane A2), whereas others are vasodilatory (eg, PGE2 and PGI2).23 Treatment with indomethacin (to inhibit cyclooxygenase‐dependent production of eicosanoids) or varespladib at a regimen that inhibited PGE2 (Figure 16A) triggered acute hypertension selectively in Mmp2−/−, but not in WT, mice (Figure 18B).
Discussion
We discovered MMP‐2 to be a major negative regulator of systemic sPLA2, which, in Mmp2 deficiency, leads to massive levels of sPLA2 activity in the myocardium and plasma. As a result, Mmp2‐deficient mice exhibit dysregulation of inflammatory and lipid metabolic genes in the heart, exacerbated fever, and a compensatory reliance on eicosanoids for blood pressure homeostasis. We found the heart to be a major source of circulating sPLA2, which can be readily unmasked when MMP‐2 deficiency is caused by either pharmacological inhibition or gene knock‐out.
To validate the conclusions of this research, we combined integrative physiology studies with biochemical analysis including the development of an approach for high‐resolution 1‐step isolation of bioactive sPLA2 from complex biological sources such as heart homogenates and plasma. To demonstrate the unique relevance of MMP‐2, we conducted parallel studies of Mmp2−/−, Mmp7−/−, Mmp9−/−, and haploinsufficient (Mmp2+/−) mice. To exclude that the observed regulation of systemic sPLA2 was a mere compensatory result of chronic Mmp gene deficiency, we further examined mice treated with the FDA‐approved broad‐spectrum MMP inhibitor doxycycline. We show that this latter model replicates many traits of Mmp2 gene deficiency, yet doxycycline failed to elevate plasma and cardiac sPLA2 in Mmp2−/− mice, revealing a highly specific and dominant role of MMP‐2 in the regulation of systemic sPLA2. To firmly establish the validity of these findings, we further performed gain‐of‐function studies with WT and Mmp2−/− mice (and cell cultures) involving either transduction of human MMP‐2 with an adenoviral vector. These series of complementary and redundant studies unambiguously demonstrated the existence of a novel heart‐centric MMP‐2/sPLA2 signaling axis that modulates cardiac inflammation and metabolism, systemic blood pressure homeostasis, and fever.
We have not yet discovered the mechanism by which MMP‐2 inhibits sPLA2 activation and systemic release. Although we have data pointing to inflammation being secondary to high sPLA2 in Mmp2 deficiency, further studies are warranted to firmly establish whether preexisting inflammation in Mmp2‐deficient mice can be causative of high sPLA2 levels (Figure 19).
Figure 19.
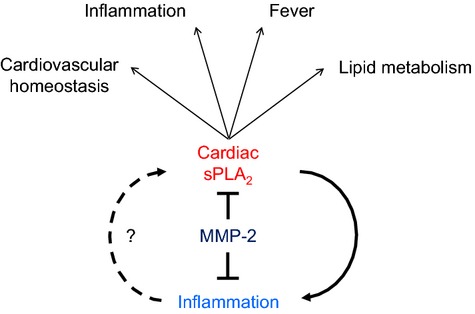
A heart‐centric MMP‐2/sPLA2 axis may modulate blood pressure homeostasis, inflammatory and metabolic gene expression, as well as the severity of fever. Future research should establish whether cardiac sPLA2 is activated secondary to preexisting inflammation or if it is the primary cause of the inflammatory state characteristic of MMP‐2 gene deficiency. MMP indicates matrix metalloproteinase; sPLA2, secreted phospholipase A2.
Phospholipase A2 was discovered in the 19th century as a major active component in snake venom. The subsequent identification of sPLA2 in mammalian systems began with pancreatic PLA2G1B and then PLA2G2A from human synovial fluid. Members of the family of secreted PLA2 enzymes depend on calcium for activity and have 6 to 8 disulfide bridges and a histidine‐aspartate dyad that catalyzes the hydrolysis of water, which enables a nucleophilic attack that releases fatty acids from the sn‐2 position of membrane glycerophospholipids.16 Secretory PLA2 isoenzymes have a low molecular mass of ≈16 kDa.
Despite catalyzing the same biochemical reaction, it is increasingly evident that sPLA2s play nonredundant, complex roles in inflammation and metabolism that depend on the target tissue and their relative affinity for specific cell membrane phospholipids; the latter being a function of the head group and the specific fatty acid in the sn‐2 position. PLA2G2A, PLA2G5, and PLA2G10, which are considered to be the major contributors to plasma PLA2 activity in humans,20 have different induction profiles; for example, PLA2G5 is induced by a Western diet, whereas PLA2G2A is induced by proinflammatory stimuli (eg, bacterial LPS).24 While PLA2G3 and PLA2G5 have the potential to promote atherogenesis,16 PLA2G10 may limit atherogenesis.25
Like PLA2G5, PLA2G2E is diet inducible. In obesity, PLA2G2E and PLA2G5 are both upregulated in adipose tissue, where PLA2G2E alters lipoprotein phospholipids and facilitates lipid accumulation in adipose tissue and liver and PLA2G5 counteracts adipose tissue inflammation and hyperlipidemia.17 Similarly, in the context of immune complex–induced arthritis, where PLA2G2A is a mediator, PLA2G5 may protect against inflammation by promoting immune complex clearance.26
Our findings position the heart at the center of a paradigm where cardiac sPLA2 acts in a hormonal fashion to affect inflammatory and metabolic gene expression, fever, and blood pressure homeostasis under negative regulation by MMP‐2, and possibly other MMPs (as demonstrated by the lesser effects of MMP‐7 and MMP‐9). PLA2G5 is the major sPLA2 expressed in the heart. Our siRNA studies conducted with PLA2G5‐expressing Mmp2+/+ and Mmp2−/− cell cultures indicated that this sPLA2 contributes to the quantitative trait of MMP‐2 deficiency in a significant way. However, we cannot exclude that MMP regulation is a general mechanism controlling the release of multiple sPLA2 isoforms (not just PLA2G5) from tissue. This notion is supported by our enzyme inhibition studies with indoxam. Further, when MMP‐2 is inhibited with doxycycline, plasma sPLA2 increases earlier than cardiac sPLA2 activity, which ultimately precedes cardiac inflammation. Overall, the data point to MMP‐2 being a major negative regulator for systemic release of active sPLA2 from tissue.
All human and mouse sPLA2s have an N‐terminal signal peptide16 and are, therefore, predicted to be secreted through the conventional endoplasmic reticulum–Golgi pathway. To date, little is known about how sPLA2 secretion is regulated. Nothing is known about how cardiac sPLA2 activity affects the heart or the impact of the cardiac released sPLA2 on systemic homeostasis. We have found that the release of sPLA2 from myocardium occurs rapidly (reaching significance within 2 hours) and does not require stimulation. Myocardial sPLA2 release was unmistakably elevated in Mmp2−/− mice but inhibited in WT and in Mmp2−/− mice forced to express human MMP‐2. Confirming that MMP‐2 negatively regulates sPLA2 secretion in vivo, we found that plasma sPLA2 is upregulated in Mmp2−/− mice as well. Moreover, the KMapp of the cardiac sPLA2 was equal to that of the plasma sPLA2, indicating that the heart is a major source of systemic released sPLA2. Using a pharmacological inhibitor of MMP‐2 and adenovirus‐mediated overexpression of human MMP‐2, we further showed that MMP‐2–mediated proteolysis is necessary for suppressing the release of active sPLA2 from tissue into the circulation and MMP‐2 does not act via presecretion or postsecretion degradation of sPLA2 or by regulating sPLA2 transcription. Our data support the notion that sPLA2 acts in a paracrine or endocrine fashion to alter the expression of inflammatory and lipogenic genes in target tissues, including the heart. Like sPLA2, MMP‐2 is secreted into the circulation and may thereby affect sPLA2 and the inflammatory and metabolic states in other tissues.
This research suggests the intriguing possibility that the heart is involved in promotion of fever by way of being a major source of sPLA2. To date, sPLA2s have not been solidly implicated in fever.15 In fact, in our experiments, varespladib did not alleviate LPS‐induced fever in WT mice. However, we found that in Mmp2−/− mice, varespladib prevented fever, showing that sPLA2 does indeed contribute to fever if MMP‐2 is lacking. A PubMed search of (Varespladib OR LY315920 OR LY333013 OR A‐001 OR A‐002 OR S‐3013 OR S‐5920) AND fever did not yield any results as of January 20, 2015. The current data strongly support the notion that sPLA2 is a regulator of fever when MMP‐2 is lacking and reveal a novel role of MMP‐2 in this process.
Human MMP‐2 gene deficiency causes osteolysis/arthritis syndrome and cardiac defects, with severe symptoms presenting from early childhood.2 Individuals with Winchester and Torg arthritic syndromes lack a functional MMP‐2.27 How lack of MMP‐2 causes these syndromes is unknown. Conceivably, excessive sPLA2 activity in MMP‐2–deficient individuals promotes inflammation that could exacerbate bone degeneration and fever, predispose to cardiac dysfunction, and cause hypertension in response to nonsteroidal anti‐inflammatory drugs, as shown here for indomethacin. The powerful effects of varespladib in Mmp2−/− mice suggest that this drug could be an effective antipyretic and anti‐inflammatory treatment in human MMP‐2 deficiency.
Preclinical studies indicated that pan‐sPLA2 inhibition with varespladib could reduce atherosclerotic lesions in rodents.28 Varespladib effectively decreases total cholesterol, atherogenesis, and aneurysm formation in apolipoprotein E mouse models.3 Early trials in humans yielded promising results for varespladib as a treatment in coronary heart disease. The PLASMA (Phospholipase Levels and Serological Markers of Atherosclerosis) and PLASMA II trials indicated that varespladib was effective at reducing the plasma concentrations of PLA2G2A, LDL cholesterol, and non‐HDL cholesterol.29–30 Those studies provided the rationale and impetus for the VISTA‐16 (Vascular Inflammation Suppression to Treat Acute Coronary Syndrome in 16 weeks) trial, which tested the potential cardiovascular benefits of varespladib given for 16 weeks to acute coronary syndrome patients. In the VISTA‐16 trial, varespladib decreased the levels of plasma LDL cholesterol and C‐reactive protein but caused an increase in myocardial infarction events, resulting in termination of the trial.31 These adverse clinical results reflect the different roles of sPLA2 isoforms, such that pan‐sPLA2 inhibition does not exclusively produce effects beneficial in the treatment of coronary heart disease.25 However, it remains to be determined whether administration of sPLA2 inhibitors (specifically, varespladib) is beneficial in specific sets of patients for which no treatments are currently available. Such is the case of individuals with MMP‐2 deficiency.
In cardiac disease pathogenesis, MMP‐2 activity has been suggested to be protective in some contexts and deleterious in others. Some deleterious effects of MMP‐2 have been explained by excessive cleavage of extracellular matrix.6–7,32 A protective role of MMP‐2 expression is the facilitation of inflammatory cell egression from inflamed tissue as has been shown for cardiac interstitial tissue in a model of cytokine‐induced cardiomyopathy32 and lung parenchyma in allergen‐induced lung inflammation.5 MMP‐2 may also be beneficial by degrading chemokines, such as monocyte‐chemoattractant protein (MCP)‐3, to dampen tissue inflammation8; this mechanism may be relevant in viral cardiomyopathy.33
The possibility of a bidirectional interaction between proinflammatory mediators and sPLA2 isoenzymes and the emerging role of metalloproteinases, such as MMP‐2, in the control of this interaction is a fascinating new avenue for research. However, our findings are consistent with inflammation being secondary to high sPLA2 activity in MMP‐2 deficiency. Complementary experiments support this notion: (1) Mmp2−/− mice exhibited signs of liver inflammation (Figure 6) but hepatic sPLA2 activity was normal (Figure 9). (2) Inhibition of MMP‐2 by doxycycline induced a cardiac proinflammatory phenotype in WT mice reminiscent of Mmp2 deficiency. However, this cardiac proinflammatory phenotype was observed only in mice exhibiting sufficiently elevated cardiac sPLA2 (Figure 15). (3) Administration of cardiac sPLA2 microisolated from Mmp2−/− hearts triggered cardiac inflammation in recipient WT mice (Figure 17). (4) LPS, which is a proinflammatory stimulus, did not acutely increase sPLA2 activity in WT or Mmp2−/− mice, at least within the time frame (ie, 5 hours) studied (Figures 6 through 8). Further, addition of a proinflammatory cytokine regulated by MMP‐2 cleavage (MCP‐3) to Mmp2+/+ and Mmp2−/− fibroblast cultures for up to 48 hours did not elevate sPLA2 activity (unpublished observations) (Evan Berry, BSc, and Carlos Fernandez‐Patron, PhD, unpublished data, 2014).
Therefore, the data point to MMP‐2 acting as a negative regulator of the activation of a mixture of intracellular sPLA2s, which are proinflammatory, at least under the set of conditions studied. Once secreted from tissue, these sPLA2s may act in paracrine fashion. The interactions between MMP‐2 and sPLA2 likely form an autoregulatory loop. Indeed, previous research suggests that at least some sPLA2s (eg, PLAG1B) may stimulate pro‐MMP‐2 to MMP‐2 activation through the PI3K/AKT pathway.20
Negative regulation of the systemic release of sPLA2, a family of enzymes with complex protective and deleterious actions on inflammation and metabolic pathways, may further help to explain the complexity of MMP‐2 (and MMP inhibitors) actions in the cardiovascular system and their dependence on the pathophysiological context.
In short, a heart‐centric MMP‐2/sPLA2 axis may modulate blood pressure homeostasis, inflammatory and metabolic gene expression, and fever. Because MMP‐2 is a target of doxycycline, this discovery may help better understand the spectrum of actions of this FDA‐approved MMP inhibitor (and those of other MMP‐2 inhibitors, as well). Suppression of sPLA2 activity by MMP‐2 is a general mechanism likely affecting many members of the sPLA2 family; perhaps, including novel (ie, nonclassic) members of the sPLA2 family, for which detection tools might need to be developed. Further studies will be required to validate the role of each sPLA2 in inflammation and fever. Through the suppression of multiple sPLA2 isoforms, MMP‐2 could play as yet unsuspected roles in pain and in the pathogenesis of metabolic and inflammatory conditions such as arthritis, atherosclerosis, obesity, asthma, and anaphylaxis where MMP‐2 and sPLA2 are implicated, but their interaction remains unsuspected.
Supplementary Material
Appendix Supplementary Figures S1-S4.
Sources of Funding
Dr Berry was supported by the Queen Elizabeth II Graduate Scholarship Program from the Faculty of Medicine and Dentistry of the University of Alberta, and Dr Wang was supported by a graduate studentship award from Alberta Innovates Health Solutions. This study was supported by operating grants from the Canadian Institutes of Health Research and Natural Sciences and Engineering Research Council of Canada (to Dr Fernandez‐Patron).
Disclosures
None.
References
- Lijnen HR, Collen D. Matrix metalloproteinase system deficiencies and matrix degradation. Thromb Haemost. 1999; 82:837-845. [PubMed] [Google Scholar]
- Tuysuz B, Mosig R, Altun G, Sancak S, Glucksman MJ, Martignetti JA. A novel matrix metalloproteinase 2 (MMP2) terminal hemopexin domain mutation in a family with multicentric osteolysis with nodulosis and arthritis with cardiac defects. Eur J Hum Genet. 2009; 17:565-572. [DOI] [PMC free article] [PubMed] [Google Scholar]
- Fraser H, Hislop C, Christie RM, Rick HL, Reidy CA, Chouinard ML, Eacho PI, Gould KE, Trias J. Varespladib (A‐002), a secretory phospholipase A(2) inhibitor, reduces atherosclerosis and aneurysm formation in ApoE(‐/‐) mice. J Cardiovasc Pharmacol. 2009; 53:60-65. [DOI] [PubMed] [Google Scholar]
- Mosig RA, Dowling O, DiFeo A, Ramirez MC, Parker IC, Abe E, Diouri J, Aqeel AA, Wylie JD, Oblander SA, Madri J, Bianco P, Apte SS, Zaidi M, Doty SB, Majeska RJ, Schaffler MB, Martignetti JA. Loss of MMP‐2 disrupts skeletal and craniofacial development and results in decreased bone mineralization, joint erosion and defects in osteoblast and osteoclast growth. Hum Mol Genet. 2007; 16:1113-1123. [DOI] [PMC free article] [PubMed] [Google Scholar]
- Greenlee KJ, Werb Z, Kheradmand F. Matrix metalloproteinases in lung: multiple, multifarious, and multifaceted. Physiol Rev. 2007; 87:69-98. [DOI] [PMC free article] [PubMed] [Google Scholar]
- Matsusaka H, Ide T, Matsushima S, Ikeuchi M, Kubota T, Sunagawa K, Kinugawa S, Tsutsui H. Targeted deletion of matrix metalloproteinase 2 ameliorates myocardial remodeling in mice with chronic pressure overload. Hypertension. 2006; 47:711-717. [DOI] [PubMed] [Google Scholar]
- Matsumura S, Iwanaga S, Mochizuki S, Okamoto H, Ogawa S, Okada Y. Targeted deletion or pharmacological inhibition of MMP‐2 prevents cardiac rupture after myocardial infarction in mice. J Clin Invest. 2005; 115:599-609. [DOI] [PMC free article] [PubMed] [Google Scholar]
- Rodriguez D, Morrison CJ, Overall CM. Matrix metalloproteinases: what do they not do? New substrates and biological roles identified by murine models and proteomics. Biochim Biophys Acta. 2010; 1803:39-54. [DOI] [PubMed] [Google Scholar]
- Engelking LJ, Kuriyama H, Hammer RE, Horton JD, Brown MS, Goldstein JL, Liang G. Overexpression of Insig‐1 in the livers of transgenic mice inhibits SREBP processing and reduces insulin‐stimulated lipogenesis. J Clin Invest. 2004; 113:1168-1175. [DOI] [PMC free article] [PubMed] [Google Scholar]
- Schagger H. Tricine‐SDS‐PAGE. Nat Protoc. 2006; 1:16-22. [DOI] [PubMed] [Google Scholar]
- Fernandez‐Patron C, Castellanos‐Serra L, Rodriguez P. Reverse staining of sodium dodecyl sulfate polyacrylamide gels by imidazole‐zinc salts: sensitive detection of unmodified proteins. Biotechniques. 1992; 12:564-573. [PubMed] [Google Scholar]
- Oslund RC, Cermak N, Gelb MH. Highly specific and broadly potent inhibitors of mammalian secreted phospholipases A2. J Med Chem. 2008; 51:4708-4714. [DOI] [PMC free article] [PubMed] [Google Scholar]
- Ou J, Tu H, Shan B, Luk A, DeBose‐Boyd RA, Bashmakov Y, Goldstein JL, Brown MS. Unsaturated fatty acids inhibit transcription of the sterol regulatory element‐binding protein‐1c (SREBP‐1c) gene by antagonizing ligand‐dependent activation of the LXR. Proc Natl Acad Sci USA. 2001; 98:6027-6032. [DOI] [PMC free article] [PubMed] [Google Scholar]
- Montuschi P, Barnes PJ, Roberts LJ., II Isoprostanes: markers and mediators of oxidative stress. FASEB J. 2004; 18:1791-1800. [DOI] [PubMed] [Google Scholar]
- Ivanov AI, Romanovsky AA. Prostaglandin E2 as a mediator of fever: synthesis and catabolism. Front Biosci. 2004; 9:1977-1993. [DOI] [PubMed] [Google Scholar]
- Lambeau G, Gelb MH. Biochemistry and physiology of mammalian secreted phospholipases A2. Annu Rev Biochem. 2008; 77:495-520. [DOI] [PubMed] [Google Scholar]
- Sato H, Taketomi Y, Ushida A, Isogai Y, Kojima T, Hirabayashi T, Miki Y, Yamamoto K, Nishito Y, Kobayashi T, Ikeda K, Taguchi R, Hara S, Ida S, Miyamoto Y, Watanabe M, Baba H, Miyata K, Oike Y, Gelb MH, Murakami M. The adipocyte‐inducible secreted phospholipases PLA2G5 and PLA2G2E play distinct roles in obesity. Cell Metab. 2014; 20:119-132. [DOI] [PMC free article] [PubMed] [Google Scholar]
- Van Hul M, Lijnen HR. A functional role of gelatinase A in the development of nutritionally induced obesity in mice. J Thromb Haemost. 2008; 6:1198-1206. [DOI] [PubMed] [Google Scholar]
- Miki Y, Yamamoto K, Taketomi Y, Sato H, Shimo K, Kobayashi T, Ishikawa Y, Ishii T, Nakanishi H, Ikeda K, Taguchi R, Kabashima K, Arita M, Arai H, Lambeau G, Bollinger JM, Hara S, Gelb MH, Murakami M. Lymphoid tissue phospholipase A2 group IID resolves contact hypersensitivity by driving antiinflammatory lipid mediators. J Exp Med. 2013; 210:1217-1234. [DOI] [PMC free article] [PubMed] [Google Scholar]
- Choi YA, Lim HK, Kim JR, Lee CH, Kim YJ, Kang SS, Baek SH. Group IB secretory phospholipase A2 promotes matrix metalloproteinase‐2‐mediated cell migration via the phosphatidylinositol 3‐kinase and Akt pathway. J Biol Chem. 2004; 279:36579-36585. [DOI] [PubMed] [Google Scholar]
- Hotamisligil GS. Inflammation and metabolic disorders. Nature. 2006; 444:860-867. [DOI] [PubMed] [Google Scholar]
- Ma KL, Ruan XZ, Powis SH, Chen Y, Moorhead JF, Varghese Z. Inflammatory stress exacerbates lipid accumulation in hepatic cells and fatty livers of apolipoprotein E knockout mice. Hepatology. 2008; 48:770-781. [DOI] [PubMed] [Google Scholar]
- Hristovska AM, Rasmussen LE, Hansen PB, Nielsen SS, Nusing RM, Narumiya S, Vanhoutte P, Skott O, Jensen BL. Prostaglandin E2 induces vascular relaxation by E‐prostanoid 4 receptor‐mediated activation of endothelial nitric oxide synthase. Hypertension. 2007; 50:525-530. [DOI] [PubMed] [Google Scholar]
- Rosengren B, Peilot H, Umaerus M, Jonsson‐Rylander AC, Mattsson‐Hulten L, Hallberg C, Cronet P, Rodriguez‐Lee M, Hurt‐Camejo E. Secretory phospholipase A2 group V: lesion distribution, activation by arterial proteoglycans, and induction in aorta by a Western diet. Arterioscler Thromb Vasc Biol. 2006; 26:1579-1585. [DOI] [PubMed] [Google Scholar]
- Ait‐Oufella H, Herbin O, Lahoute C, Coatrieux C, Loyer X, Joffre J, Laurans L, Ramkhelawon B, Blanc‐Brude O, Karabina S, Girard CA, Payre C, Yamamoto K, Binder CJ, Murakami M, Tedgui A, Lambeau G, Mallat Z. Group X secreted phospholipase A2 limits the development of atherosclerosis in LDL receptor‐null mice. Arterioscler Thromb Vasc Biol. 2013; 33:466-473. [DOI] [PubMed] [Google Scholar]
- Boilard E, Lai Y, Larabee K, Balestrieri B, Ghomashchi F, Fujioka D, Gobezie R, Coblyn JS, Weinblatt ME, Massarotti EM, Thornhill TS, Divangahi M, Remold H, Lambeau G, Gelb MH, Arm JP, Lee DM. A novel anti‐inflammatory role for secretory phospholipase A2 in immune complex‐mediated arthritis. EMBO Mol Med. 2010; 2:172-187. [DOI] [PMC free article] [PubMed] [Google Scholar]
- Zankl A, Pachman L, Poznanski A, Bonafe L, Wang F, Shusterman Y, Fishman DA, Superti‐Furga A. Torg syndrome is caused by inactivating mutations in MMP2 and is allelic to NAO and Winchester syndrome. J Bone Miner Res. 2007; 22:329-333. [DOI] [PubMed] [Google Scholar]
- Shaposhnik Z, Wang X, Trias J, Fraser H, Lusis AJ. The synergistic inhibition of atherogenesis in ApoE‐/‐ mice between pravastatin and the sPLA2 inhibitor varespladib (A‐002). J Lipid Res. 2009; 50:623-629. [DOI] [PMC free article] [PubMed] [Google Scholar]
- Rosenson RS, Elliott M, Stasiv Y, Hislop C. Randomized trial of an inhibitor of secretory phospholipase A2 on atherogenic lipoprotein subclasses in statin‐treated patients with coronary heart disease. Eur Heart J. 2011; 32:999-1005. [DOI] [PubMed] [Google Scholar]
- Rosenson RS, Hislop C, McConnell D, Elliott M, Stasiv Y, Wang N, Waters DD. Effects of 1‐H‐indole‐3‐glyoxamide (A‐002) on concentration of secretory phospholipase A2 (PLASMA study): a phase II double‐blind, randomised, placebo‐controlled trial. Lancet. 2009; 373:649-658. [DOI] [PubMed] [Google Scholar]
- Nicholls SJ, Kastelein JJ, Schwartz GG, Bash D, Rosenson RS, Cavender MA, Brennan DM, Koenig W, Jukema JW, Nambi V, Wright RS, Menon V, Lincoff AM, Nissen SE. Varespladib and cardiovascular events in patients with an acute coronary syndrome: the VISTA‐16 randomized clinical trial. JAMA. 2014; 311:252-262. [DOI] [PubMed] [Google Scholar]
- Matsusaka H, Ikeuchi M, Matsushima S, Ide T, Kubota T, Feldman AM, Takeshita A, Sunagawa K, Tsutsui H. Selective disruption of MMP‐2 gene exacerbates myocardial inflammation and dysfunction in mice with cytokine‐induced cardiomyopathy. Am J Physiol Heart Circ Physiol. 2005; 289:H1858-H1864. [DOI] [PubMed] [Google Scholar]
- Westermann D, Savvatis K, Lindner D, Zietsch C, Becher PM, Hammer E, Heimesaat MM, Bereswill S, Volker U, Escher F, Riad A, Plendl J, Klingel K, Poller W, Schultheiss HP, Tschope C. Reduced degradation of the chemokine MCP‐3 by matrix metalloproteinase‐2 exacerbates myocardial inflammation in experimental viral cardiomyopathy. Circulation. 2011; 124:2082-2093. [DOI] [PubMed] [Google Scholar]
Associated Data
This section collects any data citations, data availability statements, or supplementary materials included in this article.
Supplementary Materials
Appendix Supplementary Figures S1-S4.


