

Abstract
The primary microstructural unit of cortical bone, the secondary osteon or Haversian system, is widely assumed to have a cylindrical shape. It is generally accepted that osteons are roughly circular in cross-section and deviations from circularity have been attributed to deviations from longitudinal orientation. To our knowledge this idealized geometric relationship, which assumes osteons are perfect cylinders, has not been rigorously explored. As such, we sought to explore two research questions: (i) Does the orientation of osteons in 3D explain variation in shapes visualized in 2D? (ii) Can differences in osteon 3D orientation explain previously reported age-related differences observed in their 2D cross-sectional shape (e.g. more circular shape and decreased area with age)? To address these questions we utilized a combination of 2D histology to identify osteon shape and superimposed micro-computed tomography data to assess osteon orientation in 3D based upon the osteonal canal. Shape was assessed by the inverse of Aspect Ratio (On.AspR−1, based on a fitted ellipse) – which ranged from 0 (infinitely elongated shape) to 1 (perfectly circular). A sample (n = 27) of human female anterior femoral cortical bone samples from across the human lifespan (20–87 years) were included in the analysis, which involved 1418 osteons. The overall mean measure of On.AspR−1 was 0.703 (1.42 Aspect Ratio). Mean osteon orientation was 79.1° (90° being longitudinal). While we anticipated a positive relation between orientation and On.AspR−1, we found the opposite – a weak negative correlation (with more oblique 3D osteon alignment, the 2D shape became more circular as reflected by increased On.AspR−1). When analysis of covariance was performed with age and orientation as covariates, the negative relation with orientation was replaced by a significant relation with age alone. This relation with age accounted for 41% of the variation of On.AspR−1. The results revealed that osteons, on average, are not circular in cross-section and that 3D orientation cannot account for deviation from circular shape. Osteons thus are strictly speaking not cylinders, as they tend to have elliptical cross-sections. We observed that osteons did become less elliptical in cross-section with age independent of orientation – suggesting this is a real change in morphology.
Keywords: age-related differences, cortical bone, histology, micro-computed tomography, osteon geometry, osteon orientation
Introduction
The primary microstructural unit of cortical bone in many terrestrial vertebrates, including humans, is the secondary osteon, or Haversian system. These structures, composed of lamellar bone surrounding a central (Haversian) canal, are formed through remodeling of pre-existing cortical bone tissue. The remodeling process is carried out by basic multicellular units (BMUs) composed of osteoclasts (bone-resorbing cells) and osteoblasts (bone-forming cells) working together to first remove and then reform a portion of the cortex. The end result is a new secondary osteon superimposed onto the existing microarchitecture. Creation through the replacement of existing bone classifies these osteons as ‘secondary’ and distinguishes them from ‘primary’ osteons, which are formed around vascular spaces incorporated into the bone during growth. For the sake of simplicity we utilize the generic term ‘osteon’ to refer to secondary osteons throughout this article. Remodeling represents a means of adapting microarchitecture after bone growth is complete and also serves to repair microdamage. Disruptions in this process lie at the root of metabolic bone diseases such as osteoporosis and, as such, inquiry into the spatio-temporal regulation of BMU activity represents a significant pursuit within bone biology.
The morphology of completed osteons provides clues as to the ‘behavior’ of the BMUs which created them. Despite this potential, the direct study of osteon morphology has been relatively limited and largely focused on size, as reflected by two-dimensional (2D) cross-sectional area. Numerous studies have reported a decline in osteon area with advancing age in humans (Currey, 1964; Kerley, 1965; Singh & Gunberg, 1970; Iwamoto et al. 1978; Martin et al. 1980; Thompson & Galvin, 1983; Burr et al. 1990; Ericksen, 1991; Yoshino et al. 1994; Watanabe et al. 1998; Ural & Vashishth, 2006; Britz et al. 2009). Those studies which have examined aspects of shape, including Currey (1964) and Britz et al. (2009), have reported that osteons become rounder (more circular) with age in both men and women. A key consideration for any morphological analysis of osteons, however, is the potential of artifacts introduced by the plane of sectioning (Pazzaglia et al. 2012). Thus, although the relations between changes in osteon size and shape associated with aging in human bone remain unclear, these changes could be linked to changes in three-dimensional (3D) orientation. If one assumes that osteons are perfect 3D cylinders, then deviations from circular shapes in 2D cross-section must be the product of non-perpendicular sectioning. Extrapolating from this, we have previously asserted that the minor axis of a fitted ellipse should be the preferred measure of osteon diameter as it, unlike the major axis, is independent of 3D orientation (Britz et al. 2009). This, of course, is predicated on the assumption that osteons are cylindrical (Fig.1) – an assumption that provides a starting point for analysis but certainly overlooks well demonstrated variation in osteon forms (Robling & Stout, 1999). To our knowledge, the hypothesis that 2D osteon morphology is the product of 3D orientation has not been quantitatively tested in a rigorous manner.
Figure 1.

Relation between 3D orientation and cross-sectional shapes (dark gray) for structures with circular (left) and elliptical cross-sections (right). Cross-sections for structures rotated 45° from longitudinal (Z-Axis) about the about the X-axis (up), Y-axis (right) and both X- and Y-axes (up and right). For the circular cross-sectioned structure (left) the minor axis of the cross-sections matches the diameter of the longitudinal cylinder and a perpendicular section (no rotation) creates the roundest form. For the elliptical cross-section (right), the dimensions of both the major and minor axes vary depending on the direction of rotation and the roundest shape does not occur at the perpendicular section.
Pazzaglia et al. (2012) have recently utilized the angle of the osteonal canal in a section to achieve a localized measure of orientation. This was used to identify osteons sectioned perpendicularly (e.g. ≥ 70°) for morphological assessment. A greater appreciation of 3D osteonal morphology can be achieved by serial sectioning and the few studies which have employed this approach have invariably revealed highly complex structures with osteons forming numerous interconnections and varying in size and shape along their lengths (Cohen & Harris, 1958; Tappen, 1977; Kragstrup & Melsen, 1983; Stout et al. 1999; Skedros et al. 2007). The tedious nature of serial sectioning, however, has limited the number of studies in this area and most observations related to morphology and osteon orientation have been qualitative in nature.
The increasing availability and resolution of micro-computed tomography (micro-CT) has made it possible to efficiently visualize and quantify the osteonal canals and BMU-related resorption spaces within cortical bone (Mohsin et al. 2002; Cooper et al. 2003, 2004, 2006, 2007; Tanck et al. 2006; Basillais et al. 2007; Arhatari et al. 2011), including assessment of canal orientation (Britz et al. 2012). Analysis of cortical canals has become an established approach, but visualization of osteon boundaries (e.g. by variation in mineralization and/or cement lines) remains challenging for absorption-based micro-CT. The few imaging-based studies to have reconstructed osteons in 3D have thus relied upon phase-contrast methods using conventional (Arhatari et al. 2011) or synchrotron-based micro-CT imaging (Cooper et al. 2011). As noted for serial section-based studies, imaging-based studies have also revealed great complexity and variation in 3D osteon structure – but they, too, have yielded largely qualitative insights so far. While the potential exists to exploit more fully phase-contrast micro-CT to achieve quantitative 3D analysis of osteon morphology, in its current state, conventional micro-CT complements rather than supersedes histological methods. Thus, in this study we employed a fusion of these approaches (ground section histology and conventional micro-CT) to address questions related to osteon 3D orientation and its impact on morphology observed in 2D sections. Specifically, we sought to address two research questions: (i) Does the orientation of osteons in 3D explain variation in shapes visualized in 2D? (ii) Can differences in osteon 3D orientation explain previously reported age-related differences observed in their 2D cross-sectional shape?
Material and methods
Samples
Human anterior femoral specimens, obtained from the Melbourne Femur Collection (MFC), were employed in this study. These specimens were collected from the Victorian Institute of Forensic Medicine (VIFM) in Melbourne, Australia. The anterior femoral shaft is the most commonly studied site for age-dependent study of bone in the forensic sciences and physical anthropology and thus this site has been the focus of our group’s research. The MFC comprises samples derived from individuals whose families have provided informed consent at the time of autopsy. Next-of-kin questionnaires were completed and those individuals who were known to have medical conditions and/or to have taken medications that affect bone were not sampled (Clement, 2005). A sub-sample of 32 female (20–87 years) right femoral-midshaft specimens, collected from 1990 to 2003, were included in the current study. The samples were selected such that the entire age range was well represented [summary statistics are presented in the results (including Table1) and the age distribution is visually depicted in Fig. 7]. This study was conducted with ethics approval from the VIFM (EC26/2000), the University of Melbourne (HREC 980139), and the University of Saskatchewan (Bio# 08-46). At the time of collection the samples were preserved in 70% ethanol. They were subsequently desiccated – the state they remained in for scanning and ground section production. The specimens were originally obtained as complete diaphyseal rings and subsequently cut into 5-mm blocks from the anterior region to facilitate micro-CT imaging (Cooper et al. 2006, 2007).
Table 1.
Summary statistics calculated from the mean values for each of the individual specimens (n = 27)
| Parameter | Units | Minimum | Maximum | Mean | Median | SD |
|---|---|---|---|---|---|---|
| Age | Years | 20 | 86 | 51 | 55 | 22.4 |
| On.Ar | μm2 | 20 686 | 69 794 | 43 769 | 44 939 | 11 000 |
| On.AspR−1 | − | 0.592 | 0.770 | 0.703 | 0.715 | 0.049 |
| On.Orient | Degrees | 74.1 | 83.9 | 79.1 | 79.1 | 2.3 |
Micro-CT
3D reconstructions were created from micro-CT data of the samples collected previously (Cooper et al. 2006, 2007). These scans were created using a SkyScan 1072 micro-CT scanner (Kontich, Belgium) at 7-μm isotropic voxel size. The scan protocol included a rotation through 180° at a rotation step of 0.23°. The X-ray settings were standardized to 100 kVp and 100 μA with an exposure time of 7.5 s per frame. To reduce noise, six-frame averaging was used. Each scan took approximately 12 h and generated 1024 serial sections enabling 3D reconstruction of the canal networks. This protocol did not result in any apparent changes to the sample, including discoloration, as has been demonstrated in synchrotron-based studies (Richards et al. 2012).
Histology
Ground sections were created using a technique adapted from Frost’s basic method (1958), which does not require embedding in resin. A single section was targeted to the center of each of the scanned regions for each sample. The sections were cut to approximately 150 μm using a diamond wafer saw (Isomet 1000; Buehler, Lake Bluff, IL, USA), hand-lapped to 50 μm with 2000 Grit 3M sandpaper, and ultrasonicated for several minutes to remove sandpaper residue. Section thickness was confirmed by a hand-held micrometer. The unstained sections were then mounted and imaged at 20× magnification with a modular microscopy platform (Motic BA400; Motic Group Co., Ltd, Richmond, BC, Canada) using standard and plane polarized light (Fig.2). Using a motorized microscope stage (OptiscanII; Prior Scientific, Rockland, MA, USA) tiled images of the entire section were created with the attached PaxCam2 and complementary image database software V.7.4 (MIS, Inc., Villa Park, IL, USA). The tiled images, with a pixel size of 0.88 μm, were imported into the IMAGEJ software platform (v.1.43u; NIH, http://rsb.info.nih.gov/ij/) and manually matched to the closest corresponding micro-CT image.
Figure 2.

Composite image showing a combined light micrograph (left) and polarized light image (right) both captured at 20× magnification. The manually created osteon outlines are depicted in red.
Osteon segmentation
Circular regions of interest (ROI) 3 mm in diameter were placed adjacent to the periosteal surface of the histological images. This location reflected the data available from previous study of these specimens (Cooper et al. 2006, 2007) – a location chosen to correspond with the majority of age-dependent studies of femoral histomorphometry. Individual secondary osteons, identified by the appearance of a cement line, were outlined using the IMAGEJ built-in ROI manager and an interactive LCD tablet (Cintiq 12WX, Wacom Co. Ltd, Japan). Osteons were outlined according to the approach described by Britz et al. (2009). In brief, all osteons with a clearly defined cement line were outlined. Osteons where ≥ 75% of the cement line was visible and where the remainder could be reasonably inferred were included. Osteons near the boundaries of the ROI were only outlined if the entire canal was within the ROI and ≥ 75% of the cement line was visible.
To assess the shape of osteons we employed the inverse of Aspect Ratio (On.AspR−1). Aspect Ratio, as assessed by IMAGEJ, provides a measure of how circular an object is from the ratio between the major and minor axes of the ellipse of best fit. Aspect Ratio varies from 1 to infinity; to generate a measure with a defined range we utilized the inverse of Aspect Ratio, resulting in a scale of 0 (infinitely elongated) to 1 (perfectly circular):
In the thesis from which the data of the current manuscript are derived (Hennig, 2012), Osteon Circularity (On.Circ) was also assessed [4 π(Area/Perimeter2)]. This measure has not been included here as it was found to be highly sensitive to subtle differences in perimeter (see Discussion) and has almost no relationship with 3D orientation in the range of values which we studied (see that predicted for On.AspR−1 below).
Three-dimensional orientation analysis
For 3D assessment of osteon orientation, 100 serial micro-CT images straddling the single image which best fit the ground section were used to create volumetric 3D reconstructions in AMIRA 5.3.3 (Visage Imaging Inc., Berlin, Germany). In general, matching the two datasets was straightforward, requiring only minor modifications to orientation. However, as the original micro-CT data were collected in 2005, there were instances where a match could not be achieved. As the samples were subsequently prepared for higher resolution synchrotron-based imaging (Carter et al. 2013) they were unavailable for re-scanning. Thus in cases where a match could not be achieved, the samples were excluded from analysis (n = 4).
At a 7-μm thickness per image, the total depth (z-dimension) of the 3D reconstruction was 700 μm. This size was chosen to ensure that the length of the canals was more than twice the approximate diameter of an average osteon, i.e. 200–300 μm (Bousson et al. 2000; Robling et al. 2006; Britz et al. 2009). The 3D reconstructions of the osteonal canals were skeletonized and manually edited using the filament editor extension in AMIRA. The skeletonized data were then processed via a custom IMAGEJ macro which straightened the lines and then calculated their orientation. This measure, classified as Osteon Orientation (On.Orient), was assessed relative to the horizontal plane of the sample. The On.Orient values of individual canals were initially measured with both positive and negative values (−90° to 90°) and then absolute values were taken (0° to 90°) providing a generalized reflection of longitudinal (90°) vs. transverse (0°) orientation. Co-registration (superimposition) of the 2D ground section images with the volumetric and skeletonized datasets (Fig.3) enabled direct matching of the 2D and 3D measures for each osteon. To eliminate potential sources of error in the editing process of the canal skeletons, osteons were excluded from analysis if the corresponding straightened line did not run through the outline of the matching osteon (e.g. it exhibited significant curvature). Osteons with more than one line passing through were included if the secondary line was clearly distinguished from the primary line as a branching point. In such cases, the primary line was used in the analysis. Finally, any canal with an orientation of less than 45° was considered a Volkmann’s canal and was excluded from analysis.
Figure 3.

Fusion of 3D micro-CT and 2D histology for the circular region of interest studied (3 mm diameter; 0.7 mm height). Panels A and B show 3D surface reconstructions of osteonal canals traversing a polarized light histology image in superior (A) and oblique (B) view. Panel C demonstrates the raw skeletons of the 3D canals and panel D depicts the straightened skeletons utilized to assess On.Orient.
Statistical analysis
All statistics were calculated using SPSS 19.0 (SPSS Inc., Chicago, IL, USA). Significance level for all analyses was set to the standard P < 0.05. A plot of raw measures (including multiple osteons per individual sample) was employed to qualitatively examine the overall relation between On.AspR−1 and orientation. The mean values for the measures were then calculated for individual specimens and employed for quantitative analyses. Kolmogorov–Smirnov one-sample tests determined that the collection of mean values from the specimens were normally distributed for all measures. Regression analysis was used to examine the relation between orientation and osteon geometry. Assuming osteons are perfectly cylindrical, their 3D orientation (On.Orient) will have a non-linear relation with shape (On.AspR−1). As osteons deviate from a longitudinal orientation (On.Orient = 90°) in 3D their cross-sections in 2D should become less circular and have a lower On.AspR−1 (see Fig.4; details of this idealized geometric relation are provided in Supporting Information Appendix S1).
Figure 4.

The idealized geometric relation between On.Orient and On.AspR−1, assuming osteons are perfect cylinders. On.Orient values range from 0 (parallel to the long axis of the osteon) to 1 (perpendicular to the long axis of the osteon). Representative osteon outlines for 22.5°, 45°, 67.5° and 90° are depicted from bottom left to top right.
As the predicted relation is roughly linear in the range of 45–90° we employed linear regression for analysis. To investigate whether orientation, independent of age, could explain the differences in osteon geometric measures, univariate analysis of covariance used to investigate On.AspR−1 with age and osteon orientation simultaneously considered as covariates. Partial eta-squared ( ) values were used to describe the relative amount of variance accounted for by each covariate.
Results
Summary statistics
Of the 32 histological sections, four could not be closely matched to a micro-CT slice and were excluded from the analysis. An additional specimen (from a 24-year-old) was excluded as it contained only primary osteons and thus no measurements could be performed. Thus, 27 specimens from individuals ranging in age from 20 to 86 years (mean 50.46 years; SD 22.17 years) were included in our analysis (n = 9: 20–29 years; n = 6: 30–49 years; n = 9: 60–79 years; n = 3: 80–86 years). In total, 1418 osteons were assessed. Summary statistics of 2D and 3D measures are provided in Table1.
Does the orientation of osteons in 3D (On.Orient) explain variation in shapes visualized in 2D (On.AspR−1)?
The data from the individual osteons represented in Fig.5 illustrate the relation between On.Orient and the two shape measures. The mean values from each individual specimen are represented in Fig.6. Based upon the mean values, a significant negative correlation was found between On.Orient and On.AspR−1 (P = 0.020, r2 = 0.198). Thus the pattern observed did not correspond with the predicted relation.
Figure 5.

Scatterplot of the individual osteon On.AspR−1 against On.Orient for the pooled sample of all individual osteon measurements. The idealized geometric relation from Fig.4 is superimposed for reference.
Figure 6.

Scatterplot of mean On.AspR−1 against On.Orient. The x-axis has been scaled to reflect On.Orient values ranging from 45° to 90°. The regression line represents a significant negative linear relation between On.AspR−1 and On.Orient (P = 0.02). The idealized geometric relation from Fig.4 is superimposed for reference.
Can differences in osteon 3D orientation (On.Orient) explain previously reported age-related differences observed in their 2D cross-sectional shape (On.AspR−1)?
The linear relation between the mean On.Ar and On.AspR−1 is depicted in Fig.7. A significant positive linear relation was observed between age and On.AspR−1 (P < 0.001, r2 = 0.481), but not On.AR (P = 0.327). Univariate analysis of covariance revealed that only age had a significant relation with On.AspR−1 (Table2), accounting for 41% of its variation.
Figure 7.
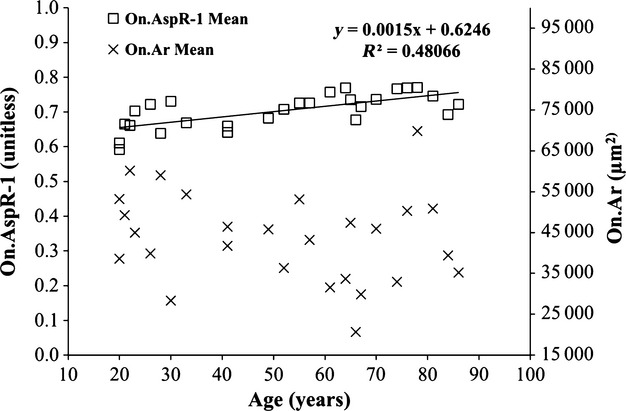
Composite scatterplot of the On.AspR−1 (left axis) and On.Ar (right axis) vs. age. The regression line represent a significant linear relation between On.AspR−1 and age (P < 0.001). No significant relation was observed between On.Ar and age.
Table 2.
Summary statistics for univariate analysis of covariance for On.AspR−1. β represents the regression coefficient for each parameter.  is the proportion of total variance accounted for by each variable
| Shape measure | r 2 | Parameter | β | Sig |

|
|---|---|---|---|---|---|
| On.AspR−1 | 0.523 | Intercept | 1.003 | 0.001 | 0.381 |
| Age | 0.001 | < 0.001 | 0.405 | ||
| On.Orient | −0.005 | 0.159 | 0.081 |
Discussion and Conclusion
Our first research question aimed to determine whether osteons, in an idealized sense, are true cylinders and thus 2D shape and 3D orientation would be linked via a predictable geometric relationship. The large range of variation in individual osteon shapes, despite similar orientation (Fig.5), does not match well with our predictions. Moreover, we found a negative relation between On.AspR−1 and orientation (Fig.6) – the opposite to what we predicted. How such a relation might exist will be addressed in more detail below. These results contradict the assertion that osteons are ‘perfect’ cylinders. Indeed, looking at the mean value (Table1) for On.AspR−1 (0.703) the mean On.Orient value would have to be approximately 45° to account for these shapes. It is well recognized that osteons are generally longitudinally oriented – a pattern believed to reflect dominant loading trajectories (Black et al. 1974; Lanyon & Bourn, 1979; Heřt et al. 1994; Petrtýl et al. 1996; Rho et al. 1998; Nomura et al. 2003; Ascenzi et al. 2004). Our current results are consistent with these past findings as our experimentally measured mean On.Orient value was 79° (or only 11° away from longitudinal).
As 3D orientation failed to predict 2D shape, the answer to our second question (Can orientation explain age-related differences in shape measures?) seems to be a clear ‘No’. That said, further dissecting the issue of age-related differences in our sample yielded some interesting results. We did not observe the decline in On.Ar with age frequently described in the literature (Currey, 1964; Kerley, 1965; Singh & Gunberg, 1970; Iwamoto et al. 1978; Martin et al. 1980; Thompson & Galvin, 1983; Burr et al. 1990; Ericksen, 1991; Yoshino et al. 1994; Watanabe et al. 1998; Ural & Vashishth, 2006; Britz et al. 2009). However, we did observe the expected increase in circularity as reflected by increasing On.AspR−1 (Fig.7). Indeed, age accounted for 48% of the variance observed for On.AspR−1. When age and On.Orient were included in a combined analysis as covariates, the significant negative relation between On.Orient and the On.AspR−1 was eliminated in favor of a positive relation with age alone. This raises the question of whether a relation exists between age and On.Orient. If osteons become smaller and more circular with age due to changes in orientation, then the corollary that orientations become more longitudinal is required. Our results demonstrated no significant relation between age and On.Orient; although the relation approached significance (P = 0.059) it was negative, suggesting a trend towards more oblique canals with age. Increasingly oblique canal orientation with age is, by itself, not an unexpected finding and can be explained through the increasing complexity of the canal network due to remodeling. As remodeling progresses, older osteons are partially overlapped by newer osteons (Currey, 1964; Kerley, 1965; Robling & Stout, 2000; Cooper et al. 2003, 2007; Robling et al. 2006). Subsequently, the coalescence between the individual canals increases, resulting in a progressive increase in branching and interconnectivity within the canal networks (Cooper et al. 2003, 2007; Chen et al. 2010). This increased interconnectivity would certainly play a role in making the overall mean orientation more oblique.
While it may be expected that osteon orientation becomes more oblique with age, how then can this be reconciled with decreases in osteon area (reported by others) and the increase in the circular appearance of osteons with age? Two mechanisms are possible. The first is simply that osteons could vary in shape across the lifespan, with younger individuals having more elliptical (less circular) cross-sections. The second is that changes in orientation could be interacting with elliptical cross-sections to generate the appearance of more circular cross-sections (see Fig.1). If orientation of the osteon becomes more oblique in a direction parallel to the major axis of its elliptical cross-section, then the observed shape in 2D will be even more elongated. Conversely, if the orientation is made perpendicular to the major axis, the observed shape can actually be more circular (Fig.1). Notably, the smallest area will always be produced by a cross-section perpendicular to the long axis of the osteon, whether that cross-section is circular or elliptical. Examining the sum of our evidence, the first possibility – that of actual change in the size and shape of osteons – seems the most plausible means of explaining age-related change in osteon morphology. This brings the discussion full circle, as it hints at changes in the behavior of the BMUs which form the osteons. Why do osteons have elliptical cross-sections in the young and why does this change with age? What stimuli create this pattern and what can be inferred overall about the spatio-temporal regulation of BMU activity? Skedros et al. (1994) qualitatively observed that osteons in the compressive cortex of the artiodactyl calcaneus were smaller and more circular compared with those in the tensile cortex. Inspection of their Fig.1 (Skedros et al. 1994) also suggests that endosteal osteons are more irregular in shape relative to more circular osteons located near the periosteum. Both of these observations tie osteon morphology to mechanical milieu – strain mode in the case of compression vs. tension and strain magnitude in terms of the periosteal vs. endosteal regions. The question of whether the age-related changes observed in our study are similarly linked to mechanical phenomena remains unanswered and warrants further study. Placed into the context of the findings of Skedros and colleagues, we hypothesize that the smaller and rounder osteons observed with advancing age are the product of increased strain (van Oers et al. 2008) brought about by cortical thinning, increased porosity, and/or increased body mass later in life. A potential confounder that would need to be considered in testing such a hypothesis is that increased porosity may simply present smaller volumes of bone for remodeling (Seeman, 2013) – leading to smaller complete osteons (e.g. those which we targeted) over time. Another caveat is that, unlike the artiodactyl calcaneus, the human femur has a high complexity of loading (Skedros, 2012) and thus relations between osteon orientation and morphology may be complex, particularly so for the anterior femur (Heřt et al. 1994; Petrtýl et al. 1996). That said, a complex region provides the ideal opportunity to test the global assumption that osteon orientation and cross-sectional shape are directly linked in a predictive mathematical relation.
Regarding the issue of osteon ‘diameter’ our results suggest this term may not be appropriate, as osteons are, on average, not cylinders with circular cross-sections. Thus, we recommend reporting major and minor axes of fitted ellipses. The minor axis remains a more stable measure in light of changing 3D orientation but it cannot be assumed to be entirely independent of it. An important caveat to the practice of fitting ellipses is that some osteons have highly irregular cross-sectional geometries and thus an ellipse, in some instances, may not be a good approximation of the real shape. Notably, such irregular shapes also pose difficulties for other measures of shape (e.g. On.Circ).
Osteon circularity (On.Circ), as noted in Material and Methods, provides an alternative descriptor of shape which several studies have employed (Crescimanno & Stout, 2012; Dominguez & Crowder, 2012; Skedros et al. 2014), including a previous publication from our group (Britz et al. 2009) and the thesis from which this work is derived (Hennig, 2012). We have excluded this measure as it exhibited almost no relation to On.Orient in the range of 45–90° and the results (mean 0.793) were relatively low when compared with other published findings for human bone with values generally in the 0.85–0.94 range (Crescimanno & Stout, 2012; Dominguez & Crowder, 2012; Skedros et al. 2014). Most significantly, this measure was low relative to a similar study published by members of our own group utilizing the same skeletal collection, for which mean On.Circ was found to be 0.881 (Britz et al. 2009). The explanation for this discrepancy lies in the use of perimeter (squared) in the calculation of On.Circ. Small differences/errors in perimeter can have a significant impact of On.Circ while having little-to-no impact on On.Ar and On.AspR−1. Inspection of the outlines from our higher resolution (current = 0.88 μm vs. Britz et al. = 2.54 μm) images revealed two things. First, the outlines were more precise, with more variation in their outlines (increasing perimeter). Secondly, we found that the data for the current study frequently had minor errors which occurred at the closure points for the circular outlines – resulting in additional pixels being counted as part of the perimeter. Analysis of a sub-set of outlines (n = 428 osteons) revealed that smoothing them to eliminate these errors produced large changes in On.Circ (9.8% difference) but had almost no effect on On.AR (0.5% difference) or On.AspR−1 (0.2% difference). Indeed, the raw and smoothed measures were highly correlated for On.AR and On.AspR−1 with r2 values of 1 and slopes of 1, whereas On.Circ had a weaker correlation (r2 = 0.798, slope of 0.922). Thus, we have great confidence in the variables presented here but have reservations about On.Circ and thus have not included it. Notably, the mean On.AspR−1 from Britz and colleagues’ 87 specimens (including males and females) was 0.710 (data not published). This value corresponds very closely with the 0.703 from the current study.
Our study has a number of limitations. First, we focused our analysis on a single skeletal site (anterior femoral diaphysis) and on a single sex (female). That said, it has been observed previously that On.Circ increases in both female and male human femoral cortical bone with age (Britz et al. 2009). Secondly, the validity of our measure of osteon shape is, to a degree, reliant upon the osteons having regular elliptical shapes. Thus, the discrepancy between our predictions and observations may, in part, be related to irregular osteon shapes. As already noted, ellipse fitting (as used for On.AspR−1) may not always provide a good representation of shape. Finally, we started from the assumption that osteons are cylinders and thus evaluated On.Orient as a single angle – reflecting alignment (or lack thereof) with the longitudinal Z-axis of the sample. Three-dimensional orientation cannot be fully reflected by a single angle and thus we are unable to determine to what degree increasing On.AspR−1 with age might be related to the phenomenon demonstrated in Fig.1, where oblique angles perpendicular to the major axis actually increase circularity in cross-section.
To our knowledge this study is unique in its fusion of high resolution 3D imaging with 2D histological data to examine osteon geometry. Although we have compared histology and micro-CT in the past for validation purposes (Cooper et al. 2004), the application here sought to generate quantitative data from images which were superimposed (co-registered) in 3D. We believe this combined, complementary approach holds great potential for the further investigation of cortical bone microarchitecture, enabling ‘targeted’ histology. A great potential also exists to exploit more fully synchrotron-based micro-CT with the capacity for high resolution and alternative contrast mechanisms (e.g. phase contrast) in order to directly evaluate osteon geometry in 3D (Cooper et al. 2011). A greater appreciation of the morphological variation of osteons opens the door to more rigorous exploration of what factors underpin this variation. This includes the spatio-temporal regulation of BMUs and thus the coordination of the remodeling process in general. The age-dependent differences in osteon shape reaffirmed in our analysis also suggest that such measures may have some value in histomorphometric age estimation – a potential that warrants further exploration.
Acknowledgments
We are grateful to the mortuary staff and the staff of the Donor Tissue Bank of the Victorian Institute of Forensic Medicine for their assistance in the collection of this series of bone specimens, and we are particularly grateful to the next-of-kin of the donors for permission to remove bone for research purposes. We are also grateful for the detailed and constructive comments of the reviewers, which have substantively improved this manuscript. Support for this research was provided by the Natural Sciences and Engineering Research Council of Canada via a Discovery Grant to D.M.L.C. and a scholarship to C.H. D.M.L.C. is further supported by the Canadian Foundation for Innovation and Canada Research Chairs program.
Supporting Information
Appendix S1. Relation between Inverse Aspect Ratio and 3D orientation.
References
- Arhatari BD, Cooper DM, Thomas CD, et al. Imaging the 3D structure of secondary osteons in human cortical bone using phase-retrieval tomography. Phys Med Biol. 2011;56:5265–5274. doi: 10.1088/0031-9155/56/16/012. [DOI] [PubMed] [Google Scholar]
- Ascenzi MG, Andreuzzi M, Kabo JM. Mathematical modeling of human secondary osteons. Scanning. 2004;26:25–35. doi: 10.1002/sca.4950260105. [DOI] [PubMed] [Google Scholar]
- Basillais A, Bensamoun S, Chappard C, et al. Three-dimensional characterization of cortical bone microstructure by microcomputed tomography: validation with ultrasonic and microscopic measurements. J Orthop Sci. 2007;12:141–148. doi: 10.1007/s00776-006-1104-z. [DOI] [PubMed] [Google Scholar]
- Black J, Mattson R, Korostoff E. Haversian osteons: size, distribution, internal structure, and orientation. J Biomed Mater Res. 1974;8:299–319. doi: 10.1002/jbm.820080512. [DOI] [PubMed] [Google Scholar]
- Bousson V, Bergot C, Meunier A, et al. CT of the middiaphyseal femur: cortical bone mineral density and relation to porosity. Radiology. 2000;217:179–187. doi: 10.1148/radiology.217.1.r00se11179. [DOI] [PubMed] [Google Scholar]
- Britz HM, Thomas CD, Clement JG, et al. The relation of femoral osteon geometry to age, sex, height and weight. Bone. 2009;45:77–83. doi: 10.1016/j.bone.2009.03.654. [DOI] [PubMed] [Google Scholar]
- Britz HM, Jokihaara J, Leppanen OV, et al. The effects of immobilization on vascular canal orientation in rat cortical bone. J Anat. 2012;220:67–76. doi: 10.1111/j.1469-7580.2011.01450.x. [DOI] [PMC free article] [PubMed] [Google Scholar]
- Burr DB, Ruff CB, Thompson DD. Patterns of skeletal histologic change through time: comparison of an archaic native American population with modern populations. Anat Rec. 1990;226:307–313. doi: 10.1002/ar.1092260306. [DOI] [PubMed] [Google Scholar]
- Carter Y, Thomas CD, Clement JG, et al. Femoral osteocyte lacunar density, volume and morphology in women across the lifespan. J Struct Biol. 2013;183:519–526. doi: 10.1016/j.jsb.2013.07.004. [DOI] [PubMed] [Google Scholar]
- Chen H, Zhou X, Shoumura S, et al. Age and gender-dependent changes in three-dimensional microstructure of cortical and trabecular bone at the human femoral neck. Osteoporos Int. 2010;21:627–636. doi: 10.1007/s00198-009-0993-z. [DOI] [PubMed] [Google Scholar]
- Clement JG. The Melbourne femur collection: the gift of tissue underpins important medical and forensic research. VIFM Rev. 2005;3:7–11. [Google Scholar]
- Cohen J, Harris WH. The three-dimensional anatomy of haversian systems. J Bone Joint Surg Am. 1958;40-A:419–434. [PubMed] [Google Scholar]
- Cooper DML, Turinsky AL, Sensen CW, et al. Quantitative 3D analysis of the canal network in cortical bone by micro-computed tomography. Anat Rec B New Anat. 2003;274B:169–179. doi: 10.1002/ar.b.10024. [DOI] [PubMed] [Google Scholar]
- Cooper DML, Matyas JR, Katzenberg MA, et al. Comparison of microcomputed tomographic and microradiographic measurements of cortical bone porosity. Calcif Tissue Int. 2004;74:437–447. doi: 10.1007/s00223-003-0071-z. [DOI] [PubMed] [Google Scholar]
- Cooper DML, Thomas CDL, Clement JG, et al. Three-dimensional microcomputed tomography imaging of basic multicellular unit-related resorption spaces in human cortical bone. Anat Rec A Discov Mol Cell Evol Biol. 2006;288A:806–816. doi: 10.1002/ar.a.20344. [DOI] [PubMed] [Google Scholar]
- Cooper DML, Thomas CDL, Clement JG, et al. Age-dependent change in the 3D structure of cortical porosity at the human femoral midshaft. Bone. 2007;40:957–965. doi: 10.1016/j.bone.2006.11.011. [DOI] [PubMed] [Google Scholar]
- Cooper DM, Erickson B, Peele AG, et al. Visualization of 3D osteon morphology by synchrotron radiation micro-CT. J Anat. 2011;219:481–489. doi: 10.1111/j.1469-7580.2011.01398.x. [DOI] [PMC free article] [PubMed] [Google Scholar]
- Crescimanno A, Stout SD. Differentiating fragmented human and nonhuman long bone using osteon circularity. J Forensic Sci. 2012;57:287–294. doi: 10.1111/j.1556-4029.2011.01973.x. [DOI] [PubMed] [Google Scholar]
- Currey JD. Some effects of ageing in human haversian systems. J Anat. 1964;98:69–75. [PMC free article] [PubMed] [Google Scholar]
- Dominguez VM, Crowder CM. The utility of osteon shape and circularity for differentiating human and nonhuman Haversian bone. Am J Phys Anthropol Suppl. 2012;54:84–91. doi: 10.1002/ajpa.22097. [DOI] [PubMed] [Google Scholar]
- Ericksen MF. Histologic estimation of age at death using the anterior cortex of the femur. Am J Phys Anthropol. 1991;84:171–179. doi: 10.1002/ajpa.1330840207. [DOI] [PubMed] [Google Scholar]
- Frost HM. Preparation of thin undecalcified bone sections by rapid manual method. Stain Technol. 1958;33:273–277. doi: 10.3109/10520295809111862. [DOI] [PubMed] [Google Scholar]
- Hennig C. Anatomy and Cell Biology. Saskatoon, SK: University of Saskatchewan; 2012. Determinants of osteon geometric parameters and their relation with age in cortical bone. In:, pp. 125, [Google Scholar]
- Heřt J, Fiala P, Petrtýl M. Osteon orientation of the diaphysis of the long bones in man. Bone. 1994;15:269–277. doi: 10.1016/8756-3282(94)90288-7. [DOI] [PubMed] [Google Scholar]
- Iwamoto S, Oonuki E, Konishi M. Study on the age-related changes of the compact bone and the age estimation 2. On the humerus. Acta Med Kinki Univ. 1978;3:203–208. [Google Scholar]
- Kerley ER. The microscopic determination of age in human bone. Am J Phys Anthropol. 1965;23:149–163. doi: 10.1002/ajpa.1330230215. [DOI] [PubMed] [Google Scholar]
- Kragstrup J, Melsen F. Three-dimensional morphology of trabecular bone osteons reconstructed from serial sections. Metab Bone Dis Relat Res. 1983;5:127–130. doi: 10.1016/0221-8747(83)90013-9. [DOI] [PubMed] [Google Scholar]
- Lanyon LE, Bourn S. The influence of mechanical function on the development and remodeling of the tibia. An experimental study in sheep. J Bone Joint Surg Am. 1979;61:263–273. [PubMed] [Google Scholar]
- Martin RB, Pickett JC, Zinaich S. Studies of skeletal remodeling in aging men. Clin Orthop Relat Res. 1980;149:268–282. [PubMed] [Google Scholar]
- Mohsin S, Taylor D, Lee TC. Three-dimensional reconstruction of Haversian systems in ovine compact bone. Eur J Morphol. 2002;40:309–315. doi: 10.1076/ejom.40.5.309.28901. [DOI] [PubMed] [Google Scholar]
- Nomura T, Gold E, Powers MP, et al. Micromechanics/structure relationships in the human mandible. Dent Mater. 2003;19:167–173. doi: 10.1016/s0109-5641(02)00026-x. [DOI] [PubMed] [Google Scholar]
- van Oers RF, Ruimerman R, van Rietbergen B, et al. Relating osteon diameter to strain. Bone. 2008;43:476–482. doi: 10.1016/j.bone.2008.05.015. [DOI] [PubMed] [Google Scholar]
- Pazzaglia UE, Congiu T, Marchese M, et al. Morphometry and patterns of lamellar bone in human Haversian systems. Anat Rec (Hoboken) 2012;295:1421–1429. doi: 10.1002/ar.22535. [DOI] [PubMed] [Google Scholar]
- Petrtýl M, Heřt J, Fiala P. Spatial organization of the haversian bone in man. J Biomech. 1996;29:161–169. doi: 10.1016/0021-9290(94)00035-2. [DOI] [PubMed] [Google Scholar]
- Rho J-Y, Kuhn-Spearing L, Zioupos P. Mechanical properties and the hierarchical structure of bone. Med Eng Phys. 1998;20:92–102. doi: 10.1016/s1350-4533(98)00007-1. [DOI] [PubMed] [Google Scholar]
- Richards GD, Jabbour RS, Horton CF, et al. Color changes in modern and fossil teeth induced by synchrotron microtomography. Am J Phys Anthropol. 2012;149:172–180. doi: 10.1002/ajpa.22103. [DOI] [PubMed] [Google Scholar]
- Robling AG, Stout SD. Morphology of the drifting osteon. Cells Tissues Organs. 1999;164:192–204. doi: 10.1159/000016659. [DOI] [PubMed] [Google Scholar]
- Robling AG, Stout SD. Histomorphometry of cortical bone. In: Kattzenberg MA, Saunders SR, editors. Biological Anthropology of the Human Skeleton. New York: Wiley-Liss; 2000. pp. 187–213. [Google Scholar]
- Robling AG, Castillo AB, Turner CH. Biomechanical and molecular regulation of bone remodeling. Annu Rev Biomed Eng. 2006;8:455–498. doi: 10.1146/annurev.bioeng.8.061505.095721. [DOI] [PubMed] [Google Scholar]
- Seeman E. Age- and menopause-related bone loss compromise cortical and trabecular microstructure. J Gerontol A Biol Sci Med Sci. 2013;68:1218–1225. doi: 10.1093/gerona/glt071. [DOI] [PubMed] [Google Scholar]
- Singh IJ, Gunberg DL. Estimation of age at death in human males from quantitative histology of bone fragments. Am J Phys Anthropol. 1970;33:373–381. doi: 10.1002/ajpa.1330330311. [DOI] [PubMed] [Google Scholar]
- Skedros J. Interpreting load history in limb-bone diaphyses: important considerations and their biomechanical foundations. In: Crowder C, Stout S, editors. Bone Histology An Anthropological Perspective. New York: CRC Press; 2012. pp. 153–220. [Google Scholar]
- Skedros JG, Mason MW, Bloebaum RD. Differences in osteonal micromorphology between tensile and compressive cortices of a bending skeletal system: indications of potential strain-specific differences in bone microstructure. Anat Rec. 1994;239:405–413. doi: 10.1002/ar.1092390407. [DOI] [PubMed] [Google Scholar]
- Skedros JG, Sorenson SM, Jenson NH. Are distributions of secondary osteon variants useful for interpreting load history in mammalian bones? Cells Tissues Organs. 2007;185:285–307. doi: 10.1159/000102176. [DOI] [PubMed] [Google Scholar]
- Skedros J, Keenan KE, Cooper DM, et al. Histocompositional organization and toughening mechanisms in antler. J Struct Biol. 2014;187:129–148. doi: 10.1016/j.jsb.2014.06.004. [DOI] [PubMed] [Google Scholar]
- Stout SD, Brunsden BS, Hildebolt CF, et al. Computer-assisted 3D reconstruction of serial sections of cortical bone to determine the 3D structure of osteons. Calcif Tissue Int. 1999;65:280–284. doi: 10.1007/s002239900699. [DOI] [PubMed] [Google Scholar]
- Tanck E, Hannink G, Ruimerman R, et al. Cortical bone development under the growth plate is regulated by mechanical load transfer. J Anat. 2006;208:73–79. doi: 10.1111/j.1469-7580.2006.00503.x. [DOI] [PMC free article] [PubMed] [Google Scholar]
- Tappen NC. Three-dimensional studies of resorption spaces and developing osteons. Am J Anat. 1977;149:301–331. doi: 10.1002/aja.1001490302. [DOI] [PubMed] [Google Scholar]
- Thompson DD, Galvin CA. Estimation of age at death by tibial osteon remodeling in an autopsy series. Forensic Sci Int. 1983;22:203–211. doi: 10.1016/0379-0738(83)90015-4. [DOI] [PubMed] [Google Scholar]
- Ural A, Vashishth D. Interactions between microstructural and geometrical adaptation in human cortical bone. J Orthop Res. 2006;24:1489–1498. doi: 10.1002/jor.20159. [DOI] [PubMed] [Google Scholar]
- Watanabe Y, Konishi M, Shimada M, et al. Estimation of age from the femur of Japanese cadavers. Forensic Sci Int. 1998;98:55–65. doi: 10.1016/s0379-0738(98)00136-4. [DOI] [PubMed] [Google Scholar]
- Yoshino M, Imaizumi K, Miyasaka S, et al. Histological estimation of age at death using microradiographs of humeral compact bone. Forensic Sci Int. 1994;64:191–198. doi: 10.1016/0379-0738(94)90231-3. [DOI] [PubMed] [Google Scholar]
Associated Data
This section collects any data citations, data availability statements, or supplementary materials included in this article.
Supplementary Materials
Appendix S1. Relation between Inverse Aspect Ratio and 3D orientation.