

Abstract
Among gonococcal isolates examined at the Hawaii State Laboratory Division from 2003 to 2011, the prevalence of elevated cefixime minimum inhibitory concentrations (MICs; ≥0.064 μg/mL) and elevated cefpodoxime MICs (≥0.19 μg/mL) increased over time. In contrast, few isolates exhibited elevated ceftriaxone MICs (≥0.094 μg/mL), and the prevalence of elevated ceftriaxone MICs did not change.
Neisseria gonorrhoeae has progressively acquired resistance to many of the antimicrobial agents that were previously recommended for treatment, including sulfonamides, penicillin, tetracycline, and fluoroquinolones. Consequently, these antimicrobials are no longer recommended for treatment of gonorrhea in the United States.1,2 Since the emergence of fluoroquinolone resistance in the 2000s, third-generation cephalosporins have been the backbone of Centers for Disease Control and Prevention (CDC)–recommended gonorrhea treatment regimens. However, decreased gonococcal susceptibility to third-generation cephalosporins has been observed for more than 10 years in Asia3,4 and, more recently, in Europe and the United States.2,5 As of 2012, oral cephalosporins are no longer recommended as first-line treatment for gonorrhea in the United States; dual treatment with ceftriaxone and either azithromycin or doxycycline is the only CDC-recommended regimen.2 The emergence and spread of cephalosporin-resistant N. gonorrhoeae would further limit treatment options for gonorrhea and significantly impair infection control efforts.
Fluoroquinolone resistance in N. gonorrhoeae in the United States first emerged in Hawaii and then spread to the west coast and throughout the country.6 A similar trend was observed for the emergence of penicillinase-producing N. gonorrhoeae in the United States, with evidence of importation from Asia and most early cases detected in California and Hawaii.7,8 There is concern that this pattern will repeat with the emergence of cephalosporin resistance. In 2001, Hawaii was the first state to report a cluster of multidrug-resistant N. gonorrhoeae infections with decreased susceptibility to cefixime, and this cluster was associated with sex partners from Asia.9 In addition, in 2006 to 2011 in CDC’s national Gonococcal Isolate Surveillance Project (GISP), the largest increase in the proportion of isolates with an elevated cefixime minimum inhibitory concentration (MIC) occurred in Hawaii.2 Monitoring trends in gonococcal antimicrobial susceptibility in Hawaii is critical to the surveillance for, early detection of, and response to the emergence of cephalosporin-resistant N. gonorrhoeae in the United States.
Hawaii’s Gonorrhea Culture Screening Program (HGCSP), established in 1972, provides for the routine collection of specimens from patients at the public sexually transmitted disease (STD) clinic and several other clinical sites. β-Lactamase testing has been performed on all gonococcal isolates received through HGCSP since the mid-1970s.10 The HGCSP has also ensured antimicrobial susceptibility testing of all gonococcal isolates at the Hawaii State Laboratory Division since the early 1990s. This analysis reviewed trends in antimicrobial susceptibility among gonococcal isolates examined at Hawaii State Laboratory Division from 2003 to 2011 to assess whether the percent with elevated cephalosporin MICs has increased over time and to identify risk factors associated with elevated cephalosporin MICs. Ceftriaxone susceptibility testing was conducted throughout this period. Cefixime susceptibility testing was performed in 2003 and early 2004, discontinued in July 2004 when cefixime was no longer widely available, and then resumed in January 2010. Cefpodoxime susceptibility testing began in April 2004. Antimicrobial MICs were determined by Etest (bioMérieux, Saint Laurent, Quebec, Canada). Because MIC breakpoints that correspond to cefixime, cefpodoxime, and ceftriaxone resistance have not been established, “elevated MICs” were defined as the alert values used by the Hawaii State Department of Health: 0.064 μg/mL or greater for cefixime, 0.19 μg/mL or greater for cefpodoxime, and 0.094 μg/mL or greater for ceftriaxone.
The prevalences of elevated cefixime MICs by demographic characteristics and potential risk factors were examined for 2 periods, 2003 to 2004 (before cefixime susceptibility testing was discontinued) and 2010 to 2011 (after cefixime susceptibility testing was resumed). Because data on cefpodoxime susceptibility before mid-2004 were not available, demographic and risk factor analysis for cefpodoxime was restricted to the 2010 to 2011 period. Basic demographic information and provider type were collected from all patients diagnosed as having gonorrhea and maintained in a surveillance database by the Hawaii State Department of Health. In addition, patients diagnosed as having gonorrhea at the public STD clinic were interviewed about exposure to potential risk factors in the 60 days before diagnosis, including sex of sex partner, travel, antimicrobial use, sex work or sexual contact with a sex worker, and military employment or sexual contact with military personnel.
Data were analyzed using SAS 9.2 (SAS Institute, Cary, NC). Prevalences in different populations were compared using prevalence ratios (PRs) and 95% confidence intervals (95% CIs).
The percent of gonococcal isolates with an elevated cefixime MIC increased from 1.5% (7/482) in 2003 and 4.2% (6/142) in the first 6 months of 2004 to 17.3% (34/196) in 2010 and 21.7% (40/184) in 2011 (P for trend <0.0001) (Fig. 1). When susceptibility testing for cefpodoxime was started in 2004, 1.5% (4/268) of isolates had an elevated cefpodoxime MIC. The proportion of isolates with an elevated cefpodoxime MIC remained less than 2% until 2009, when the proportion increased to 7.9% (16/202), and continued to increase to 12.1% (26/214) in 2010 and 16.3% (30/184) in 2011 (P for trend <0.0001). The proportion of isolates with an elevated ceftriaxone MIC did not increase in 2003 to 2011 (P for trend = 0.52). Two isolates with an elevated ceftriaxone MIC were identified by HGCSP during this period, both in 2005 (0.7% of 295 isolates in 2005).
Figure 1.
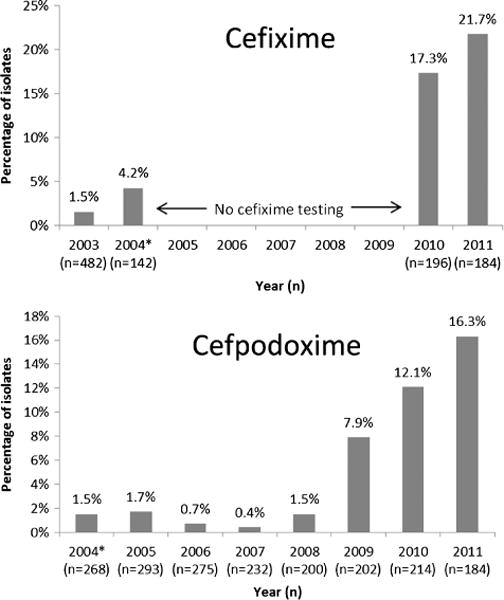
Proportion of gonococcal isolates with an elevated cefixime MIC (MIC ≥0.064 μg/mL) and elevated cefpodoxime MIC (MIC ≥0.19 μg/mL)—HGCSP, 2003 to 2011. *There was no cefixime testing, July 2004 to December 2009; testing for cefpodoxime started in April 2004.
Compared with 2003 to 2004, the prevalence of elevated cefixime MICs in 2010 to 2011 increased in both males and females, in every age group, and in every race/ethnicity group (Table 1). In 2003 to 2004, the only demographic characteristic significantly associated with a higher prevalence of elevated cefixime MICs was residence outside of Hawaii; 2 (66.7%) of 3 patients from out of state (all 3 from California) had gonococcal isolates with an elevated cefixime MIC. In 2010 to 2011, prevalence of elevated cefixime MICs was higher in males compared with females (PR, 4.1; 95% CI, 1.7–9.8; P < 0.01) and, among interviewed patients at the STD clinic, higher in men who had sex with men (MSM) compared with men who had sex with women only (MSW; PR, 2.1; 95% CI, 1.04–4.3; P = 0.03). Recent travel by patient or sex partner, antimicrobial use, sex work, and military affiliation were not associated with higher prevalence of elevated cefixime MIC in either period. Analysis of the prevalence of elevated cefpodoxime MICs by demographic characteristics and risk factors yielded similar results (data not shown). The prevalence of elevated cefpodoxime MICs in 2010 to 2011 was higher in males than in females (17.2% and 3.3%, respectively; PR, 5.2; 95% CI, 1.7–16.1; P < 0.01) and higher in MSM than in MSW, although this difference was not statistically significant (21.1% and 10.1%, respectively; PR, 2.1; 95% CI, 0.96–4.5; P = 0.07). In addition, recent antimicrobial use was associated with elevated cefpodoxime MICs (45.5% vs. 15.1%; PR, 3.0; 95% CI, 1.5–6.2; P < 0.01).
TABLE 1.
Prevalence of Elevated Cefixime MICs (MIC ≥0.064 μg/mL) in Patients With N. Gonorrhoeae Infection and Cefixime MIC Results—HGCSP, 2003 to 2004* and 2010 to 2011
| 2003–2004*
|
2010–2011
|
|||||
|---|---|---|---|---|---|---|
| Prevalence | PR (95% CI) | P | Prevalence | PR (95% CI) | P | |
| Sex | ||||||
| Male | 6/320 (1.9%) | 0.8 (0.3–2.4) | 0.71 | 69/293 (23.6%) | 4.1 (1.7–9.8) | <0.01 |
| Female | 7/304 (2.3%) | Reference | — | 5/87 (5.8%) | Reference | |
| Age, y | ||||||
| ≤19 | 1/87 (1.2%) | 0.4 (0.05–3.0) | 0.34 | 8/40 (20.0%) | 1.0 (0.5–2.0) | 0.99 |
| 20–29 | 8/267 (3.0%) | Reference | — | 41/206 (19.9%) | Reference | — |
| 30–39 | 3/161 (1.9%) | 0.6 (0.2–2.3) | 0.47 | 14/75 (18.7%) | 0.9 (0.5–1.6) | 0.82 |
| ≥40 | 1/109 (0.9%) | 0.3 (0.04–2.4) | 0.23 | 11/59 (18.6%) | 0.9 (0.5–1.7) | 0.83 |
| Race/Ethnicity | ||||||
| Asian | 6/253 (2.4%) | 1.0 (0.3–4.0) | 0.99 | 19/83 (22.9%) | 1.0 (0.6–1.8) | 0.90 |
| Black | 2/46 (4.4%) | 1.9 (0.3–10.8) | 0.49 | 8/21 (38.1%) | 1.7 (0.9–3.3) | 0.13 |
| HI/PI | 0/10 (0%) | 0 (—) | 0.63 | 6/52 (9.6%) | 0.4 (0.2–1.1) | 0.06 |
| Hispanic | 0/43 (0%) | 0 (—) | 0.31 | 6/33 (18.2%) | 0.8 (0.4–1.9) | 0.64 |
| White | 3/128 (2.3%) | Reference | — | 21/95 (22.1%) | Reference | — |
| Multiple/Other | 0/21 (0%) | 0 (—) | 0.48 | 7/48 (14.6%) | 0.7 (0.3–1.4) | 0.29 |
| District of residence | ||||||
| Oahu, Hawaii | 11/596 (1.9%) | Reference | — | 70/356 (19.7%) | Reference | — |
| Other island, Hawaii | 0/25 (0%) | 0 (—) | 0.49 | 3/20 (15.0%) | 0.8 (0.3–2.2) | 0.61 |
| Out of state | 2/3 (66.7%) | 36.1 (13.4–97.4) | <0.01 | 1/4 (25.0%) | 1.3 (0.2–7.0) | 0.79 |
| Provider type | ||||||
| STD clinic | 4/241 (1.7%) | Reference | — | 44/225 (19.6%) | Reference | — |
| Private/HMO | 7/292 (2.4%) | 1.4 (0.4–4.9) | 0.55 | 24/91 (26.4%) | 1.3 (0.9–2.1) | 0.18 |
| Other | 2/91 (2.2%) | 1.3 (0.2–7.1) | 0.74 | 6/64 (9.4%) | 0.5 (0.2–1.1) | 0.06 |
| Interviewed patients from STD clinic Sex, sex of sex partner† | ||||||
| MSM | 1/62 (1.6%) | 1.8 (0.1–27.9) | 0.68 | 33/127 (26.0%) | 2.1 (1.0–4.3) | 0.03 |
| MSW | 1/110 (0.9%) | Reference | — | 8/65 (12.3%) | Reference | — |
| Women | 2/69 (2.9%) | 0.3 (0.03–0.4) | 0.34 | 2/27 (7.4%) | 1.7 (0.4–7.3) | 0.50 |
| Recent travel (patient or partner)† | ||||||
| Yes | 2/95 (2.1%) | — | 0.13 | 16/83 (19.3%) | 0.9 (0.5–1.6) | 0.78 |
| No | 0/110 (0%) | Reference | — | 23/110 (20.9%) | Reference | — |
| Recent antimicrobial use† | ||||||
| Yes | 1/29 (3.5%) | 2.4 (0.3–22.1) | 0.44 | 3/11 (27.3%) | 1.3 (0.5–3.7) | 0.57 |
| No | 3/207 (1.5%) | Reference | — | 39/193 (20.2%) | Reference | — |
| Sex worker (patient or partner)† | ||||||
| Yes | 1/21 (4.8%) | 4.9 (0.5–52.1) | 0.15 | 0/10 (0%) | 0 (—) | 0.10 |
| No | 2/207 (1.0%) | Reference | — | 41/192 (21.4%) | Reference | — |
| Military (patient or partner)† | ||||||
| Yes | 1/54 (1.9%) | 1.6 (0.2–17.7) | 0.68 | 11/39 (28.2%) | 1.5 (0.8–2.6) | 0.22 |
| No | 2/177 (1.1%) | Reference | — | 31/161 (19.3%) | Reference | — |
| Total | 13/624 (2.1%) | 74/380 (19.5%) | ||||
Data presented are number of cases with elevated cefixime MIC/number of patients for whom data were available.
There was no cefixime testing, July 2004 to December 2009.
Analysis restricted to interviewed patients from the STD clinic (n = 241 [172 male patients] for 2003–2004, n = 225 [198 male patients] for 2010–2011).
HI/PI indicates Hawaiian/Pacific Islander; HMO, Health Maintenance Organization.
Surveillance of gonococcal susceptibility in Hawaii has national relevance because Hawaii is likely a site of importation of resistant gonorrhea from Asia. This may explain, in part, the increased prevalence of elevated cefixime and cefpodoxime MICs observed among gonococcal isolates in HGCSP from 2003 to 2004. These trends observed in HGCSP are similar to trends seen in GISP. Among GISP isolates from Hawaii, the percent of isolates with an elevated cefixime MIC (defined in GISP as MIC ≥0.25 μg/mL by agar dilution) increased from 0% in 2003 to 2004 to 13.1% in 2011; since GISP started testing for cefpodoxime susceptibility in 2009, the proportion of Hawaii isolates with an elevated cefpodoxime MIC (MIC ≥0.25 μg/mL by agar dilution) increased from 10.8% to 23.0% in 2011 (GISP, unpublished data). In addition, as in HGCSP, the percent of GISP isolates from Hawaii with an elevated ceftriaxone MIC (MIC ≥0.125 μg/mL by agar dilution) has remained low; since 2003, GISP identified 2 Hawaii isolates with an elevated ceftriaxone MIC, one (1.3% of isolates) in 2010 and one (1.6% of isolates) in 2011.
The increased prevalence of elevated cefixime MICs in HGCSP was observed in virtually every demographic group. However, in 2010 to 2011, the prevalence of elevated cefixime MICs was significantly higher in men than in women and higher in MSM than in MSW at the STD clinic. The same trend in MSM compared with MSW has been observed nationwide in GISP.2 The percent of patients with gonorrhea who were male increased in Hawaii from 43% in 2003 to 60% in 2011. Furthermore, the percent of male patients with gonorrhea who were MSM increased in the Honolulu STD clinic from 37% in 2003 to 68% in 2011. These findings emphasize the need to optimize gonorrhea treatment, partner services, and STD prevention among MSM to control gonorrhea and mitigate the spread of gonococcal strains with decreased susceptibility to cephalosporins in Hawaii and elsewhere.
There are some limitations to these data. Although it is clear that cefixime and cefpodoxime MICs are increasing, MIC breakpoints corresponding to cephalosporin resistance have not been established, and the clinical significance of elevated MICs, as described in this analysis, are not known. Hawaii’s Gonorrhea Culture Screening Program obtains isolates from 27% to 39% of gonorrhea cases in Hawaii each year; these data may not be representative of all gonorrhea cases in the state. However, no other state cultures such a high proportion of its cases, and this percentage is substantially higher than the approximately 4% of male patients sampled nationwide in GISP. A further advantage of HGCSP is that it includes women and asymptomatic patients and is therefore more inclusive and potentially more sensitive than GISP, which monitors susceptibility in symptomatic men, for identification of emerging resistant isolates. As an example, Hawaii detected the first gonococcal isolate in the United States with high-level resistance to azithromycin, an isolate that would have been missed if testing relied solely on GISP.11
Effective and timely treatment of cases is a cornerstone of gonorrhea control programs. The increased prevalence of elevated cefixime MICs in Hawaii underscores the importance of adhering to CDC’s treatment recommendations of dual treatment with ceftriaxone and either azithromycin or doxycycline. These data also highlight the value of HGCSP. Nationwide, expansion of local surveillance for gonococcal antimicrobial susceptibility could facilitate early detection of cases of cephalosporin resistance and a timely public health response. Continued surveillance in Hawaii for the emergence of antimicrobial resistance will be critical for the ongoing success of the local gonorrhea control program and for the national response to cephalosporin-resistant N. gonorrhoeae in the United States.
Acknowledgments
The authors thank Roy Ohye, former STD Program Coordinator, and Mandy Kiaha and Laurie Gorelangton, Disease Intervention Specialists, for their invaluable contributions to Hawaii’s Gonorrhea Culture Screening Program. They also thank the clinics and laboratories that refer gonococcal isolates to Hawaii’s Gonorrhea Culture Screening Program.
Footnotes
The authors report no conflict of interest.
References
- 1.Kirkcaldy RD, Ballard RC, Dowell D. Gonococcal resistance: Are cephalosporins next? Curr Infect Dis Rep. 2011;13:196–204. doi: 10.1007/s11908-011-0169-9. [DOI] [PubMed] [Google Scholar]
- 2.Centers for Disease Control and Prevention. Update to CDC’s sexually transmitted diseases treatment guidelines, 2010: Oral cephalosporins no longer recommended for treatment of gonococcal infections. MMWR. 2012;61:590–594. [PubMed] [Google Scholar]
- 3.Ito M, Yasuda M, Yokoi S, et al. Remarkable increase in central Japan in 2001–2002 of Neisseria gonorrhoeae isolates with decreased susceptibility to penicillin, tetracycline, oral cephalosporins, and fluoroquinolones. Antimicrob Agents Chemother. 2004;48:3185–3187. doi: 10.1128/AAC.48.8.3185-3187.2004. [DOI] [PMC free article] [PubMed] [Google Scholar]
- 4.Tanaka M, Nakayama H, Tunoe H, et al. A remarkable reduction in the susceptibility of Neisseria gonorrhoeae isolates to cephems and the selection of antibiotic regimens for the single-dose treatment of gonococcal infection in Japan. J Infect Chemother. 2002;8:81–86. doi: 10.1007/s101560200011. [DOI] [PubMed] [Google Scholar]
- 5.European Centre for Disease Prevention and Control. Gonococcal Antimicrobial Susceptibility Surveillance in Europe—2010. Stockholm: ECDC; 2012. [Google Scholar]
- 6.Centers for Disease Control and Prevention. Update to CDC’s sexually transmitted diseases treatment guidelines, 2006: Fluoroquinolones are no longer recommended for treatment of gonococcal infections. MMWR. 2007;56:332–336. [PubMed] [Google Scholar]
- 7.Perine P, Morton R, Piot P, et al. Epidemiology and treatment of penicillinase-producing Neisseria gonorrhoeae. Sex Transm Dis. 1979;6:152–158. doi: 10.1097/00007435-197904000-00021. [DOI] [PubMed] [Google Scholar]
- 8.Jaffe H, Biddle J, Johnson S, et al. Infections due to pneicillinase-producing Neisseria gonorrhoeae in the United States: 1976–1980. J Infect Dis. 1981;144:191–197. doi: 10.1093/infdis/144.2.191. [DOI] [PubMed] [Google Scholar]
- 9.Wang SA, Lee MV, O’Connor N, et al. Multidrug-resistant Neisseria gonorrhoeae with decreased susceptibility to cefixime—Hawaii, 2001. Clin Infect Dis. 2003;37:849–852. doi: 10.1086/377500. [DOI] [PubMed] [Google Scholar]
- 10.Centers for Disease Control and Prevention. Follow-up on penicillinase-producing Neisseria gonorrhoeae—worldwide. MMWR. 1977;26:153–154. [Google Scholar]
- 11.Katz AR, Komeya AY, Soge OO, et al. Neisseria gonorrhoeae with high-level resistance to azithromycin: Case report of the first isolate identified in the United States. Clin Infect Dis. 2012;54:841–843. doi: 10.1093/cid/cir929. [DOI] [PMC free article] [PubMed] [Google Scholar]