

Abstract
Objective
To examine the form of the relationship between sleep duration and anthropometric measures and possible differences in these relationships by gender and race or ethnicity.
Design and Methods
Data for 13,742 participants aged ≥20 years from the National Health and Nutrition Examination Survey 2005–2010 were used. Sleep duration was categorized as ≤6 (short sleepers), 7–9, and ≥10 hours (long sleepers).
Results
Short sleepers were as much as 1.7 kg/m2 (SE 0.4) heavier and had 3.4 cm (SE 1.0) more girth than long sleepers. Among participants without depression or a diagnosed sleep disorder, sleep duration was significantly associated with body mass index (BMI) and waist circumference in an inverse linear association in the entire sample, men, women, whites, African Americans, and participants aged 20–39 years. No evidence for statistical interaction by gender and race or ethnicity was observed. Regression coefficients were notably stronger among adults aged 20–39 years. Compared to participants who reported sleeping 7–9 hours per night, short sleepers were more likely to be obese and have abdominal obesity.
Conclusions
In this nationally representative sample of US adults, an inverse linear association most consistently characterized the association between sleep duration and BMI and waist circumference.
Introduction
Sleep serves an important restorative function in humans, and a growing body of research is unraveling the possible roles of sleep in helping to maintain the homeostasis of numerous physiological functions. One area of vigorous research has been the examination of the relationships between sleep duration and anthropometric measures. The concurrent trends in the declining amount of sleep reported in the United States and the increasing prevalence of obesity have piqued the interest of researchers. Several reviews have summarized the growing body of literature relating disturbances of sleep to various anthropometric measures chiefly body mass index (1–3). Although the overall impression conveyed by many of these studies is that sleep duration is significantly associated with body mass index in adults in the majority of studies, specific gaps in the knowledge base are evident (2). First, some inconsistency in study results exists. For example, short sleep duration has more often than not been associated with increased body mass index and other anthropometric parameters but has also been associated with lower body mass index. Studies have also reported conflicting associations between long sleep duration and lower body mass index and other anthropometric parameters (4). Second, the shape of the relationship between sleep duration and anthropometric measures remains uncertain as studies have shown inverse, U-shaped, or no relationships between the two. Third, the majority of these studies have examined obesity based on body mass index as their main anthropometric measures of interest leaving the relationships between sleep duration and other anthropometric measures largely unexplained. Fourth, questions about possible gender and racial or ethnic differences remain unanswered. To provide additional insights into the relationship between sleep duration and anthropometric measures, we analyzed data from a large nationally representative sample of adults in the United States.
Methods
The present study included data from the National Health and Nutrition Examination Survey (NHANES) 2005–2010. Each 2-year cycle yields a national sample representative of the civilian, noninstitutionalized United States population selected by using a multistage, stratified sampling design. Participants were interviewed at home and were invited to attend a mobile examination center, where they were asked to complete additional questionnaires, to undergo various examinations, and to provide a blood sample. Interview and examination response rates for the three consecutive 2-year cycles exceeded 70%. The surveys received approval from the National Center for Health Statistics Research Ethics Review Board, and participants were asked to sign an informed consent form. Details about the survey may be found elsewhere (5).
Body mass index (kg/m2) was calculated from measured weight and height. Height was measured with a stadiometer, and weight was measured on a digital weight scale with participants wearing a standard examination gown. Waist circumference was measured at the level of uppermost lateral border of the iliac crest to the nearest 0.1 cm. General obesity was defined as a body mass index ≥30 kg/m2, and abdominal obesity was defined as a waist circumference ≥102 cm in men and ≥88 cm in women.
Sleep duration was assessed with the question “How much sleep do you usually get at night on weekdays or workdays?” Answers were recorded in whole hours, and responses of more than 12 hours were coded as 12 hours. Because the National Sleep Foundation suggests that adults should sleep 7–9 hours per night, we created the following three categories of sleeping duration: ≤6 hours, 7–9 hours, and ≥10 hours per night. We also refer to these three groups as short, normal, and long sleepers, respectively.
Covariates included age, gender, race or ethnicity (white, African American, Mexican American, other Hispanic, mixed race), educational status (<high school, high school graduate or equivalent, >high school), employment status (employed, not employed, retired), children age 17 or younger in household, smoking status (never, former, current), leisure-time physical activity, alcohol use, prescription medication use, depression score, and histories of cardiovascular disease, diabetes, chronic obstructive pulmonary disease, arthritis, thyroid problems, liver disease, cancer, and sleep disorder. Answers to questions aimed at assessing food security of children in a participant’s household were considered as evidence of children age 17 or younger in that household. Current smokers were defined as participants who had smoked ≥100 cigarettes during their lifetime and were still smoking. Former smokers were defined as participants who had smoked ≥100 cigarettes during their lifetime but had stopped. Participants who had smoked <100 cigarettes during their lifetime were classified as having never smoked. To estimate leisure-time physical activity for the years 2005 to 2006, we summed the product of weekly time spent in each activity volunteered by the participant multiplied by the MET value for that activity yielding a MET-hours index. One MET is the energy expenditure of approximately 1 kcal/kg body weight/hour. For the years 2007 to 2010, the physical activity questionnaire was changed. We estimated weekly MET-hours for moderate and vigorous activities from questions that asked participants about their participation in moderate and vigorous activities, the number of days per week engaged in these activities, and the number of minutes engaged in these activities on a typical day. Using questions from the alcohol use questionnaire, three levels of alcohol use were created: excessive (men: >2 drinks per day; women: >1 drinks per day); moderate (men >0–<2 drinks per day; women: >0–1 drink per day); and none. Prescription medication use was determined from the question “In the past month have you used or taken medication for which a prescription is needed?”. A depression score was calculated from answers to the Patient Health Questionnaire (PHQ-9). A score of 10 or higher was considered as compatible with the presence of depression. Participants were considered to have cardiovascular disease if they had ever been told by a doctor or other health professional that they had congestive heart failure, coronary heart disease, angina, heart attack, or stroke. Participants who responded affirmatively to the question “Have you ever been told by a doctor or health professional you have diabetes or sugar diabetes?” were considered to have diagnosed diabetes. Those who answered that they had not been so told or that they had borderline diabetes were not considered to have diagnosed diabetes. Participants were defined as having chronic obstructive pulmonary disease if they responded that they still had chronic bronchitis or ever had emphysema. The question “Have you ever been told by a doctor or other health professional that you have a sleep disorder?” was used to determine the presence or absence of a history of a sleep disorder.
We limited the analyses to men and nonpregnant women who were aged ≥20 years. Differences in means and percentages were tested with t-tests and chi-square tests, respectively. For the three groups of sleep duration, we used linear regression analysis to calculate adjusted least-square means of body mass index and waist circumference after adjusting for covariates shown above and noted in the tables. In addition, we estimated the linear regression coefficients for sleep duration as a continuous parameter. We also examined the associations between sleep duration status and general and abdominal obesity using log-linear analysis with robust variance estimator. For analyses stratified by race or ethnicity, we only present results for whites, African Americans, and Mexican Americans. We used SUDAAN for our statistical analyses to account for the complex survey design. Sampling weights were used to calculate estimates (means, percentages, regression coefficients, and prevalence ratios). Statistical significance was defined as P < 0.05.
Results
A total of 16,539 participants aged ≥20 years had an examination. After excluding pregnant women, 16,157 participants remained of whom 15,905 participants had a value for body mass index and 15,216 had a value for waist circumference. Once participants with missing values for other study variables were excluded, 13742 participants were included in the analyses.
The analytic sample included 6904 men, 6838 women, 6783 whites, 2743 African Americans, 2498 Mexican Americans, and 1718 participants of another race or ethnicity. The median age of the sample was 46 years. About 36.6% (SE 0.7) of participants reported sleeping 6 or fewer hours per night, 61.4% (SE 0.7) reported sleeping 7–9 hours per night, and 2.0% (SE 0.1) reported sleeping 10 or more hours per night.
The means and percentages of several study covariates differed significantly among the three categories of sleep duration (Table 1). The age-adjusted percentages of whites, adults with at least a high-school education, and employed adults were highest among participants reporting sleeping 7–9 hours per night. Furthermore, the percentages of adults reporting cardiovascular disease, diabetes, chronic obstructive pulmonary disease, and arthritis were lowest among participants reporting sleeping 7–9 hours per night.
TABLE 1.
Selected age-adjusteda characteristics (mean or percentage [standard error]) among 13,742 participants aged ≥20 years by level of sleeping duration, National Health and Nutrition Examination Survey 2005–2010
| Sleep duration (h/night)
|
||||||
|---|---|---|---|---|---|---|
| 1–6 (N = 5408) |
7–9 (N = 8001) |
10+ (N = 333) |
P 1–6 vs 7–9 | P 7–9 vs 10+ | P 1–6 vs 10+ | |
| Age, years | 46.3 (0.3) | 47.0 (0.4) | 48.8 (1.5) | 0.026 | 0.263 | 0.112 |
| Body mass index, kg/m2 | 29.2 (0.1) | 28.2 (0.1) | 27.8 (0.5) | <0.001 | 0.365 | 0.003 |
| Waist circumference, cm | 99.3 (0.3) | 97.1 (0.3) | 96.2 (1.1) | <0.001 | 0.415 | 0.004 |
| Weekly MET-h | 15.2 (0.6) | 15.9 (0.6) | 10.5 (2.3) | 0.272 | 0.023 | 0.064 |
| Men, % | 51.5 (0.9) | 47.9 (0.6) | 40.4 (3.1) | 0.005 | 0.021 | 0.001 |
| White, % | 65.2 (2.2) | 74.5 (1.7) | 67.3 (3.9) | <0.001 | 0.050 | 0.526 |
| ≥High school graduate, % | 80.4 (0.8) | 82.8 (1.0) | 72.3 (2.4) | 0.002 | <0.001 | 0.002 |
| Employed, % | 65.5 (0.7) | 66.9 (0.7) | 39.6 (4.1) | 0.039 | <0.001 | <0.001 |
| Children aged ≤17 years in household, % | 42.9 (0.9) | 41.4 (1.0) | 36.7 (3.9) | 0.179 | 0.219 | 0.131 |
| Current smoker, % | 27.2 (0.9) | 19.2 (0.7) | 35.2 (3.4) | <0.001 | <0.001 | 0.022 |
| Excess alcohol intake, % | 8.2 (0.6) | 8.9 (0.5) | 14.6 (2.8) | 0.318 | 0.038 | 0.016 |
| Depression score | 3.7 (0.1) | 2.4 (0.1) | 4.5 (0.3) | <0.001 | <0.001 | 0.028 |
| Any prescription medication use, % | 56.7 (0.9) | 55.9 (0.7) | 67.3 (3.1) | 0.433 | 0.001 | <0.001 |
| History of: | ||||||
| Cardiovascular disease, % | 9.6 (0.6) | 6.8 (0.3) | 12.0 (1.8) | <0.001 | 0.007 | 0.185 |
| Diagnosed diabetes, % | 9.0 (0.5) | 6.9 (0.3) | 11.0 (1.6) | <0.001 | 0.018 | 0.248 |
| Chronic obstructive pulmonary disease, % | 5.3 (0.4) | 3.0 (0.3) | 7.9 (1.6) | <0.001 | 0.005 | 0.131 |
| Arthritis, % | 27.6 (0.7) | 22.2 (0.5) | 32.6 (3.7) | <0.001 | 0.006 | 0.194 |
| Thyroid, % | 9.1 (0.5) | 9.9 (0.3) | 11.0 (2.0) | 0.247 | 0.585 | 0.359 |
| Liver, % | 3.4 (0.4) | 2.8 (0.2) | 6.6 (2.0) | 0.097 | 0.063 | 0.124 |
| Cancer, % | 8.7 (0.5) | 9.4 (0.4) | 9.7 (1.9) | 0.324 | 0.869 | 0.602 |
| Sleep disorder, % | 9.7 (0.5) | 5.7 (0.3) | 9.5 (2.1) | <0.001 | 0.079 | 0.907 |
Age-adjusted to the year 2000 projected US population using the direct method.
As sleep duration increased, mean levels of body mass index and waist circumference decreased (Table 2). After maximal adjustment, short sleepers were as much as 1.7 kg/m2 (SE 0.4) heavier and had a waist circumference as much as 3.4 cm (SE 1.0) greater than long sleepers.
TABLE 2.
Adjusted mean (standard error) body mass index, and waist circumference among 13,742 participants aged ≥20 years, by levels of sleep duration, National Health and Nutrition Examination Survey 2005–2010
| Sleep duration (h/night)
|
|||||||
|---|---|---|---|---|---|---|---|
| 1–6 (N = 5408) |
7–9 (N = 8001) |
10+ (N = 333) |
P for overall adjusted Wald F-test | P 1–6 vs 7–9 | P 7–9 vs 10+ | P 1–6 vs 10+ | |
| Body mass index (kg/m2) | |||||||
| Model 1a | 29.3 (0.1) | 28.2 (0.1) | 27.5 (0.4) | <0.001 | <0.001 | 0.100 | <0.001 |
| Model 2b | 29.2 (0.1) | 28.3 (0.1) | 27.4 (0.4) | <0.001 | <0.001 | 0.035 | <0.001 |
| Model 3c | 29.2 (0.1) | 28.3 (0.1) | 27.5 (0.4) | <0.001 | <0.001 | 0.052 | <0.001 |
| Model 4d | 29.0 (0.1) | 28.4 (0.1) | 27.3 (0.4) | <0.001 | <0.001 | 0.006 | <0.001 |
| Waist circumference (cm) | |||||||
| Model 1a | 99.6 (0.3) | 97.2 (0.3) | 95.8 (1.1) | <0.001 | <0.001 | 0.216 | 0.001 |
| Model 2b | 99.3 (0.3) | 97.4 (0.3) | 96.0 (1.0) | <0.001 | <0.001 | 0.170 | 0.002 |
| Model 3c | 99.3 (0.3) | 97.4 (0.3) | 96.0 (1.0) | <0.001 | <0.001 | 0.175 | 0.002 |
| Model 4d | 98.8 (0.3) | 97.7 (0.3) | 95.4 (0.9) | 0.001 | 0.002 | 0.023 | 0.001 |
Adjusted for age.
Adjusted for age, gender, race or ethnicity, and education, employment status, and children aged ≤17 years in household.
Adjusted for variables in model 2 plus smoking status, leisure-time physical activity, and alcohol use.
Adjusted for variables in model 3 plus any prescription medication use, depression score, histories of diabetes, cardiovascular disease, chronic obstructive pulmonary disease, arthritis, thyroid disease, liver disease, cancer, and sleep disorder.
The relationship between sleep duration as a continuous variable and the anthropometric variables is presented in Table 3. Prior to adjustment for the depression score and diagnosed sleep disorder status, significant inverse relationships for body mass index and waist circumference were noted for the entire sample, men, women, whites, and participants aged 20–39 years. In addition, a significant inverse relationship for body mass index was observed for participants aged ≥60 years, and significant nonlinear relationships for body mass index and waist circumference were observed for participants age 40–59 years. The associations between sleep duration and the anthropometric parameters in models 1–3 varied by age with the associations being notably stronger among the youngest adults (20–39 years). When a squared term for sleep duration was added to models 1–4 in an effort to examine possible departures from linearity, the term was statistically significant only for participants aged 40–59 years for model 4.
TABLE 3.
Results from linear regression analyses of anthropometric variables (dependent variable) on sleep duration (independent variable) among 13,742 participants aged ≥20 years, National Health and Nutrition Examination Survey 2005–2010
| Population | Body mass index (kg/m2)
|
Waist circumference (cm)
|
|||||
|---|---|---|---|---|---|---|---|
| Beta (SE) | P | P interaction | Beta (SE) | P | P interaction | ||
| Total (N = 13742) | Model 1a | −0.39 (0.05) | <0.001 | A | −0.90 (0.13) | <0.001 | A |
| Model 2b | −0.31 (0.05) | <0.001 | A | −0.68 (0.13) | <0.001 | A | |
| Model 3c | −0.33 (0.05) | <0.001 | A | −0.69 (0.12) | <0.001 | A | |
| Model 4d | −0.27 (0.04) | <0.001 | A | −0.53 (0.11) | <0.001 | A | |
| Model 5e | 0.51 (0.25) | 0.044 | A | 1.22 (0.61) | 0.053 | A | |
| −0.05 (0.02)f | 0.005 | A | −0.12 (0.05)f | 0.013 | A | ||
| Men (N = 6904) | Model 1a | −0.32 (0.06) | <0.001 | 0.136 | −0.64 (0.17) | <0.001 | 0.144 |
| Model 2b | −0.28 (0.06) | <0.001 | 0.135 | −0.62 (0.17) | 0.001 | 0.135 | |
| Model 3c | −0.31 (0.06) | <0.001 | 0.175 | −0.68 (0.16) | <0.001 | 0.177 | |
| Model 4d | −0.26 (0.06) | <0.001 | 0.206 | −0.54 (0.15) | 0.001 | 0.212 | |
| Model 5e | 0.48 (0.33) | 0.154 | A | −0.42 (0.15) | 0.008 | 0.286 | |
| −0.05 (0.02)f | 0.034 | A | A | A | A | ||
| Women (N = 6838) | Model 1a | −0.46 (0.07) | <0.001 | −0.94 (0.18) | <0.001 | ||
| Model 2b | −0.33 (0.08) | <0.001 | −0.70 (0.19) | 0.001 | |||
| Model 3c | −0.33 (0.07) | <0.001 | −0.65 (0.18) | 0.001 | |||
| Model 4d | −0.26 (0.07) | <0.001 | −0.49 (0.16) | 0.004 | |||
| Model 5e | −0.17 (0.06) | 0.010 | −0.27 (0.16) | 0.099 | |||
| White (N = 6783) | Model 1a | −0.40 (0.06) | <0.001 | 0.200 | −1.07 (0.17) | <0.001 | 0.036 |
| Model 2b | −0.34 (0.06) | <0.001 | 0.321 | −0.77 (0.16) | <0.001 | 0.170 | |
| Model 3c | −0.36 (0.06) | <0.001 | 0.491 | −0.77 (0.15) | <0.001 | 0.300 | |
| Model 4d | −0.30 (0.05) | <0.001 | 0.540 | −0.61 (0.14) | <0.001 | 0.336 | |
| Model 5e | 0.65 (0.34) | 0.064 | A | 1.38 (0.92) | 0.140 | A | |
| −0.06 (0.02)f | 0.012 | A | −0.13 (0.07)f | 0.049 | A | ||
| African American (N = 2743) | Model 1a | −0.28 (0.08) | 0.002 | −0.56 (0.18) | 0.003 | ||
| Model 2b | −0.27 (0.09) | 0.004 | −0.50 (0.19) | 0.012 | |||
| Model 3c | −0.28 (0.09) | 0.003 | −0.53 (0.19) | 0.007 | |||
| Model 4d | −0.16 (0.09) | 0.073 | −0.28 (0.19) | 0.149 | |||
| Model 5e | −0.13 (0.09) | 0.160 | −0.14 (0.19) | 0.452 | |||
| Mexican American (N = 2498) | Model 1a | −0.21 (0.12) | 0.086 | −0.51 (0.29) | 0.087 | ||
| Model 2b | −0.21 (0.12) | 0.072 | −0.47 (0.29) | 0.117 | |||
| Model 3c | −0.22 (0.12) | 0.077 | −0.49 (0.32) | 0.130 | |||
| Model 4d | −0.21 (0.12) | 0.098 | −0.45 (0.31) | 0.151 | |||
| Model 5e | −0.17 (0.12) | 0.174 | −0.36 (0.29) | 0.225 | |||
| Age 20–39 y (N = 4544) | Model 1a | −0.54 (0.08) | <0.001 | 0.009 | −1.28 (0.18) | <0.001 | 0.001 |
| Model 2b | −0.46 (0.07) | <0.001 | 0.005 | −1.08 (0.17) | <0.001 | 0.004 | |
| Model 3c | −0.48 (0.07) | <0.001 | 0.001 | −1.13 (0.16) | <0.001 | 0.002 | |
| Model 4d | −0.43 (0.07) | <0.001 | A | −1.01 (0.16) | <0.001 | A | |
| Model 5e | −0.36 (0.07) | <0.001 | A | −0.83 (0.16) | <0.001 | A | |
| Age 40–59 y (N = 4604) | Model 1a | −0.29 (0.08) | 0.001 | −0.74 (0.21) | 0.001 | ||
| Model 2b | −0.21 (0.09) | 0.020 | −0.44 (0.21) | 0.041 | |||
| Model 3c | −0.21 (0.08) | 0.012 | −0.39 (0.19) | 0.048 | |||
| Model 4d | 0.94 (0.37) | 0.014 | −.66 (0.90) | 0.005 | |||
| −0.08 (0.03)f | 0.005 | −0.21 (0.07)f | 0.003 | ||||
| Model 5e | 1.49 (0.39) | <0.001 | 3.87 (0.87) | <0.001 | |||
| −0.12 (0.03)f | <0.001 | −0.29 (0.07)f | <0.001 | ||||
| Age 60+ y (N = 4594) | Model 1a | −0.25 (0.06) | <0.001 | −0.40 (0.18) | 0.030 | ||
| Model 2b | −0.22 (0.06) | 0.001 | −0.42 (0.18) | 0.023 | |||
| Model 3c | −0.22 (0.06) | 0.000 | −0.39 (0.17) | 0.028 | |||
| Model 4d | −0.18 (0.06) | 0.002 | −0.28 (0.16) | 0.084 | |||
| Model 5e | −0.11 (0.06) | 0.059 | −0.11 (0.17) | 0.520 | |||
Adjusted for age.
Adjusted for age, gender, race or ethnicity, and education, employment status, and children aged ≤17 years in household.
Adjusted for variables in model 2 plus smoking status, leisure-time physical activity, and alcohol use.
Adjusted for variables in model 3 plus any prescription medication use, histories of diabetes, cardiovascular disease, chronic obstructive pulmonary disease, arthritis, thyroid disease, liver disease, and cancer.
Adjusted for variables in model 4 plus depression score, history of sleep disorder, and, if significant, a squared term for sleep duration.
Beta (SE) and P-value for squared term for sleep duration.
When the depression score and diagnosed sleep disorder status were added to the models (model 5 in Table 3), nonlinear associations for body mass index and waist circumference emerged among all participants, whites, and participants aged 40–59 years. Figure 1 shows that adjusted mean body mass index and waist circumference among all participants increased with increasing sleep duration through 5 hours per night and then trended down.
FIGURE 1.
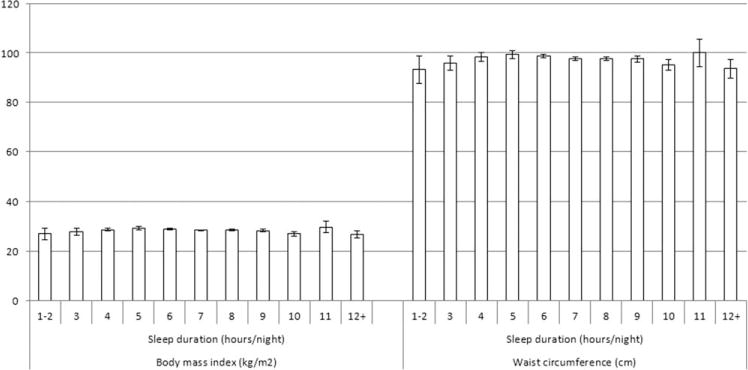
Adjusted mean body mass index and waist circumference in function of sleep duration among 13,742 participants aged ≥20 years, National Health and Nutrition Examination Survey 2005–2010. Results were adjusted for age, gender, race or ethnicity, education, employment status, children aged ≤17 years in household, smoking status, leisure-time physical activity, alcohol use, any prescription medication use, depression score, histories of diabetes, cardiovascular disease, chronic obstructive pulmonary disease, arthritis, thyroid disease, liver disease, cancer, and sleep disorder.
We also examined the associations between sleep duration and body mass index and waist circumference after excluding participants with a depression score ≥10 and participants who reported having been diagnosed as having a sleep disorder (Table 4). No significant nonlinear associations as reflected by the squared term for sleep duration in any of the models were observed. Inverse linear associations were detected for all participants, men, women, whites, African Americans, and participants aged 20–39 years. Furthermore, inverse linear associations for body mass index were found among Mexican Americans and participants aged 40–59 years. Figure 2 presents the adjusted mean body mass index and waist circumference in function of the number of hours slept per night for all participants.
TABLE 4.
Results from linear regression analyses of anthropometric variables on sleep duration among 11,789 participants aged ≥20 years, National Health and Nutrition Examination Survey 2005–2010.
| Population | Body mass index (kg/m2)
|
Waist circumference (cm)
|
|||||
|---|---|---|---|---|---|---|---|
| Beta (SE) | P | P interaction | Beta (SE) | P | P interaction | ||
| Total (N = 11789) | Model 1a | −0.40 (0.06) | <0.001 | −0.92 (0.15) | <0.001 | ||
| Model 2b | −0.33 (0.06) | <0.001 | −0.68 (0.15) | <0.001 | |||
| Model 3c | −0.34 (0.05) | <0.001 | −0.70 (0.14) | <0.001 | |||
| Model 4d | −0.30 (0.05) | <0.001 | −0.60 (0.13) | <0.001 | |||
| Men (N = 6024) | Model 1a | −0.33 (0.07) | <0.001 | 0.143 | −0.64 (0.17) | 0.001 | 0.215 |
| Model 2b | −0.28 (0.07) | <0.001 | 0.112 | −0.60 (0.17) | 0.001 | 0.134 | |
| Model 3c | −0.31 (0.07) | <0.001 | 0.170 | −0.66 (0.17) | <0.001 | 0.184 | |
| Model 4d | −0.28 (0.06) | <0.001 | 0.174 | −0.57 (0.16) | 0.001 | 0.184 | |
| Women (N = 5765) | Model 1a | −0.47 (0.08) | <0.001 | −0.89 (0.21) | <0.001 | ||
| Model 2b | −0.36 (0.08) | <0.001 | −0.72 (0.21) | 0.001 | |||
| Model 3c | −0.36 (0.08) | <0.001 | −0.71 (0.20) | 0.001 | |||
| Model 4d | −0.31 (0.08) | <0.001 | −0.60 (0.19) | 0.003 | |||
| Whites (N = 5808) | Model 1a | −0.39 (0.07) | <0.001 | 0.441 | −1.05 (0.19) | <0.001 | 0.235 |
| Model 2b | −0.32 (0.07) | <0.001 | 0.549 | −0.69 (0.19) | 0.001 | 0.562 | |
| Model 3c | −0.34 (0.07) | <0.001 | 0.723 | −0.70 (0.17) | <0.001 | 0.698 | |
| Model 4d | −0.29 (0.06) | <0.001 | 0.856 | −0.59 (0.17) | 0.001 | 0.889 | |
| African Americans (N = 2342) | Model 1a | −0.41 (0.10) | <0.001 | −0.86 (0.22) | <0.001 | ||
| Model 2b | −0.42 (0.10) | <0.001 | −0.82 (0.23) | 0.001 | |||
| Model 3c | −0.41 (0.10) | <0.001 | −0.83 (0.23) | 0.001 | |||
| Model 4d | −0.35 (0.10) | 0.001 | −0.71 (0.22) | 0.003 | |||
| Mexican Americans (N = 2192) | Model 1a | −0.23 (0.12) | 0.068 | −0.51 (0.30) | 0.101 | ||
| Model 2b | −0.24 (0.11) | 0.042 | −0.47 (0.30) | 0.126 | |||
| Model 3c | −0.26 (0.12) | 0.043 | −0.51 (0.33) | −0.506 | |||
| Model 4d | −0.25 (0.12) | 0.044 | −0.51 (0.32) | 0.115 | |||
| Age 20–39 y (N = 4020) | Model 1a | −0.56 (0.09) | <0.001 | 0.004 | −1.36 (0.23) | <0.001 | 0.001 |
| Model 2b | −0.48 (0.09) | <0.001 | 0.004 | −1.13 (0.22) | <0.001 | 0.007 | |
| Model 3c | −0.49 (0.09) | <0.001 | 0.002 | −1.17 (0.21) | <0.001 | 0.004 | |
| Model 4d | −0.46 (0.08) | <0.001 | 0.001 | −1.08 (0.21) | <0.001 | 0.001 | |
| Age 40–59 y (N = 3779) | Model 1a | −0.35 (0.11) | 0.003 | −0.84 (0.28) | 0.004 | ||
| Model 2b | −0.28 (0.12) | 0.023 | −0.50 (0.27) | 0.071 | |||
| Model 3c | −0.28 (0.11) | 0.016 | −0.47 (0.25) | 0.066 | |||
| Model 4d | −0.22 (0.10) | 0.033 | −0.33 (0.24) | 0.165 | |||
| Age 60+ y (N = 3990) | Model 1a | −0.17 (0.06) | 0.014 | −0.22 (0.17) | 0.186 | ||
| Model 2b | −0.14 (0.06) | 0.031 | −0.23 (0.17) | 0.192 | |||
| Model 3c | −0.16 (0.07) | 0.021 | −0.23 (0.18) | 0.196 | |||
| Model 4d | −0.12 (0.06) | 0.062 | −0.12 (0.16) | 0.482 | |||
Participants with a depression score of ≥10 or who reported having ever been told by a doctor or other health professional about having a sleep disorder were excluded.
Adjusted for age.
Adjusted for age, gender, race or ethnicity, and education, employment status, and children aged <=17 years in household.
Adjusted for variables in model 2 plus smoking status, leisure-time physical activity, and alcohol use.
Adjusted for variables in model 3 plus any prescription medication use, histories of diabetes, cardiovascular disease, chronic obstructive pulmonary disease, arthritis, thyroid disease, liver disease, and cancer.
FIGURE 2.
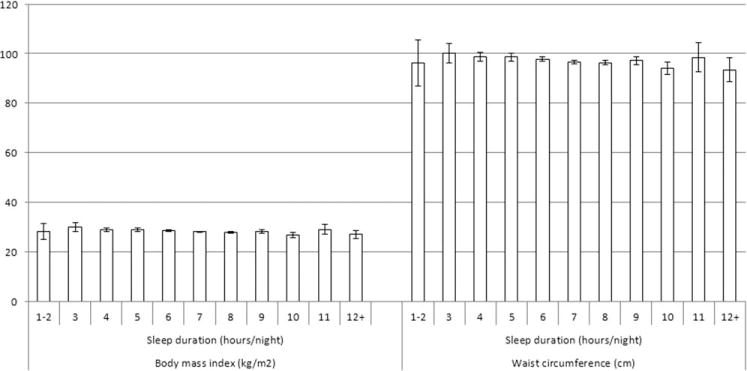
Adjusted mean body mass index and waist circumference in function of sleep duration among 11789 participants aged ≥20 years, National Health and Nutrition Examination Survey 2005–2010. Participants with a depression score of ≥10 or reported having ever been told by a doctor or other health professional about having a sleep disorder were excluded. Results were adjusted for age, gender, race or ethnicity, education, employment status, children aged ≤17 years in household, smoking status, leisure-time physical activity, alcohol use, any prescription medication use, histories of diabetes, cardiovascular disease, chronic obstructive pulmonary disease, arthritis, thyroid disease, liver disease, and cancer.
Compared to the participants who reported sleeping 7–9 hours per night, short sleepers were more likely to be obese (adjusted prevalence ratio [aPR]: 1.10, 95% confidence interval [CI]: 1.03, 1.16) and to have abdominal obesity (aPR: 1.07, 95% CI: 1.02, 1.11) (Table 5). Significant findings were observed among men, and participants aged 20–39 years. Furthermore, long sleepers were less likely to be obese than the reference group among all participants, whites, and those aged 40–59 years as shown by the fully adjusted model. The only statistically significant interaction was for age in the two models with the most adjustment. The adjusted prevalence ratios for the maximally adjusted model were 0.97 (95% confidence interval: 0.95, 0.99) per hour of sleep for obesity and 0.98 (95% CI: 0.96, 0.99) per hour of sleep for abdominal obesity.
TABLE 5.
Adjusted prevalence ratios (95% confidence interval) for associations between sleep duration and general and abdominal obesity among 13,742 participants aged ≥20 years, National Health and Nutrition Examination Survey 2005–2010
| Population | General obesity (body mass index ≥30 kg/m2)
|
Abdominal obesity (waist circumference ≥102 cm in men, ≥88 cm in women)
|
|||||||
|---|---|---|---|---|---|---|---|---|---|
| Sleep duration (hours/night)
|
P interaction | Sleep duration (hours/night)
|
P interaction | ||||||
| 1–6 | 7–9 | 10+ | 1–6 | 7–9 | 10+ | ||||
| Total (N = 13742) | Model 1a | 1.20 (1.13, 1.28) | 1.00 | 0.87 (0.70, 1.08) | 1.10 (1.05, 1.15) | 1.00 | 0.96 (0.85, 1.08) | ||
| Model 2b | 1.15 (1.09, 1.22) | 1.00 | 0.83 (0.67, 1.02) | 1.10 (1.06, 1.16) | 1.00 | 0.94 (0.83, 1.07) | |||
| Model 3c | 1.16 (1.10, 1.23) | 1.00 | 0.83 (0.67, 1.02) | 1.10 (1.05, 1.15) | 1.00 | 0.93 (0.82, 1.06) | |||
| Model 4d | 1.10 (1.03, 1.16) | 1.00 | 0.78 (0.64, 0.96) | 1.07 (1.02, 1.11) | 1.00 | 0.90 (0.80, 1.01) | |||
| Men (N = 6904) | Model 1a | 1.21 (1.10, 1.33) | 1.00 | 0.84 (0.61, 1.16) | 0.969 | 1.12 (1.03, 1.21) | 1.00 | 0.85 (0.66, 1.10) | 0.717 |
| Model 2b | 1.19 (1.07, 1.31) | 1.00 | 0.83 (0.60, 1.14) | 0.960 | 1.12 (1.04, 1.22) | 1.00 | 0.88 (0.68, 1.14) | 0.766 | |
| Model 3c | 1.21 (1.09, 1.33) | 1.00 | 0.82 (0.59, 1.14) | 0.905 | 1.13 (1.05, 1.23) | 1.00 | 0.87 (0.67, 1.13) | 0.694 | |
| Model 4d | 1.15 (1.04, 1.26) | 1.00 | 0.76 (0.57, 1.02) | 0.795 | 1.10 (1.02, 1.18) | 1.00 | 0.82 (0.65, 1.04) | 0.478 | |
| Women (N = 6838) | Model 1a | 1.20 (1.11, 1.30) | 1.00 | 0.88 (0.66, 1.18) | 1.12 (1.06, 1.18) | 1.00 | 0.99 (0.86, 1.14) | ||
| Model 2b | 1.11 (1.03, 1.21) | 1.00 | 0.82 (0.63, 1.07) | 1.08 (1.02, 1.14) | 1.00 | 0.95 (0.82, 1.09) | |||
| Model 3c | 1.12 (1.03, 1.21) | 1.00 | 0.82 (0.64, 1.05) | 1.07 (1.02, 1.13) | 1.00 | 0.94 (0.82, 1.07) | |||
| Model 4d | 1.05 (0.97, 1.14) | 1.00 | 0.80 (0.62, 1.03) | 1.04 (0.99, 1.10) | 1.00 | 0.92 (0.81, 1.06) | |||
| White (N = 6783) | Model 1a | 1.18 (1.09, 1.27) | 1.00 | 0.82 (0.61, 1.09) | 0.090 | 1.11 (1.05, 1.17) | 1.00 | 0.92 (0.78, 1.10) | 0.687 |
| Model 2b | 1.15 (1.06, 1.24) | 1.00 | 0.79 (0.60, 1.05) | 0.111 | 1.10 (1.04, 1.16) | 1.00 | 0.90 (0.75, 1.07) | 0.777 | |
| Model 3c | 1.16 (1.07, 1.25) | 1.00 | 0.77 (0.59, 1.02) | 0.093 | 1.10 (1.04, 1.16) | 1.00 | 0.89 (0.75, 1.05) | 0.801 | |
| Model 4d | 1.09 (<1.00, 1.18) | 1.00 | 0.72 (0.55, 0.93) | 0.130 | 1.06 (1.01, 1.12) | 1.00 | 0.85 (0.72, 〉1.00) | 0.855 | |
| African American (N = 2743) | Model 1a | 1.08 (0.99, 1.18) | 1.00 | 0.74 (0.49, 1.11) | 1.08 (1.00, 1.16) | 1.00 | 0.85 (0.66, 1.10) | ||
| Model 2b | 1.09 (1.00, 1.18) | 1.00 | 0.74 (0.49, 1.13) | 1.09 (1.02, 1.17) | 1.00 | 0.85 (0.68, 1.07) | |||
| Model 3c | 1.09 (1.01, 1.19) | 1.00 | 0.77 (0.52, 1.14) | 1.10 (1.02, 1.18) | 1.00 | 0.86 (0.69, 1.07) | |||
| Model 4d | 1.06 (0.97, 1.15) | 1.00 | 0.77 (0.52, 1.15) | 1.07 (<1.00, 1.16) | 1.00 | 0.85 (0.69, 1.05) | |||
| Mexican American (N = 2498) | Model 1a | 1.18 (1.07, 1.30) | 1.00 | 1.21 (0.87, 1.70) | 1.09 (0.99, 1.19) | 1.00 | 1.10 (0.81, 1.49) | ||
| Model 2b | 1.16 (1.06, 1.28) | 1.00 | 1.16 (0.84, 1.59) | 1.07 (0.99, 1.17) | 1.00 | 0.99 (0.74, 1.33) | |||
| Model 3c | 1.17 (1.06, 1.29) | 1.00 | 1.16 (0.86, 1.56) | 1.08 (0.99, 1.17) | 1.00 | 0.98 (0.74, 1.31) | |||
| Model 4d | 1.14 (1.03, 1.25) | 1.00 | 1.11 (0.82, 1.49) | 1.06 (0.98, 1.15) | 1.00 | 0.96 (0.73, 1.26) | |||
| Age 20–39 y (N = 4544) | Model 1a | 1.28 (1.16, 1.41) | 1.00 | 0.93 (0.60, 1.47) | 0.148 | 1.19 (1.09, 1.30) | 1.00 | 1.00 (0.73, 1.37) | 0.133 |
| Model 2b | 1.21 (1.10, 1.32) | 1.00 | 0.91 (0.57, 1.44) | 0.139 | 1.17 (1.08, 1.27) | 1.00 | 0.98 (0.72, 1.35) | 0.120 | |
| Model 3c | 1.24 (1.13, 1.36) | 1.00 | 0.93 (0.58, 1.47) | 0.036 | 1.19 (1.10, 1.29) | 1.00 | 0.99 (0.72, 1.36) | 0.044 | |
| Model 4d | 1.16 (1.05, 1.28) | 1.00 | 0.86 (0.54, 1.35) | 0.018 | 1.14 (1.05, 1.24) | 1.00 | 0.95 (0.69, 1.30) | 0.030 | |
| Age 40–59 y (N = 4604) | Model 1a | 1.18 (1.07, 1.29) | 1.00 | 0.64 (0.39, 1.06) | 1.06 (1.00, 1.13) | 1.00 | 0.89 (0.66, 1.21) | ||
| Model 2b | 1.14 (1.04, 1.25) | 1.00 | 0.59 (0.36, 0.99) | 1.07 (1.00, 1.14) | 1.00 | 0.82 (0.61, 1.12) | |||
| Model 3c | 1.14 (1.04, 1.24) | 1.00 | 0.58 (0.37, 0.93) | 1.06 (1.00, 1.13) | 1.00 | 0.82 (0.61, 1.09) | |||
| Model 4d | 1.08 (0.99, 1.18) | 1.00 | 0.56 (0.35, 0.89) | 1.03 (0.97, 1.09) | 1.00 | 0.78 (0.60, 1.03) | |||
| Age 60+ y (N = 4594) | Model 1a | 1.11 (1.01, 1.22) | 1.00 | 1.03 (0.77, 1.37) | 1.06 (1.00, 1.13) | 1.00 | 1.04 (0.89, 1.21) | ||
| Model 2b | 1.08 (0.99, 1.19) | 1.00 | 0.99 (0.75, 1.30) | 1.07 (1.01, 1.14) | 1.00 | 1.03 (0.89, 1.19) | |||
| Model 3c | 1.07 (0.98, 1.17) | 1.00 | 0.96 (0.74, 1.25) | 1.07 (1.00, 1.13) | 1.00 | 1.01 (0.88, 1.17) | |||
| Model 4d | 1.03 (0.94, 1.12) | 1.00 | 0.90 (0.68, 1.19) | 1.05 (0.99, 1.11) | 1.00 | 0.98 (0.85, 1.14) | |||
Adjusted for age.
Adjusted for age, gender, race or ethnicity, education, employment status, and children aged ≤17 years in household.
Adjusted for variables in model 2 plus smoking status, leisure-time physical activity, and alcohol use.
Adjusted for variables in model 3 plus any prescription medication use, depression score, histories of diabetes, cardiovascular disease, chronic obstructive pulmonary disease, arthritis, thyroid disease, liver disease, cancer, and sleep disorder.
Discussion
Our results that were obtained from a large nationally representative sample of adults in the United States demonstrate that sleep duration showed inverse linear associations with body mass index and waist circumference in models that did not adjust for depression score and diagnosed sleep disorders or in models that excluded participants with depression or a sleep disorder. Furthermore, these associations held for many of the major demographic subgroups examined in this study, and the associations did not differ by gender or among three major racial or ethnic groups. The association was particularly strong among adults aged 20–39 years.
Our results indicating that sleep duration is associated with anthropometric abnormalities are consistent with the findings of the majority of previous studies (2,3). The results of our analyses suggested that sleep duration was associated with body mass index and waist circumference in an inverse, linear fashion. In a review of 17 cross-sectional studies examining the associations between sleep duration and anthropometric measures in adults, seven studies found no association, six found a U-shaped association, and four found a negative linear association (3). The authors of that review did not offer possible explanations for the substantial heterogeneity that characterized the included studies. We surmise that differences in characteristics of participants, exclusion criteria, adjustment factors, location of studies, and assessment of sleep duration may partially account for the observed differences among studies. In another review of 20 cross-sectional studies in adults, five studies found no association, four studies found a inverse linear association, three studies found a U-shaped association, eight studies found that short sleep duration was associated with increased body mass index or obesity, and one study found that short sleep duration was associated with decreased body mass index (2). Some of the limitations inherent in many of these studies mentioned by the authors may help to explain some of the heterogeneity among the studies that were reviewed including definitions of normal sleep duration, lack of objective sleep duration measurements, and a focus on mostly nocturnal sleep duration. Like many of the investigations reviewed, our study used a single question to determine sleep duration.
We found no evidence to suggest that the associations between sleep duration and anthropometric measures varied by gender. Few studies have examined this issue. In a study of 3127 men and women aged 32–62 from France, body mass index was higher in short sleepers among women but not in men (6). In an analysis of 1585 male and 1888 female participants of the Coronary Artery Risk Development in Young Adults study, sleep duration was not associated with body mass index or waist circumference in either men or women in maximally adjusted models (7). Although gender differences in the association between sleep duration and anthropometric parameters appeared not to have been formally tested, the authors commented that the association between sleep duration and body composition appeared stronger and more consistent in women than men. Given the scarcity of data in this area, more research examining possible gender differences in the relationship between short sleep duration and body mass index is needed.
Little is known about the associations between sleep duration and anthropometric measures in nonwhite populations. An increased understanding of the relationships between sleep duration and anthropometric measures and measures of obesity is desirable in view of reported racial differences in sleep duration (8). Thus, our analyses among African Americans and Mexican Americans provide additional information in this area. Although associations among African Americans and Mexican Americans appeared weaker than among whites, the statistical test for interaction did not provide support for differences among these three racial or ethnic groups. In a prospective analysis of 332 African Americans and 775 Hispanic Americans aged 18–81 years, participants who slept ≤5 hours per night or ≥8 hours per night increased their body mass index to a greater extent than those who slept 6–7 hours (9). These findings suggest that additional research examining the relationships between sleep duration and measures of obesity in Hispanic populations is needed. Furthermore, research exploring racial or ethnic differences in sleep duration and how such differences relate to a host of health outcomes is also warranted.
Our analyses showed that the associations between sleep duration and anthropometric variables were stronger in younger adults compared with older adults. This effect modification by age has been reported before as demonstrated by an analysis of data from the NHANES I Epidemiologic Follow-up Study (10). In that study, the authors reported a significant association between sleep duration and body mass index among adults aged 32–49 years but not in adults who were older. Associations between sleep duration and anthropometric outcomes may conceivably be easier to demonstrate among young adults among whom potential confounders such as medical conditions, medication use, and other characteristics are of lesser concern.
Various mechanisms explain the associations between sleep duration and anthropometric measures. First, some research has suggested that energy intake is increased in short sleepers (11,12), but not all studies have found that short sleep duration is associated with increased energy intake (13,14). When short sleepers experience increased hunger and appetite (15,16), an increase in energy intake is likely. In addition, short sleepers may also modify their eating patterns and tilt towards increasing energy intake from snacks even if energy intake remains unchanged (14). Whether alterations in eating patterns towards less healthy ones even in the absence of changes in total energy intake promote weight gain and obesity deserves further exploration. Hormonal disturbances that affect hunger and appetite have been demonstrated. Thus, decreases in concentrations of leptin, which is a satiety hormone, and increases in concentrations of ghrelin, which increases hunger, have been found in short sleepers (15–19). Furthermore, sleep deprivation blunts the initial nocturnal increase in concentrations of ghrelin (18). Second, some research has also shown energy expenditure to be decreased among short sleepers (13,16) but other studies have yielded contrary findings (9)(11)(20–23). Our analyses suggested little difference in mean level of physical activity between short and normal sleepers. Thus, sleep deprivation may adversely affect the energy balance in humans leading to weight gain.
The strengths of our study feature a large nationally representative sample and the measurements of body mass index and waist circumference, but several limitations need to be acknowledged. First, the cross-sectional nature of our study precludes definitely establishing the directionality of the association. However, prospective studies have generally shown short sleep duration to be a risk factor for weight gain and obesity. Second, our estimate of sleep duration was based on a single question that asked about sleep duration during week days or work days. Thus, we were unable to consider sleep duration during weekends or nonwork days. Furthermore, because sleep duration was based on self-report, responses were subject to some degree of error. If the error was random, the likely impact on our estimates was to attenuate associations. However, some data suggest that self-reported sleep duration may be biased as adults tend to over-report their actual sleep duration (24,25). Correlations between self-reported habitual sleep duration with sleep duration measured by polysomnography or actigraphy have ranged from 0.18 to 0.47 (24,25) and with sleep duration measured by sleep diaries have been reported as high as 0.79 (26). Third, our results are subject to residual confounding although we controlled for a large set of potential confounders that included measurements of socioeconomic status, lifestyle behaviors, and comorbidities.
In conclusion, sleep duration showed an inverse linear association with anthropometric parameters, in the entire population and most demographic subgroups examined in this investigation, particularly in analyses limited to adults without depression or diagnosed sleep disorders. Although it has been generally assumed that sleep duration has shortened in the United States (27–31), a recent review concluded that results about trends in sleep duration from the 1960s on were inconsistent (32). Assuming that sleep duration is causally related to weight gain and obesity, lengthening the amount of sleep that adults get may exert beneficial effects on the future trajectory of the obesity epidemic in the United States.
Footnotes
Disclaimer: The findings and conclusions in this article are those of the authors and do not necessarily represent the official position of the Centers for Disease Control and Prevention.
Disclosure: The authors have no competing interests.
References
- 1.Knutson KL, Spiegel K, Penev P, Van CE. The metabolic consequences of sleep deprivation. Sleep Med Rev. 2007;11:163–178. doi: 10.1016/j.smrv.2007.01.002. [DOI] [PMC free article] [PubMed] [Google Scholar]
- 2.Patel SR, Hu FB. Short sleep duration and weight gain: A systematic review. Obesity (Silver Spring) 2008;16:643–653. doi: 10.1038/oby.2007.118. [DOI] [PMC free article] [PubMed] [Google Scholar]
- 3.Marshall NS, Glozier N, Grunstein RR. Is sleep duration related to obesity? A critical review of the epidemiological evidence. Sleep Med Rev. 2008;12:289–298. doi: 10.1016/j.smrv.2008.03.001. [DOI] [PubMed] [Google Scholar]
- 4.Cappuccio FP, Taggart FM, Kandala NB, et al. Meta-analysis of short sleep duration and obesity in children and adults. Sleep. 2008;31:619–626. doi: 10.1093/sleep/31.5.619. [DOI] [PMC free article] [PubMed] [Google Scholar]
- 5.Centers for Disease Control and Prevention. About the National Health and Nutrition Examination Survey. 2009 [WWW document]. URL http://www.cdc.gov/nchs/nhanes/about_nhanes.htm.
- 6.Cournot M, Ruidavets JB, Marquie JC, Esquirol Y, Baracat B, Ferrieres J. Environmental factors associated with body mass index in a population of Southern France. Eur J Cardiovasc Prev Rehabil. 2004;11:291–297. doi: 10.1097/01.hjr.0000129738.22970.62. [DOI] [PubMed] [Google Scholar]
- 7.St-Onge MP, Perumean-Chaney S, Desmond R, et al. Gender differences in the association between sleep duration and body composition: The cardia study. Int J Endocrinol. 2010;2010:726071. doi: 10.1155/2010/726071. Epub;%2009 Nov 12.: 726071. [DOI] [PMC free article] [PubMed] [Google Scholar]
- 8.Hale L, Do DP. Racial differences in self-reports of sleep duration in a population-based study. Sleep. 2007;30:1096–1103. doi: 10.1093/sleep/30.9.1096. [DOI] [PMC free article] [PubMed] [Google Scholar]
- 9.Hairston KG, Bryer-Ash M, Norris JM, Haffner S, Bowden DW, Wagenknecht LE. Sleep duration and five-year abdominal fat accumulation in a minority cohort: The IRAS family study. Sleep. 2010;33:289–295. doi: 10.1093/sleep/33.3.289. [DOI] [PMC free article] [PubMed] [Google Scholar]
- 10.Gangwisch JE, Malaspina D, Boden-Albala B, Heymsfield SB. Inadequate sleep as a risk factor for obesity: Analyses of the NHANES I. Sleep. 2005;28:1289–1296. doi: 10.1093/sleep/28.10.1289. [DOI] [PubMed] [Google Scholar]
- 11.Brondel L, Romer MA, Nougues PM, Touyarou P, Davenne D. Acute partial sleep deprivation increases food intake in healthy men. Am J Clin Nutr. 2010;91:1550–1559. doi: 10.3945/ajcn.2009.28523. [DOI] [PubMed] [Google Scholar]
- 12.St-Onge MP, Roberts AL, Chen J, et al. Short sleep duration increases energy intakes but does not change energy expenditure in normal-weight individuals. Am J Clin Nutr. 2011;94:410–416. doi: 10.3945/ajcn.111.013904. [DOI] [PMC free article] [PubMed] [Google Scholar]
- 13.Schmid SM, Hallschmid M, Jauch-Chara K, et al. Short-term sleep loss decreases physical activity under free-living conditions but does not increase food intake under time-deprived laboratory conditions in healthy men. Am J Clin Nutr. 2009;90:1476–1482. doi: 10.3945/ajcn.2009.27984. [DOI] [PubMed] [Google Scholar]
- 14.Nedeltcheva AV, Kessler L, Imperial J, Penev PD. Exposure to recurrent sleep restriction in the setting of high caloric intake and physical inactivity results in increased insulin resistance and reduced glucose tolerance. J Clin Endocrinol Metab. 2009;94:3242–3250. doi: 10.1210/jc.2009-0483. [DOI] [PMC free article] [PubMed] [Google Scholar]
- 15.Spiegel K, Tasali E, Penev P, Van CE. Brief communication: Sleep curtailment in healthy young men is associated with decreased leptin levels, elevated ghrelin levels, and increased hunger and appetite. Ann Intern Med. 2004;141:846–850. doi: 10.7326/0003-4819-141-11-200412070-00008. [DOI] [PubMed] [Google Scholar]
- 16.Schmid SM, Hallschmid M, Jauch-Chara K, Born J, Schultes B. A single night of sleep deprivation increases ghrelin levels and feelings of hunger in normal-weight healthy men. J Sleep Res. 2008;17:331–334. doi: 10.1111/j.1365-2869.2008.00662.x. [DOI] [PubMed] [Google Scholar]
- 17.Taheri S, Lin L, Austin D, Young T, Mignot E. Short sleep duration is associated with reduced leptin, elevated ghrelin, and increased body mass index. PLoS Med. 2004;1:e62. doi: 10.1371/journal.pmed.0010062. [DOI] [PMC free article] [PubMed] [Google Scholar]
- 18.Dzaja A, Dalal MA, Himmerich H, Uhr M, Pollmacher T, Schuld A. Sleep enhances nocturnal plasma ghrelin levels in healthy subjects. Am J Physiol Endocrinol Metab. 2004;286:E963–E967. doi: 10.1152/ajpendo.00527.2003. [DOI] [PubMed] [Google Scholar]
- 19.Chaput JP, Despres JP, Bouchard C, Tremblay A. Short sleep duration is associated with reduced leptin levels and increased adiposity: Results from the Quebec family study. Obesity (Silver Spring) 2007;15:253–261. doi: 10.1038/oby.2007.512. [DOI] [PubMed] [Google Scholar]
- 20.Imaki M, Hatanaka Y, Ogawa Y, Yoshida Y, Tanada S. An epidemiological study on relationship between the hours of sleep and life style factors in Japanese factory workers. J Physiol Anthropol Appl Human Sci. 2002;21:115–120. doi: 10.2114/jpa.21.115. [DOI] [PubMed] [Google Scholar]
- 21.Hasler G, Buysse DJ, Klaghofer R, et al. The association between short sleep duration and obesity in young adults: a 13-year prospective study. Sleep. 2004;27:661–666. doi: 10.1093/sleep/27.4.661. [DOI] [PubMed] [Google Scholar]
- 22.Patel SR, Malhotra A, White DP, Gottlieb DJ, Hu FB. Association between reduced sleep and weight gain in women. Am J Epidemiol. 2006;164:947–954. doi: 10.1093/aje/kwj280. [DOI] [PMC free article] [PubMed] [Google Scholar]
- 23.Chaput JP, Despres JP, Bouchard C, Tremblay A. The association between sleep duration and weight gain in adults: a 6-year prospective study from the Quebec Family Study. Sleep. 2008;31:517–523. doi: 10.1093/sleep/31.4.517. [DOI] [PMC free article] [PubMed] [Google Scholar]
- 24.Lauderdale DS, Knutson KL, Yan LL, Liu K, Rathouz PJ. Self-reported and measured sleep duration: how similar are they? Epidemiology. 2008;19:838–845. doi: 10.1097/EDE.0b013e318187a7b0. [DOI] [PMC free article] [PubMed] [Google Scholar]
- 25.Silva GE, Goodwin JL, Sherrill DL, et al. Relationship between reported and measured sleep times: the sleep heart health study (SHHS) J Clin Sleep Med. 2007;3:622–630. [PMC free article] [PubMed] [Google Scholar]
- 26.Patel SR, Ayas NT, Malhotra MR, et al. A prospective study of sleep duration and mortality risk in women. Sleep. 2004;27:440–444. doi: 10.1093/sleep/27.3.440. [DOI] [PubMed] [Google Scholar]
- 27.Centers for Disease Control and Prevention. Percentage of adults who reported an average of <6 hours of sleep per 24-hour period, by sex and age group—United States, 1985 and 2004. MMWR Morb Mortal Wkly Rep. 2005;54:933. [Google Scholar]
- 28.Basner M, Fomberstein KM, Razavi FM, et al. American time use survey: sleep time and its relationship to waking activities. Sleep. 2007;30:1085–1095. doi: 10.1093/sleep/30.9.1085. [DOI] [PMC free article] [PubMed] [Google Scholar]
- 29.Kronholm E, Partonen T, Laatikainen T, et al. Trends in self-reported sleep duration and insomnia-related symptoms in Finland from 1972 to 2005: A comparative review and re-analysis of Finnish population samples. J Sleep Res. 2008;17:54–62. doi: 10.1111/j.1365-2869.2008.00627.x. [DOI] [PubMed] [Google Scholar]
- 30.Centers for Disease Control and Prevention. QuickStats: Percentage of adults aged >18 years who reported an average of <6 hours of sleep† per 24-hour period, by sex and age group—National Health Interview Survey, United States, 1985 and 2006. MMWR Morb Mortal Wkly Rep. 2008;57:209. [Google Scholar]
- 31.Knutson KL, Van CE, Rathouz PJ, DeLeire T, Lauderdale DS. Trends in the prevalence of short sleepers in the USA: 1975–2006. Sleep. 2010;33:37–45. doi: 10.1093/sleep/33.1.37. [DOI] [PMC free article] [PubMed] [Google Scholar]
- 32.Bin YS, Marshall NS, Glozier N. Secular trends in adult sleep duration: A systematic review. Sleep Med Rev. 2012;16:223–230. doi: 10.1016/j.smrv.2011.07.003. [DOI] [PubMed] [Google Scholar]