Abstract
Chirp- and random-based coded excitation methods have been proposed to reduce standing wave formation and improve focusing of transcranial ultrasound. However, no clear evidence has been shown to support the benefits of these ultrasonic excitation sequences in vivo. This study evaluates the chirp and periodic selection of random frequency (PSRF) coded-excitation methods for opening the blood-brain barrier (BBB) in mice. Three groups of mice (n=15) were injected with polydisperse microbubbles and sonicated in the caudate putamen using the chirp/PSRF coded (bandwidth: 1.5-1.9 MHz, peak negative pressure: 0.52 MPa, duration: 30 s) or standard ultrasound (frequency: 1.5 MHz, pressure: 0.52 MPa, burst duration: 20 ms, duration: 5 min) sequences. T1-weighted contrast-enhanced MRI scans were performed to quantitatively analyze focused ultrasound induced BBB opening. The mean opening volumes evaluated from the MRI were 9.38±5.71 mm3, 8.91±3.91 mm3 and 35.47 ± 5.10 mm3 for the chirp, random and regular sonications, respectively. The mean cavitation levels were 55.40±28.43 V.s, 63.87±29.97 V.s and 356.52±257.15 V.s for the chirp, random and regular sonications, respectively. The chirp and PSRF coded pulsing sequences improved the BBB opening localization by inducing lower cavitation levels and smaller opening volumes compared to results of the regular sonication technique. Larger bandwidths were associated with more focused targeting but were limited by the frequency response of the transducer, the skull attenuation and the microbubbles optimal frequency range. The coded methods could therefore facilitate highly localized drug delivery as well as benefit other transcranial ultrasound techniques that use higher pressure levels and higher precision to induce the necessary bioeffects in a brain region while avoiding damage to the surrounding healthy tissue.
Keywords: blood-brain barrier opening, chirp, coded ultrasonic excitation, focused ultrasound, standing wave, transcranial ultrasound
1. Introduction
The potential of noninvasive focused ultrasound (FUS) for enhancing drug delivery or as a substitute for surgical intervention has been demonstrated for the treatment of a variety of neurological disorders. In the first case, the administration of FUS combined with microbubbles has been shown to transiently and locally open the blood-brain barrier (BBB) (Hynynen et al.; 2001; Choi et al.; 2007) allowing the passage of pharmacological agents such as anticancer therapeutic drugs (Kinoshita et al.; 2006), therapeutic antibodies (Raymond et al.; 2008), neurotrophic factors (Baseri et al.; 2012), adeno-associated virus (Alonso et al.; 2013; Wang et al.; 2015), and neural stem cells (Burgess et al.; 2011). Ultrasound has also been proven capable of enhancing the fibrinolytic effect of drugs used in ischemic stroke for dissolving blood clots - known as sonothrombolysis (Alexandrov; 2009; Meairs et al.; 2012). Furthermore, the High-Intensity Focused Ultrasound (HIFU) can thermally annihilate brain tumors (Coluccia et al.; 2014) or brain tissue cells. Brain ablation can reduce hyper-excitable activity of neurons in such cases as essential tremors (Elias et al.; 2013; Chang et al.; 2015) and chronic neuropathic pain (Martin et al.; 2009). More recently, ultrasound has also been proven capable of modulating the neuronal activity (Tyler et al.; 2008; King et al.; 2013; Deffieux et al.; 2013) providing thus a wider range of applications of FUS as an alternative for the transcranial magnetic stimulation, deep brain stimulation, and optogenetics.
The use of ultrasound for the treatment of neurological disorders remains challenging because of the skull. The high attenuation coefficient, variable thickness and heterogeneity of the skull cause scattering and absorption of ultrasound waves. As a result, the ultrasound beam can be distorted due to aberration effects and standing waves that can be formed, which in turn prevent correct targeting through the skull. Incorrect targeting when using high power ultrasound (sonothrombolysis, tumor ablation) may lead to severe adverse effects such as hemorrhage and the permanent damage of healthy tissues (Daffertshofer et al.; 2005; Molina et al.; 2009; Tsivgoulis et al.; 2010). Moreover, the use of microbubbles aggravates the adverse effects provoked by cavitation.
Several approaches were proposed and examined in order to achieve an effective transcranial sonication. Large phased arrays have been used for the correction of ultrasound focusing with computed tomographic based corrections of the phase and amplitude ultrasound signals (Hynynen and Jolesz; 1998; Hynynen et al.; 2006; Marquet et al.; 2013; Pajek and Hynynen; 2013). The chirp-coded ultrasonic excitation method has been used in the diagnostic ultrasound as a technique to improve range, resolution, signal-to-noise ratio of images (O'Donnell; 1992; Pedersen et al.; 2003; Cobbold; 2007) and it has been demonstrated capable of reducing standing waves for both diagnostic (Mitri et al.; 2005) and therapeutic ultrasound (Deffieux and Konofagou; 2010). In addition, standing wave formation can be minimized using other methods such as multiple ultrasonic beams (Kamimura et al.; 2013), short pulses coded ultrasonic excitation (O'Reilly et al.; 2011; Choi et al.; 2011), and random-based coded ultrasonic excitation (Tang and Clement; 2010; Furuhata and Saito; 2013).
Nonetheless, the majority of the techniques developed for standing wave suppression and correction of focus aberration have been evaluated in simulations, ex vivo, and phantoms experiments, except studies with short pulses coded ultrasonic excitation (O'Reilly et al.; 2011; Choi et al.; 2011). However, in the clinical setting, many other parameters interfere with the results of the transcranial ultrasound therapy. As of today, not all mechanisms involved in this form of therapy are fully understood and the aforementioned models unfortunately do not take into account the heterogeneity of soft tissue or the variability of drug uptake and clearance among subjects. Therefore, in vivo studies are critical for more complete assessment of therapeutic efficacy and to expand our understanding of the mechanisms involved in the techniques. The use of large phased arrays and short pulse-coded excitation have already been proven valuable in in vivo studies. Evidence of the in vivo efficacy of the chirp- and random-coded ultrasonic excitation methods in terms of improvement in focusing, suppression of standing waves and effects of multifrequency excitation is, however, currently limited to their imaging capabilities.
In the study reported herein, the capability of the chirp- and random-based coded ultrasonic excitation in improving the targeting of the therapeutic FUS is investigated using an ultrasound-mediated BBB opening protocol in mice. The evaluation of the focusing capability was quantified by the volume of BBB opening and the cavitation dose was evaluated for each technique. The objective was to sweep the frequency linearly or randomly in order to activate differently sized microbubbles and avoid standing wave formation.
2. Methods
The Chirp and the Periodic Selection of Random Frequency (PSRF) (Furuhata and Saito; 2013) coded ultrasonic excitation techniques were first assessed in computational simulations followed by experiments in mice in vivo. First, the customized signal generation for both techniques are introduced. Then, the acoustic pressure field generated by the signals are evaluated in simulations with acoustic properties based on μCT images. Subsequently, sonication was performed for blood brain barrier (BBB) opening, where cavitation was monitored through Passive Cavitation Detection (PCD) in real time. The BBB opening was subsequently imaged by Magnetic Resonance Imaging (MRI). The safety of the methods used was determined through histology of the mouse brains.
2.1. Coded ultrasonic excitation methods
The Chirp and PSRF methods consisted in generating ultrasound-coded transmitting signals that spanned linear or random frequency bandwidths. The signals were composed of sinusoidal waves with the frequency f(t) varying linearly or randomly according to the chosen method. The signals are described by
| (1) |
where ϕ(t) is the time domain function of the phase and K(f(t)) is the experimental calibration factor that varies the amplitude of the signals according to the frequency f(t) taking into account the transducer frequency response and the mouse skull attenuation.
Chirp
In the regular linear chirp, the instantaneous frequency varies linearly with time. Here, the signal was customized to allow N full cycles of pulses for each f(t) making ϕ(t) constant for a period of time . The minimum number of cycles was set to increase the oscillation of the bubbles and enhance the BBB opening based on a previous study (Choi et al.; 2011). The frequencies shift according to the following series:
| (2) |
where the index n indicates the chosen frequency in the frequency bandwidth fn = f0+nΔf, where f0 is the starting frequency and Δf is the frequency step. By integrating the series with an interval f0 to fn, the instantaneous frequency f(t) is
| (3) |
and the chirp signal is given by:
| (4) |
PSRF
In the random method, the frequencies were randomly sorted using the same frequency bandwidth and interval Δf as the ones used in the chirp method. The frequencies were then varied periodically, the selected frequency was kept constant for the same period adopted in the chirp method, with derivative of the phase angle expressed by (Furuhata and Saito; 2013):
| (5) |
2.2. Simulations
2.2.1. μCT images
The acoustic properties of the mouse head were obtained from μCT images. One mouse (mass: 24 g, sex: male, C57BL/6, Harlan, Indianapolis, IN, USA) was sacrificed immediately before μCT scanning and placed in a zip lock bag sprayed with chlorine dioxide. The carcass was secured in a plastic tube and placed in a μCT scanner (R_mCT2, Rigaku, Tokyo, Japan) where images from a volume of 512 by 512 by 512 pixels and resolution of 80 μm in the three directions were acquired. The density and sound speed were converted using the Hounsfield units of the coronal slices spanning the caudate putamen (6 mm anterior from Lambda). The conversion of the Hounsfield units to density and sound speed maps was based on experimental data fittings (Schneider et al.; 1996; Mast; 2000) using the Hounsfield unit conversion tool provided by the k-Wave Matlab toolbox (Treeby et al.; 2012). The attenuation coefficient for the brain was assumed as 0.6 dB.cm−1 based on soft tissue values (Cobbold; 2007). The attenuation coefficient for the skull was set as 29 dB.cm−1 based on the calibration (skull thickness from the μCT equal to 0.5 mm, ultrasound attenuation in the caudate putamen equal to 15% at 1 MHz). The brain and the skull regions were segmented by thresholding the impedance map obtained by the multiplication of the density and sound speed maps, where Zbrain =1.49 to 2.00 MRayls and Zskull >2.00 MRayls, respectively.
2.2.2. Numerical simulation
The numerical simulations were performed using the k-Wave Matlab toolbox (Treeby et al.; 2012). The toolbox provides the k-space pseudo spectral time domain solution for the coupled first-order acoustic equations for heterogeneous media given by
| (6) |
| (7) |
| (8) |
where u is the acoustic particle velocity, p is the acoustic pressure, ρ is the acoustic density, ρ0 is the equilibrium density, c0 is the isentropic sound speed, d is the acoustic particle displacement, and L is the linear integro-differential operator that accounts for acoustic absorption (α) that follows a frequency power law in the form of α = α0ωy. The k-Wave Matlab Toolbox limits the alpha power coefficient y to a scalar. This limitation does not allow selection of different y values for each of the different media in the simulation (brain, skull, water). In this simulation, the power law absorption was modeled with the alpha power equal to 1, which is a good assumption for simulating the frequency dependence of soft tissue absorption (Cobbold; 2007).
A two-dimensional computational grid was generated covering an area of 80 by 80 mm, with 80 μm of resolution. An ultrasound source with the therapeutic transducer dimensions (focus = 60 mm, aperture = 70 mm, inner hole diameter = 20 mm) was placed on the top of the grid. The source was driven by time-varying pressure signals based on the chirp and PSRF methods (see equation 1) with the calibration factor K(f(t)) set constant equal to 1. In addition, a mono frequency sinusoidal time varying pressure source S(t) was simulated to compare with the chirp and PSRF methods.
| (9) |
where f =1.5 MHz and A =1. The density, sound speed and attenuation maps were loaded in the toolbox workspace with air replacing the void. The ultrasound focal spot was placed on the region of the caudate putamen (anterior/posterior: 6 mm, medial/lateral: 2.2 mm, dorsal/ventral: 3 mm referenced from Lambda). A water cone shaped container was used to couple the source to the mouse skull. The acoustic parameters were varied with the frequency bandwidth ranging from 1.23 to 2.29 MHz, frequency steps (for chirp and random) of 1 kHz and 10 kHz, and number of cycles equal 3. The Peak Negative Pressure (PNP) was recorded in the full 2D computational grid.
Simulations were carried out on a 64-bit workstation (Precision WorkStation T7610, Dell, Austin, TX) with Intel(R) Xeon(R) CPU E5-2630 v2 2.60 GHz processors, 64 GB of RAM and a 6 GB GPU board (Tesla C2075, NVIDIA, Santa Clara, CA, USA).
2.3. Animal preparation
All procedures involving animals were approved and conducted in accordance with the Columbia University Institutional Animal Care and Use Committee. A total of 19 C57BL/6 mice (mass: 20–28 g, sex: male, Harlan, Indianapolis, IN, USA) were used in this study. Two mice were anesthetized with 4% isoflurane and oxygen at 0.8 L.min−1 (SurgiVet, Smiths Medical PM, Inc., Wisconsin, USA), sacrificed with cervical dislocation and used in the calibration. The other 17 mice were anesthetized with 1.0 – 2.5% isoflurane and oxygen at 0.8 L.min−1 and used in the BBB opening study to be described in the next sections.
2.4. Calibration factor K(f(t))
A calibration of the therapeutic transducer (center frequency: 1.94 MHz; −6 dB frequency bandwidth: 1.28-2.31 MHz; diameter: 70 mm; Imasonic SAS, Voray-sur-l'Ognon, France) was conducted with a hydrophone (model HGL-0200, ONDA Corp., Sunnyvale, CA, USA) on 2 freshly excised mouse skulls in a degassed water tank. The skulls were soaked in degassed water for 4h prior to the calibration. The transducer was attached to a 3-D positioning system (Velmex Inc., Lachine, QC, Canada) and placed above the hydrophone with the focus on the sensitive tip of the hydrophone. The skulls were attached to a secondary 3-D positioning system (Velmex Inc., Bloomfield, NY, USA) and carefully placed between the hydrophone and the transducer with the hydrophone sensitive tip positioned in the coordinates corresponding to the caudate putamen (anterior/posterior: 6 mm, medial/lateral: ±2.2 mm, dorsal/ventral: 3 mm referenced from Lambda). A PC workstation controlled the 3-D positioning systems and the digitizer (Gage Applied Technologies Inc., Lachine, QC, Canada) that acquired the ultrasound frequency bandwidth assessed from 0.30 to 3.00 MHz with 0.01 MHz intervals on the left and right caudate putamen of each sample.
2.5. Sonication protocol
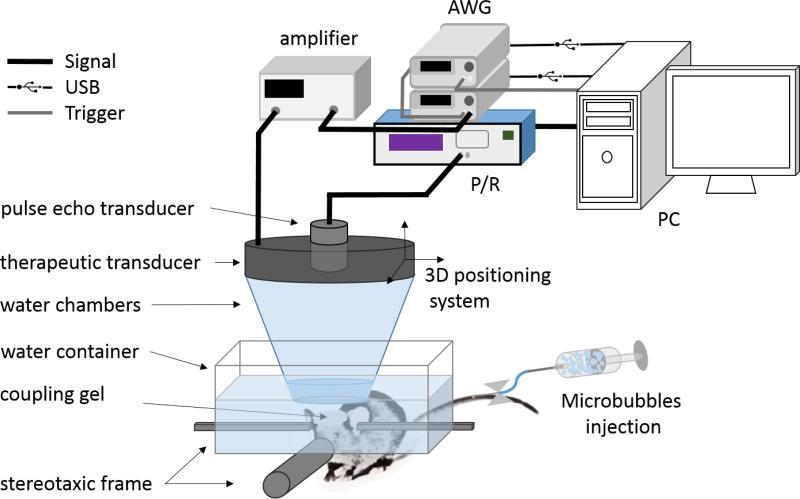
Isoflurane was continuously delivered at 1.0% to the mice during the procedure described here (SurgiVet, Smiths Medical PM Inc., Waukesha, WI, USA). The mice had their heads shaved and thereafter immobilized within a stereotaxic frame (David Kopf Instruments, Tujunga, CA, USA). A container filled with degassed water was placed above each mouse with the head coupled to the bottom of the container using coupling gel. The therapeutic transducer (described in subsection 2.4) and a pulse-echo transducer with their foci overlapping were mounted together with an acrylic cone filled with deionized degassed water. The pulse-echo transducer (center frequency: 10 MHz, focal depth: 60 mm, diameter: 22.4 mm; model U8517133, Olympus NDT, Waltham, MA, USA) was used for targeting and served as a passive cavitation detector for monitoring the cavitation activity in the brain during sonication. The transducer assembly was attached to a 3-D positioning system (Velmex Inc., Lachine, QC, Canada) (figure 1). Both Chirp and PSRF coded excitation signals were generated in Matlab, uploaded to the arbitrary waveform generator (33220A, Agilent Technologies, Palo Alto, CA, USA), driving the therapeutic transducer through a 50 dB power amplifier (325LA, ENI Inc., Rochester, NY, USA).
Figure 1.
Experimental setup for ultrasound-mediated BBB opening. The animals were positioned in a stereotaxic frame where a mixture of 1% isoflurane and oxygen (0.8 L.min−1) was constantly delivered during the sonication. Microbubbles were injected through the tail vein immediately prior to the sonications. A degassed water chamber and ultrasonic gel were used to couple the animal's head to the ultrasonic transducers. A therapeutic transducer with bandwidth 1.23-2.29 MHz was driven by an arbitrary waveform generator (AWG) and a second 10 MHz transducer was used for aligning the transducers foci on the caudate putamen. This second pulse-echo transducer was also used as the detector for the PCD monitoring during the sonications.
Immediately prior to sonication of the right caudate putamen, all mice were injected with lipid-shelled, polydisperse microbubbles (table 1) as previously described in Wang et al. (2015). The left hemisphere of each mouse was left intact as control. The mice were randomly assigned to one of the three groups: Chirp, PSRF, and Regular (n = 5 per group). The Chirp group was sonicated using the chirp method with fo =1.5 MHz, ff =1.9 MHz, Δf = 10 kHz, PNP = 0.52 MPa, and N = 3 cycles providing a 70.7 μs pulse length repeating this sequence continuously without interruption for an ON-time of 30 s. The PSRF group was sonicated using the PSRF method with the same parameters. The Regular group was sonicated using a pulsed wave with f = 1.5 MHz, 20 ms, 5 Hz of burst rate, 0.52 MPa for 5 min providing a total ON-time of 30 s for all methods used.
Table 1.
Microbubbles properties. Measurements* performed immediately after activation.
| Amounta per mL | Meanb μm | S.D.c μm | C.V.d | d10e μm | d50e μm | d90e μm | |
|---|---|---|---|---|---|---|---|
| Sample 1 | 6.569e9 | 1.37 | 1.02 | 74.5% | 0.729 | 1.07 | 2.20 |
| Sample 2 | 6.821e9 | 1.39 | 0.991 | 71.5% | 0.729 | 1.10 | 2.21 |
Multisizer 3 Coulter Counter, Beckman Coulter, Fullerton, CA, USA.
number of particles per mL
average diameter of microbubbles
standard deviation of the microbubble diameter distribution
coefficient of variation in diameter (SD/mean)
d10, d50, d90: number of percentile of microbubble diameters
2.6. Passive Cavitation Detection
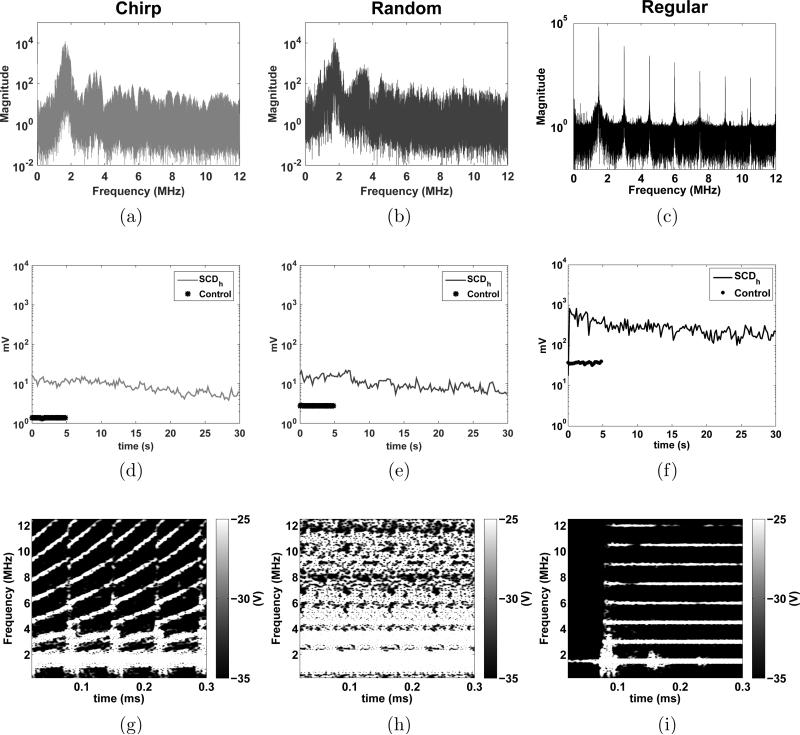
A second arbitrary waveform generator (33220A, Agilent Technologies, Palo Alto, CA, USA) was used to synchronize the therapeutic transducer with the Passive Cavitation Detection (PCD) system at 5 Hz pulse repetition frequency for all types of waveform. The monitoring transducer was connected to a pulser-receiver (NDT-5800, Panametrics, MA, USA) in receiving mode with a 20-dB amplification, and the PCD signals were digitized at 100 MHz (Gage Applied Technologies Inc., Lachine, QC, Canada) and the Fast Fourier Transform of the PCD signal was then calculated on Matlab providing the real-time frequency spectra. The PCD acquisition was performed during the whole sonication time, with the whole pulse (20 ms) saved for regular waveform while a 5 Hz sampling with each pulse duration of 6.67 ms was used to save for continuous coded waveforms. Five-seconds-long PCD signals were acquired before the microbubbles injections and used as a control baseline. The stable cavitation dose using harmonics (SCDh) was quantified based on the previous method (Wu et al.; 2014). For the standard waveform, the harmonic signal (n*f; n = 2, 3, 4, 5, 6; f = 1.5 MHz; maximum amplitude within a bandwidth of 200 Hz around the harmonic frequency) was filtered after taking the root mean square (RMS) of the voltage spectral amplitude. On the other hand, for coded waveforms, signals within bandwidths of 3.0-3.8 MHz, 4.5-5.7 MHz, 6.0-7.6 MHz, and 7.5-9.5 MHz was filtered in order to extract the 2nd to 6th harmonics of the emitted sweeping frequency ranged in 1.5-1.9 MHz. The RMS spectral amplitude of the voltage was integrated over the entire sonication duration and was defined as the SCDh for each sonication.
2.7. Magnetic Resonance Imaging
Gadodiamide (287 mg/mL, Omniscan™ Novaplus, Novation LLC, TX, USA) was delivered intraperitoneally (IP) to all mice immediately after the sonication. After the IP injection, 30 min was allowed before the acquisition of the MRI images. The MRI images (320 by 320 matrix size, spatial resolution of 80 by 80 μm2, slice thickness of 400 μm) were generated for all mice with a 2-D FLASH T1-weighted sequence using a 9.4-T microimaging MRI system (DRX400, Bruker BioSpin, Boston, MA, USA). The images were used to determine the BBB opening volume and to assess whether the methods caused any brain damage (i.e. edema). The volume of opening was quantified inside a manually selected ellipsoid covering the sonicated (right) hemisphere of the brain (Samiotaki et al.; 2012). The ellipsoid was set with a major diameter of 5.5 mm, minor diameter of 4.0 mm, and a 0.4 mm height throughout 9 slices. The intensity threshold was determined using the non-sonicated hemisphere as reference and the contrast-enhanced voxels of the vessels and ventricles were excluded. The BBB opening volume was determined counting the total number of voxels with intensity values equal to or above 2.5 standard deviations of the reference.
2.8. Histology
The safety of the applied sonication methods were analyzed with Hematoxylin and Eosin (H&E) stained brain sections. One week after sonication, all mice were transcardially perfused and fixed in 4% paraformaldehyde. Following postfixation processing, the brains were paraffin embedded and then sectioned horizontally at 6 μm thickness in 8 separate levels with 180 μm intervals to cover the caudate putamen. At each level, four sections were acquired and stained with H&E. Bright-field images of the stained sections were acquired using a light microscope (BX61; Olympus, Melville, NY, USA) and were white corrected. Histological evaluation was performed by a trained observer without knowledge of the location and parameters of sonication. The samples were evaluated for red blood cell extravasation into the brain parenchyma as well as cell and tissue loss.
3. Results
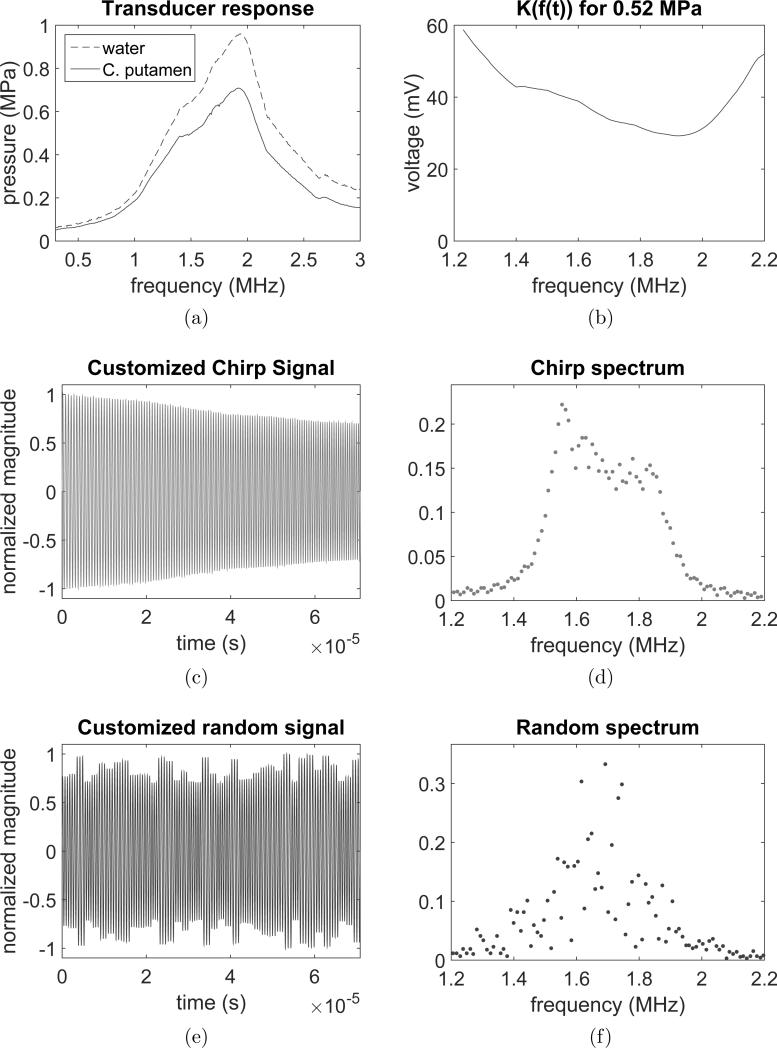
The spectral responses of the FUS transducer were obtained from calibration in water and with the hydrophone positioned behind the skull in the caudate putamen region as shown in figure 2a. The calibration factor K(f(t)) was based on the transducer response by taking into account the skull attenuation in targeting the caudate putamen and is provided in figure 2b. The acoustic pressure was set to be constant within the bandwidth of 1.5 to 1.9 MHz using both chirp (figure 2c-d) and random-based (figure 2e-f) methods. The non-variability of the pressure with the frequency was important to avoid a decrease of the bubble-resonance frequency with pressure (Doinikov et al.; 2009). The waveform of the random-based method shows subtle changes in the randomly selected frequencies. The subtle changes in the instantaneous frequency introduce other frequencies in the spectrum that increase some components in the frequency bandwidth.
Figure 2.
Chirp and PSRF signal characterization. (a) Spectral transducer response (in water) and spectral transducer response with skull attenuation (in caudate putamen region), (b) calibration factor Kf(t) based on the spectral transducer response, (c) customized chirp signal, (d) customized chirp signal spectrum, (e) customized PSRF signal, (f) customized PSRF signal spectrum.
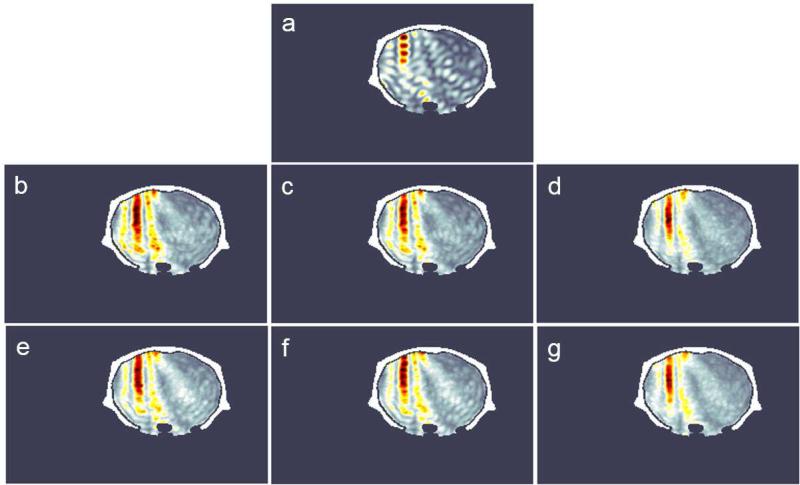
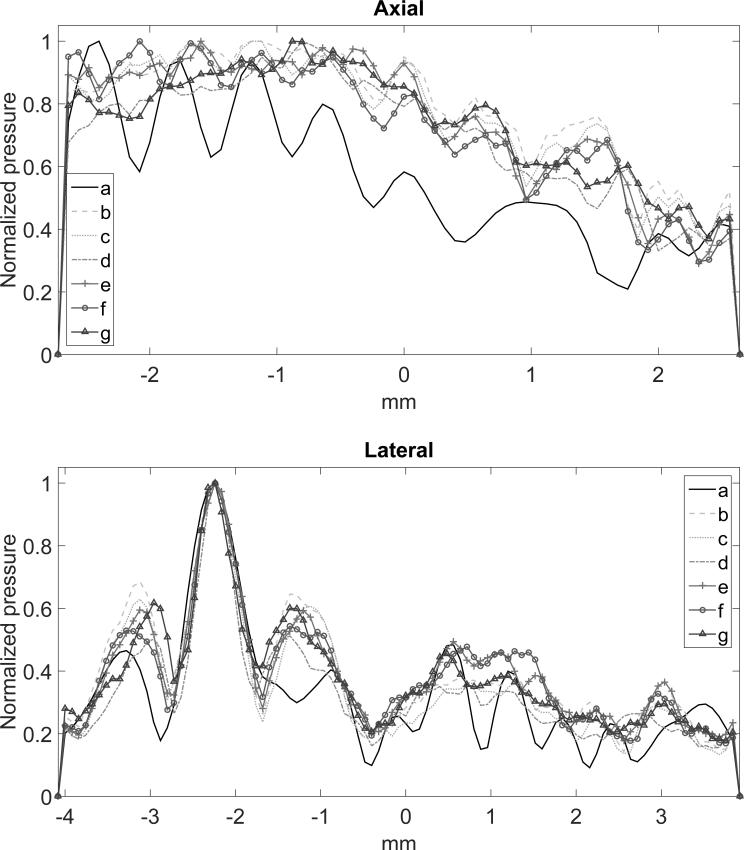
Figure 3 shows the simulated peak negative pressure fields for the three evaluated methods. The regular sonication presented standing wave formation on the simulations (figure 3a). The chirp and random methods were explored by varying the bandwidth, the instantaneous frequency steps f(t) and the number of cycles. For the chirp method, the best parameters found were within the bandwidth of 1.23 to 2.29 MHz (bandwidth of the therapeutic transducer), 10 kHz of frequency steps and 2 cycles (figure 3d). In this case, the interference of the waves led to better focusing and lower standing wave formation. In the worst case, (figure 3c) higher side lobes and standing waves were observed. Additionally, points of maxima were found outside the focus due to the interference pattern caused by the multiple scattering of the waves in the brain. The random-based method presented better focusing at 1.23 to 2.29 MHz, 1 kHz of frequency steps and 3 cycles (figure 3g). The axial and lateral beam profiles for the three methods are presented in figure 4. Figure 4 shows the beam profiles for the chirp and random methods, compared to the profile obtained from the regular sonication. The axial profile shows the standing wave formation produced by the regular sonication, which is not observed in the coded methods. The lateral beam profile at the focus shows the side lobes generated by the three techniques. The regular sonication presented higher oscillations on the pressure field with higher peak negative pressure, which is more likely to promote cavitation. The simulation indicates that larger frequency bandwidths provide more effective focusing (figures 3d and g). However, in the in vivo validation, the BBB opening was not consistently achieved using larger frequency bandwidths. Thus, the maximum frequency bandwidth was set from 1.5 to 1.9 MHz (figure 3b and e) in the experimental results shown here. Further studies are necessary to explore if the frequency bandwidth for obtaining effective BBB opening is limited by the microbubble size.
Figure 3.
Simulated peak negative pressure fields for: (a) regular sonication (1.5 MHz); (b) Chirp: 1.5-1.9 MHz, 10 kHz, 3 cycles; (c) Chirp: 1.5-1.9 MHz, 10 kHz, 2 cycles; (d) Chirp: 1.23-2.29 MHz, 10 kHz, 3 cycles; (e) Random: 1.5-1.9 MHz, 10 kHz, 3 cycles; (f) Random: 1.5-1.9 MHz, 1 kHz, 2 cycles; and (g) Random: 1.23-2.29 MHz, 1 kHz, 3 cycles.
Figure 4.
(a) Axial and (b) lateral beam profiles in the focus region obtained from the simulated pressure fields found in figure 3.
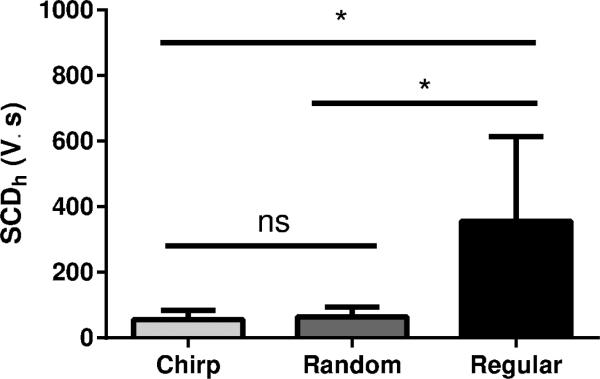
The PCD detected the frequency components scattered by the microbubbles in the brain vascular system during sonication. The real-time PCD signals for chirp, random, and regular methods are presented in figure 5a, b and c, respectively. The plots in the middle (figure 5d, e and f) show the cavitation level SCDh calculated for the harmonics of the frequency components for each method. Below each plot are the spectrograms for each method (figure 5g, h and i) . In the chirp method, the harmonics and ultra-harmonics can be observed in the spectrogram of figure 5g where the frequency components increase with time following the linear increase of the instantaneous frequency. In the random method, the spectrogram shows larger harmonic frequency bands characterizing multiple components being scattered over time. The larger frequency band indicates the presence of inertial cavitation and ultimately higher bubble cavitation activity. The regular sonication presented clearly defined harmonic components of the fundamental frequency 1.5 MHz used for this method. Figure 6 shows the ANOVA statistical analysis of the cavitation level (figure 5d, e and f). The average cavitation level for the regular sonications was found to be higher than for the coded excitation methods. The mean cavitation levels were 55.40±28.43 V.s, 63.87±29.97 V.s and 356.52 ± 257.15 V.s for the chirp, random and regular sonications, respectively. No significant difference was found between the coded excitation methods.
Figure 5.
Passive Cavitation Detection (PCD) monitoring. Frequency spectra obtained from the PCD for (a) chirp, (b) random and (c) regular methods; Cavitation levels for each method over the sonication time (d, e, and f, respectively); Realtime spectrograms of the PCD signals for each method (g, h, and i, respectively) with the colorbar representing the amplitude of the short-time Fourier transform spectrum.
Figure 6.
ANOVA statistical analysis of the cavitation levels for each group. No statistically significant differences (ns) was found between the chirp and random groups. Significant differences (*) were found between the regular and chirp groups and regular and random groups.
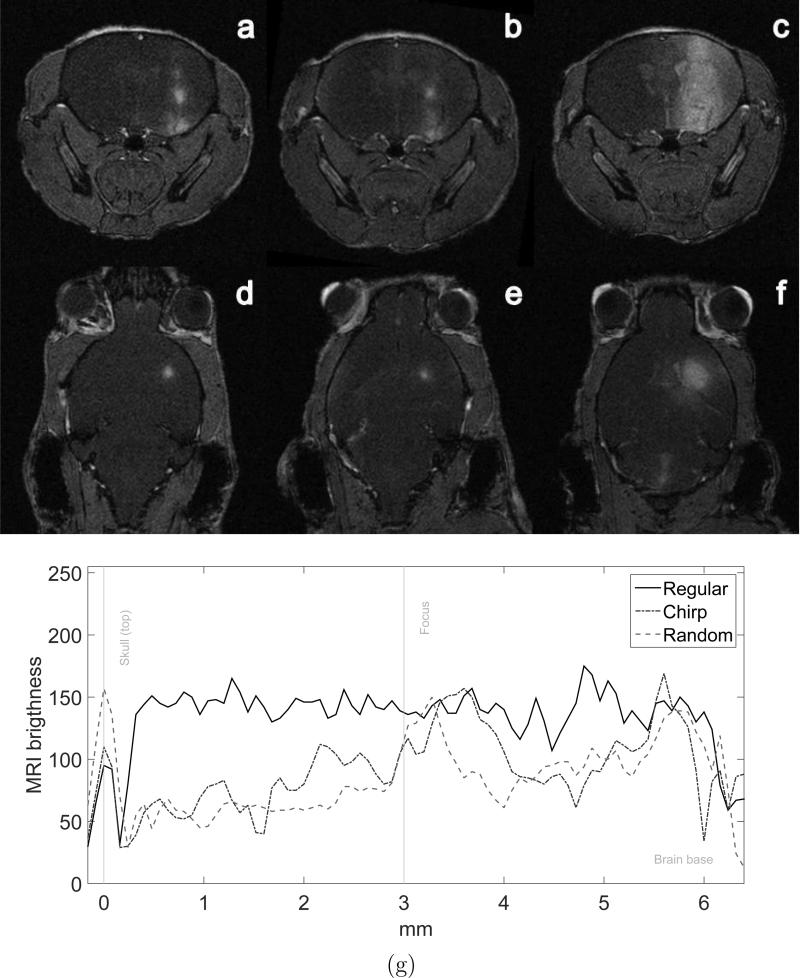
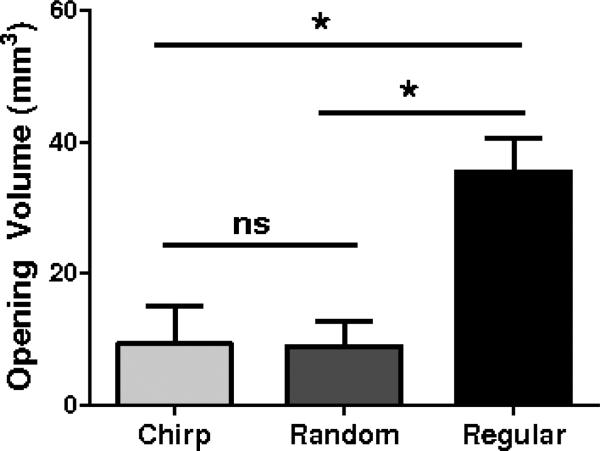
Figure 7a-f shows T1-FLASH weighted MRI images for the three methods. The brighter regions in the brain show the diffusion of the contrast agent into the brain parenchyma. This region of higher contrast indicates where the ultrasound successfully opened the BBB. The chirp method (figures 7a and d) and the random-based method (figures 7b and e) presented smaller openings in comparison to the ones found with the regular sonication method (figure 7c and f). Figure 7g presents the vertical profiles obtained from the coronal MRI images (Figure 7a-c). The first peak is the skull, which was used to align the profiles. The BBB openings observed in the profiles revealed that the ultrasound focus was at 3.60 mm depth in the case of the chirp sonication and at 3.28 mm depth in the random sonication case. Although the coded methods presented more confined BBB opening at the focus compared to the regular sonication, deeper BBB opening regions were observed close to the skull base at 5.60 mm and 5.76 mm for the chirp and random cases, respectively. The distance from the actual foci to the deeper BBB openings were 2 mm and 2.48 mm for the chirp and random cases, respectively. The opening volumes found for the three groups are presented in figure 8. The mean opening volumes evaluated from the MRI were 9.38 ± 5.71 mm3, 8.91 ± 3.91 mm3 and 35.47 ± 5.10 mm3 for chirp, random and regular sonication, respectively. The regular sonication method presented larger openings. The coded excitation methods did not present significant differences between each other for the opening volumes.
Figure 7.
BBB opening evaluation. (a)(b)(c) Coronal and (d)(e)(f) transverse T1-FLASH weighted MRI images showing the BBB opening with the use of gadolinium contrast agent for chirp, random and regular sonication methods, respectively and (g) vertical profile extracted from the coronal MRI images (a)(b)(c).
Figure 8.
Opening volume quantification for the chirp, random and regular sonication methods. No statistically significant differences (ns) was found between the chirp and random groups. Significant differences (*) were found between the regular and chirp groups and regular and random groups.
No brain damage was detected after performing whole brain histological examination for the animals sonicated with the chirp coded ultrasonic excitation. Four out of five animals from the random-based group presented dark neurons as minor tissue deformation at sonicated sites. Three out of five animals from the regular group died after the second day during the MRI acquisition. The other two mice presented similar minor damage to that found in the random-based animal group.
4. Discussion
Experimental studies have shown a decrease in the microbubble resonance frequency with acoustic pressure (Doinikov et al.; 2009). In this study, a compensation of the pressure amplitude was applied to maintain the acoustic pressure constant for the chirp and random methods. The compensation accounted for the transducer frequency response and attenuation losses through the skull. The frequency spectrum for the PCD chirp shows a linear slope on the f(t) frequency and its harmonics over time. For the PSRF method, the PCD shows bubble activity in bandwidths of 1.5-1.9 MHz and the harmonic bandwidths. The regular sonication shows peaks of activity at the main frequency of 1.5 MHz and its harmonics. These characteristics of the chirp and PSRF methods may allow for the development of bubbles with multiple sizes to improve the efficacy of the sonication. The high cavitation level observed in the regular sonication can be explained due to the use of microbubbles with average size of 1.4 μm, which have a resonance frequency of 1.5 MHz.
The coded excitation methods were continuously driven to facilitate the standing wave formation caused by multiple scattering of the wave inside the brain. The coded methods were capable of avoiding the standing wave formation as predicted by the simulations. However, the coded excitation methods were not capable of avoiding BBB openings close to the skull base, which were observed in all methods. The standing wave peaks were expected to have distances between 0.4 mm and 0.5 mm that correspond to half wavelengths of the frequency bandwidth limits 1.9 MHz and 1.5 MHz, respectively (assuming c = 1540 m/s). Multiple scattering of the waves inside the skull may have caused aberration of the focus. The lower cavitation levels detected for the coded excitation methods indicate lower microbubble activity, which was confirmed with the more confined openings detected by the MRI images. These results corroborate with other studies that have demonstrated the cavitation reduction using random methods (Chapelon et al.; 1996; Furuhata and Saito; 2013). Hence, the coded methods were capable of enhancing targeting for BBB opening.
The replenishment of the microbubbles allowed by the pulsed excitation used in the regular sonication generated larger openings. The larger openings for this group can also be explained by the narrower distribution of the microbubble size, which in this case caused the single frequency to engage a larger number of microbubbles at their corresponding resonance frequencies.
The variation of the BBB opening volume indicates possible differences arising from non-uniform tissue properties and animal dependency. These physiological discrepancies can attribute to the variation of microbubble replenishment through circulation and the probability of interaction of the bubbles with the BBB.
The coded ultrasonic methods were proven capable of improving the targeting capabilities in BBB opening. However, application of the in range equation through the skull varied among animals affecting thus the focus positioning procedure which led to, albeit small, differences between the actual and the expected focus position, 0.60 mm and 0.28 mm for chirp and random, respectively. Using a larger bandwidth was found to achieve better focusing and reduce standing wave formation for the coded methods. It is important to note that the choice of frequency bandwidth needs to take into account the frequency response of the transducer, the skull attenuation and the microbubble optimum frequency range. The higher focusing capability found here improves the targeting precision of the method for specific regions of the brain to be treated with drugs and other pharmacological substances. The coded methods can be easily implemented in different setups. The use of these methods together with large phased arrays may improve the focusing and reduce SW formation. Therefore, other techniques could also benefit by this coded excitation method, e.g., sonothrombolysis for reduction of hemorrhage. The higher targeting performance is an important advantage especially for HIFU which uses higher pressure levels and needs to be very precise to ablate the prescribed region and avoid damage to the healthy tissue.
The microbubble size restricts the frequency bandwidth that can be used in the coded methods. Therefore, further studies are necessary to explore different microbubble size distributions and shell properties (Wu et al.; 2015) and their corresponding effective resonance frequencies. The microbubble response could also be taken into account for determining the calibration factor K(f(t)). Incorporating this aspect would increase the efficacy of the method by improving the use of all available bubble sizes.
5. Conclusion
In summary, evidence on the associated improvements in targeting through the skull using coded ultrasonic excitation based on chirp and random modulations were quantified in vivo. We assessed customized ultrasound transmit sequences in which frequencies were linearly or randomly swept. These sequences were shown to be capable of inducing a more confined BBB opening volume. This methodology could prove equally beneficial in other transcranial therapeutic ultrasound applications to improve targeting and prevent collateral damage. Furthermore, these methods provide the possibility of exploring the effects of multi-frequency excitation as a tool to expand our understanding of the mechanisms involved in transcranial therapeutic ultrasound and its effects on the brain tissue.
Acknowledgments
This work was supported in part by NIH (R01EB009041 and R01AG038961) and FAPESP (2011/10809-6 and 2013/08116-8). We thank Hong Chen, Ph.D. and Tenysson W. Lemos, Ph.D. for their important input and technical support.
References
- Alexandrov AV. Ultrasound Enhancement of Fibrinolysis. Stroke. 2009;40(3):107–110. doi: 10.1161/STROKEAHA.108.530931. [DOI] [PubMed] [Google Scholar]
- Alonso A, Reinz E, Leuchs B, Kleinschmidt J, Fatar M, Geers B, Lentacker I, Hennerici MG, de Smedt SC, Meairs S. Focal Delivery of AAV2/1-transgenes Into the Rat Brain by Localized Ultrasound-induced BBB Opening. Molecular Ther. Nucleic Acids. 2013;2 doi: 10.1038/mtna.2012.64. [DOI] [PMC free article] [PubMed] [Google Scholar]
- Baseri B, Choi JJ, Deffieux T, Samiotaki G, Tung Y-S, Olumolade O, Small SA, Morrison B, Konofagou EE. Activation of signaling pathways following localized delivery of systemically administered neurotrophic factors across the blood-brain barrier using focused ultrasound and microbubbles. Physics Med. Biol. 2012;57(7):N65–N81. doi: 10.1088/0031-9155/57/7/N65. [DOI] [PMC free article] [PubMed] [Google Scholar]
- Burgess A, Ayala-Grosso CA, Ganguly M, Jordao JF, Aubert I, Hynynen K. Targeted Delivery of Neural Stem Cells to the Brain Using MRI-Guided Focused Ultrasound to Disrupt the Blood-Brain Barrier. PLOS One. 2011;6(11) doi: 10.1371/journal.pone.0027877. [DOI] [PMC free article] [PubMed] [Google Scholar]
- Chang JW, Min B-K, Kim B-S, Chang WS, Lee Y-H. Neurophysiologic correlates of sonication treatment in patients with essential tremor. Ultrasound Med. Biol. 2015;41(1):124–131. doi: 10.1016/j.ultrasmedbio.2014.08.008. [DOI] [PubMed] [Google Scholar]
- Chapelon J, Dupenloup F, Cohen H, Lenz P. Reduction of cavitation using pseudorandom signals. IEEE Trans. Ultrason. Ferroelectr. Freq. Control. 1996;43(4):623–625. [Google Scholar]
- Choi JJ, Pernot M, Small SA, Konofagou EE. Noninvasive, transcranial and localized opening of the blood-brain barrier using focused ultrasound in mice. Ultrasound Med. Biol. 2007;33(1):95–104. doi: 10.1016/j.ultrasmedbio.2006.07.018. [DOI] [PubMed] [Google Scholar]
- Choi J, Selert K, Vlachos F, Wong A, Konofagou EE. Noninvasive and localized neuronal delivery using short ultrasonic pulses and microbubbles. Proc. Nat. Acad. Sc. USA. 2011;108(40):16539–16544. doi: 10.1073/pnas.1105116108. [DOI] [PMC free article] [PubMed] [Google Scholar]
- Cobbold RSC. Foundations of biomedical ultrasound. Oxford University Press on Demand; 2007. [Google Scholar]
- Coluccia D, Fandino J, Schwyzer L, OGorman R, Remonda L, Anon J, Martin E, Werner B. First noninvasive thermal ablation of a brain tumor with mr-guided focused ultrasound. J Therapeutic Ultrasound. 2014;2(17):1–7. doi: 10.1186/2050-5736-2-17. [DOI] [PMC free article] [PubMed] [Google Scholar]
- Daffertshofer M, Gass A, Ringleb P, Sitzer M, Sliwka U, Els T, Sedlaczek O, Koroshetz WJ, Hennerici MG. Transcranial low-frequency ultrasound-mediated thrombolysis in brain ischemia - Increased risk of hemorrhage with combined ultrasound and tissue plasminogen activator - Results of a phase II clinical trial. Stroke. 2005;36(7):1441–1446. doi: 10.1161/01.STR.0000170707.86793.1a. [DOI] [PubMed] [Google Scholar]
- Deffeux T, Konofagou EE. Numerical Study of a Simple Transcranial Focused Ultrasound System Applied to Blood-Brain Barrier Opening. IEEE Trans. Ultrason. Ferroelectr. Freq. Control. 2010;57(12):2637–2653. doi: 10.1109/TUFFC.2010.1738. [DOI] [PMC free article] [PubMed] [Google Scholar]
- Deffeux T, Younan Y, Wattiez N, Tanter M, Pouget P, Aubry J-F. Low-Intensity Focused Ultrasound Modulates Monkey Visuomotor Behavior. Current Biol. 2013;23(23):2430–2433. doi: 10.1016/j.cub.2013.10.029. [DOI] [PubMed] [Google Scholar]
- Doinikov AA, Haac JF, Dayton PA. Resonance frequencies of lipid-shelled microbubbles in the regime of nonlinear oscillations. Ultrasonics. 2009;49(2):263–268. doi: 10.1016/j.ultras.2008.09.006. [DOI] [PMC free article] [PubMed] [Google Scholar]
- Elias W, Huss D, Voss T, Loomba J, Khaled M, Zadicario E, Frysinger R, Sperling S, Wylie S, Monteith S, Druzgal J, Shah B, Harrison M, M W. A pilot study of focused ultrasound thalamotomy for essential tremor. N Engl J Med. 2013;369(7):640–648. doi: 10.1056/NEJMoa1300962. [DOI] [PubMed] [Google Scholar]
- Furuhata H, Saito O. Comparative study of standing wave reduction methods using random modulation for transcranial ultrasonication. Ultrasound Med. Biol. 2013;39(8):1440–1450. doi: 10.1016/j.ultrasmedbio.2012.11.011. [DOI] [PubMed] [Google Scholar]
- Hynynen K, Jolesz FA. Demonstration of potential noninvasive ultrasound brain therapy through an intact skull. Ultrasound Med. Biol. 1998;24(2):275–283. doi: 10.1016/s0301-5629(97)00269-x. [DOI] [PubMed] [Google Scholar]
- Hynynen K, McDannold N, Clement G, Jolesz FA, Zadicario E, Killiany R, Moore T, Rosen D. Pre-clinical testing of a phased array ultrasound system for mri-guided noninvasive surgery of the brain: A primate study. European J. Radiology. 2006;59(2):149–156. doi: 10.1016/j.ejrad.2006.04.007. [DOI] [PubMed] [Google Scholar]
- Hynynen K, McDannold N, Vykhodtseva N, Jolesz FA. Noninvasive MR imaging-guided focal opening of the blood-brain barrier in rabbits. Radiology. 2001;220(3):640–646. doi: 10.1148/radiol.2202001804. [DOI] [PubMed] [Google Scholar]
- Kamimura HAS, Pavan TZ, Carneiro AAO, Pinto PTC, Neto OMP. 2013 IEEE Int Ultrasonics Symp. IEEE; 2013. Nonlinear mixing of two ultrasonic beams for transcranial sonothrombolysis; pp. 2103–2105. [Google Scholar]
- King RL, Brown JR, Newsome WT, Pauly KB. Effective parameters for ultrasound-induced in vivo neurostimulation. Ultrasound Med. Biol. 2013;39(2):312–331. doi: 10.1016/j.ultrasmedbio.2012.09.009. [DOI] [PubMed] [Google Scholar]
- Kinoshita M, McDannold N, Jolesz FA, Hynynen K. Noninvasive localized delivery of Herceptin to the mouse brain by MRI-guided focused ultrasound-induced blood-brain barrier disruption. Proc. Natl Acad. Sci. USA. 2006;103(31):11719–11723. doi: 10.1073/pnas.0604318103. [DOI] [PMC free article] [PubMed] [Google Scholar]
- Marquet F, Boch A-L, Pernot M, Montaldo G, Seilhean D, Fink M, Tanter M, Aubry J-F. Non-invasive ultrasonic surgery of the brain in non-human primates. J. Acoust. Soc. Am. 2013;134(2):1632–1639. doi: 10.1121/1.4812888. [DOI] [PubMed] [Google Scholar]
- Martin E, Jeanmonod D, Morel A, Zadicario E, Werner B. High-intensity focused ultrasound for noninvasive functional neurosurgery. Annals Neurol. 2009;66(6):858–861. doi: 10.1002/ana.21801. [DOI] [PubMed] [Google Scholar]
- Mast TD. Empirical relationships between acoustic parameters in human soft tissues. Acoustics Res. Lett. 2000;1(2):37–42. [Google Scholar]
- Meairs S, Alonso A, Hennerici MG. Progress in Sonothrombolysis for the Treatment of Stroke. Stroke. 2012;43(6):1706–1710. doi: 10.1161/STROKEAHA.111.636332. [DOI] [PubMed] [Google Scholar]
- Mitri FG, Greenleaf JF, Fatemi M. Chirp imaging vibro-acoustography for removing the ultrasound standing wave artifact. IEEE Trans. Med. Imaging. 2005;24(10):1249–1255. doi: 10.1109/TMI.2005.854518. [DOI] [PubMed] [Google Scholar]
- Molina CA, Barreto AD, Tsivgoulis G, Sierzenski P, Malkoff MD, Rubiera M, Gonzales N, Mikulik R, Pate G, Ostrem J, Singleton W, Manvelian G, Unger EC, Grotta JC, Schellinger PD, Alexandrov AV. Transcranial Ultrasound in Clinical Sonothrombolysis (TUCSON) Trial. Annals Neurol. 2009;66(1):28–38. doi: 10.1002/ana.21723. [DOI] [PubMed] [Google Scholar]
- O'Donnell M. Coded excitation system for improving the penetration of real-time phased-array imaging systems. IEEE Trans. Ultrason. Ferroelectr. Freq. Control. 1992;39(3):341–351. doi: 10.1109/58.143168. [DOI] [PubMed] [Google Scholar]
- O'Reilly M, Waspe A, Ganguly M, Hynynen K. Focused-ultrasound disruption of the blood-brain barrier using closely-timed short pulses: Influence of sonication parameters and injection rate. Ultrasound Med. Biol. 2011;37(4):587–594. doi: 10.1016/j.ultrasmedbio.2011.01.008. [DOI] [PMC free article] [PubMed] [Google Scholar]
- Pajek D, Hynynen K. The application of sparse arrays in high frequency transcranial focused ultrasound therapy: A simulation study. Medical Physics. 2013;40(12) doi: 10.1118/1.4829510. [DOI] [PMC free article] [PubMed] [Google Scholar]
- Pedersen HP, Misaridis TX, Jensen JA. Clinical evaluation of chirp-coded excitation in medical ultrasound. Ultrasound Med. Biol. 2003;29(6):895–905. doi: 10.1016/s0301-5629(02)00784-6. [DOI] [PubMed] [Google Scholar]
- Raymond SB, Treat LH, Dewey JD, McDannold NJ, Hynynen K, Bacskai BJ. Ultrasound Enhanced Delivery of Molecular Imaging and Therapeutic Agents in Alzheimer's Disease Mouse Models. PLOS One. 2008;3(5) doi: 10.1371/journal.pone.0002175. [DOI] [PMC free article] [PubMed] [Google Scholar]
- Samiotaki G, Vlachos F, Tung Y-S, Konofagou EE. A quantitative pressure and microbubble-size dependence study of focused ultrasound-induced blood-brain barrier opening reversibility in vivo using MRI. Magnetic Resonance in Medicine. 2012;67(3):769–777. doi: 10.1002/mrm.23063. [DOI] [PMC free article] [PubMed] [Google Scholar]
- Schneider U, Pedroni E, Lomax A. The calibration of CT Hounsfield units for radiotherapy treatment planning. Phys. Med. Biol. 1996;41(1):111–124. doi: 10.1088/0031-9155/41/1/009. [DOI] [PubMed] [Google Scholar]
- Tang SC, Clement GT. Standing-Wave Suppression for Transcranial Ultrasound by Random Modulation. IEEE Trans. Biomed. Eng. 2010;57(1):203–205. doi: 10.1109/TBME.2009.2028653. [DOI] [PMC free article] [PubMed] [Google Scholar]
- Treeby BE, Jaros J, Rendell AP, Cox BT. Modeling nonlinear ultrasound propagation in heterogeneous media with power law absorption using a k-space pseudospectral method. J. Acoust. Soc. Am. 2012;131(6):4324–4336. doi: 10.1121/1.4712021. [DOI] [PubMed] [Google Scholar]
- Tsivgoulis G, Eggers J, Ribo M, Perren F, Saqqur M, Rubiera M, Sergentanis TN, Vadikolias K, Larrue V, Molina CA. Safety and efficacy of ultrasound-enhanced thrombolysis a comprehensive review and meta-analysis of randomized and nonrandomized studies. Stroke. 2010;41(2):280–287. doi: 10.1161/STROKEAHA.109.563304. [DOI] [PubMed] [Google Scholar]
- Tyler WJ, Tufail Y, Finsterwald M, Tauchmann ML, Olson EJ, Majestic C. Remote excitation of neuronal circuits using low-intensity, low-frequency ultrasound. PLOS One. 2008;3(10):e3511. doi: 10.1371/journal.pone.0003511. [DOI] [PMC free article] [PubMed] [Google Scholar]
- Wang S, Olumolade OO, Sun T, Samiotaki G, Konofagou EE. Noninvasive, neuron-specific gene therapy can be facilitated by focused ultrasound and recombinant adeno-associated virus. Gene Therapy. 2015;22(1):104–110. doi: 10.1038/gt.2014.91. [DOI] [PMC free article] [PubMed] [Google Scholar]
- Wu S-Y, Chen C, Tung Y, Olumolade O, Konofagou E. Effects of the microbubble shell physicochemical properties on ultrasound-mediated drug delivery to the brain. J. Controlled Release. 2015;212:30–40. doi: 10.1016/j.jconrel.2015.06.007. [DOI] [PMC free article] [PubMed] [Google Scholar]
- Wu S-Y, Tung Y-S, Marquet F, Downs ME, Sanchez CS, Chen CC, Ferrera V, Konofagou EE. Transcranial Cavitation Detection in Primates During Blood-Brain Barrier Opening: A Performance Assessment Study. IEEE Trans. Ultrason. Ferroelectr. Freq. Control. 2014;61(6):966–978. doi: 10.1109/TUFFC.2014.2992. [DOI] [PMC free article] [PubMed] [Google Scholar]


