

Abstract
When murine leukemia L1210 cells are exposed to certain porphyrins, in the presence of light, a rapid loss of cell viability occurs. We have examined structure-activity relationships, using a series of porphyrins, and have studied early effects of these agents, to elucidate their mode of action. In the system employed here, only water-soluble porphyrins were cytotoxic. The first step in cytotoxicity involved binding of porphyrin to the cell surface. Porphyrins unable to bind were inactive. An important determinant of drug binding was the partition coefficient of a porphyrin between octanol and water. In the presence of light, presumably via a singlet oxygen intermediate, a variety of effects on the cell surface and cell membrane were then produced. These included inhibition of nucleoside and amino acid transport, perturbation of permeability barriers to actinomycin D uptake, enhanced binding of the fluorescent probe 8-anilino-1-naphthalenesulfonate, inhibition of activity of 5′-nucleotidase, an ectoenzyme, and altered cell-surface properties, measured with a two-phase aqueous polymer system. In the L1210 cell line, the most potent compound tested was deuteroporphyrin IX which produced the effects mentioned above at a 5 × 10⁻⁶ level; this drug level also prevented subsequent cell division. A tenfold higher drug level caused inhibition of intracellular nucleoside kinase activity, along with inhibition of sugar transport and of the fluorogenic interaction between 8-anilino-1-naphthalenesulfonic acid and cell companents. We conclude that the initial site of photoactivated porphyrin toxicity is at or near the cell surface.
Although the cytotoxic effects of photoactivated dyes have been known for many years, the system has been studied in detail only recently (Spikes, 1975). Treatment of experimental animal tumors with hematoporphyrin, followed by exposure to light, produced a large number of long-term cures (Dougherty et al., 1975). Cytotoxic effects of photoactivated hematoporphyrin were also detected in vitro (Dougherty et al., 1976). A singlet oxygen intermediate has been implicated as the proximate cytotoxic agent (Weishaupt et al., 1976).
In this study, we examined the properties of a series of porphyrins and their effects on the murine leukemia L1210 cell, to determine structure–activity relationships. Using the most potent agent, deuteroporpbyrin IX, we measured the effects of photoactivation on cell viability and on other biological processes including transport of nucleosides, sugars, and a nonmetabolized amino acid, cell permeability barriers, uptake of a fluorogenic membrane probe, and behavior of cells in a two-phase polymer system. We identified three determinants of porphyrin toxicity: quantum yield of singlet oxygen, water solubility, and the octanol–water partition coefficient. Significant effects of photoactivated porphyrins on cell-surface phenomena were found at drug levels which markedly reduced cell viability, but which did not affect the action of intracellular nucleoside kinases, nor of incorporation of precursors into nucleic acid.
Rationale
The study of the mode of action of a cytotoxic agent involves the identification of early sites of drug action. Exposure of a cell line to a growth-inhibitory compound will eventually result in cessation of synthesis of nucleic acid and protein, resulting in marked alterations in all biophysical and biochemical parameters. Furthermore, procedures comrnonly employed in characterization of drug action can provide ambiguous data, e.g., an agent which inhibits transport of nucleosides will therefore inhibit incorporation of exogenous labeled nucleoside into nucleic acid, but the proximqte effect is on a transport process. Procedures for evaluating drug-induced damage on cell-surface phenomena are still undergoing development. Using appropriate conditions wherein incorporation of label into cellular macromolecules is minimized, we can measure the rate of inward transport of sugar, amino acid, and nucleoside molecules. Perturbations in membrane barriers to uptake of normally excluded materials can also be determined. The measurement of partitioning behavior in two-phase aqueous polymer systems and the fluorogenic interaction between the cell surface and certain dyes provide other indices of cell surface perturbations.
We have recently investigated several agents including Fungizone (Kessel, 1976), S-(trityl)-L-cysteine (Kessel et al., 1976), and Acronycine (Kessel, 1977), whose cytotoxic effects on mammalian cells were not hitherto understood. In each case, we found evidence for drug-induced alterations in one or more of the cell-surface properties described above. The present study represents an extension of previous observations; characterization of cell-surface alterations provides an understanding of the mode of action of the photoactivated porphyrins.
Materials and Methods
Chemicals
Hematoporphyrin (NSC 59265)1 and several analogues were provided by the Division of Cancer Treatment, National Cancer Institute. The structures are described in Table I. A purification procedure involving treatment with a sulfuric–acetic acid mixture has been described (Weishaupt et al., 1976); this did not alter activity of any compound provided. Treatment of hematoporphyrin (NSC 59265) with 0.1 N NaOH for 45 min, followed by neutralization (Dougherty et al., 1975), did result in an approximate twofold increase in activity of this compound in all systems tested here. This procedure will degrade porphyrin polymers and may have other effects. We did not find any other compound studied here to be significantly activated by the NaOH treatment. Solutions of porphyrins were prepared in N,N′-dimethylformamide (DMF),2 unless otherwise specified, and were stored in the dark at −20 °C.
TABLE I.
Structures of Compounds Tested.a
| NSC identification no. | R1 | R2 | R3 | R4 | R5 | R6 | R7 | R8 |
|---|---|---|---|---|---|---|---|---|
| 20097 | CH3 | C(=O)CH3 | CH3 | C(=O)CH3 | CH3 | C2H4COOH | C2H4COOH | CH3 |
| 36001 | CH3 | RCOOHb | CH3 | RCOOHb | CH3 | C2H4COOH | C2H4COOH | CH3 |
| 121180 | CH3 | R′NH2c | CH3 | R′NH2c | CH3 | R″NH2d | R″NH2d | CH3 |
| 177389 | CH=CH2 | CH3 | CH=CH2 | CH3 | CH3 | C2H4COOH | C2H4COOH | CH3 |
| 2632 | CH3 | CH=CH2 | CH3 | CH=CH2 | CH3 | C2H4COOH | C2H4COOH | CH3 |
| 59265 | CHOHCH3 | CH3 | CHOHCH3 | CH3 | CH3 | C2H4COOH | C2H4COOH | CH3 |
| 407317 | CH3 | C2H5 | CH3 | C2H5 | CH3 | COOH | C2H4COOH | CH3 |
| 19663 | CH3 | H | CH3 | H | CH3 | C2H4COOH | C2H4COOH | CH3 |
| 19665 | CH3 | C2H5 | CH3 | C2H5 | CH3 | C2H4COOH | C2H4COOH | CH3 |
| 407318 | CH3 | C2H5 | CH3 | C2H5 | CH3 | H | C2H4COOH | CH3 |
R1–8 refer to substituents on the porphyrin ring system.
R = cyclopropane.
R′ = NHCH2CH2−.
R″ = CH2CH2CONHCH2CH2−.
The Mg salt of Ans was obtained from the Pierce Chemical Co., Rockford, Ill., and was converted to the Na salt by ion exchange.
PEG was purchased from Union Carbide, New York, N.Y., Dextran T 500 from Pharmacia, Piscataway, N.J., growth media from Grand Island Biological Co., Grand Island, N.Y., and 2-octanol from Fisher Scientific Co.
Tritium-labeled actinomycin D was provided by the Monsanto Chemical Co., St. Louis, Mo. Other radioactive materials were purchased from New England Nuclear Corp., Boston, Mass. These included: thymidine, AMP, uridine, cycloleucine, L-leucine, 2-deoxy-D-glucose, and D-ribose labeled with 14C; and concanavalin A and L-fucose, labeled with tritium. All were diluted with carrier to obtain 3–5 mM stock solutions containing approximately 5000 counts min−1 μL−1, measured by liquid scintillation counting.
Cells and Incubation Procedures
L1210 murine leukemia cells, obtained from the Arthur D. Little Corp., Cambridge, Mass., were maintained in culture using MEM supplemented with 10% fetal calf serum and gentamycin. Cells were obtained during exponential growth and then suspended in PBS or in fresh growth medium with Hepes (pH 7.4) replacing NaHCO3 to permit brief incubations at high cell densities without affecting pH. Suspensions of 5 × 10⁶ cells/mL were treated with 0.1–300-μg levels of porphyrins at 0 °C or at 37 °C (3 μL of DMF/mL of cell suspension). This was usually done in the presence of light (50 ft-candles, warm white + yellow fluorescent) for 10 min. In other experiments, cells were incubated together with porphyrins in the dark and then washed and suspended in fresh medium and exposed to light. Controls were carried out in the absence of porphyrin, or wholly in the absence of light. To minimize interactions between photoactivated porphyrins and other substrates, cells were always suspended in fresh medium before further procedures were carried out.
Viability Studies
A full-grown culture of L1210 cells (8 × 10⁵ cells/mL) was diluted tenfold with fresh medium, and 10-mL aliquots were treated with 10 μL of a DMF solution of porphyrin. To controls, DMF alone was added. After exposure to light for 10 min, as described above, the cells were collected by centrifugation and suspended in fresh medium, and the cell density (cells/mL) was determined with a ZF Model Coulter counter. After 24 and 48 h incubations (dark) at 37 °C, the cell density was determined again. Cells were periodically examined under phase-contrast microscopy.
Transport and Incorporation Studies
Accumulation of porphyrin was measured after 10-min incubations at 0 °C or at 37 °C, in Hepes-buffered growth medium or PBS containing 10 μg/mL levels of porphyrin. Each tube contained 6–7 million cells in 1 mL of medium. The cells were collected by centrifugation and a sample of the medium was retained. The cell pellet was washed once with 0.9% NaCl and suspended in 300 μL of DMF to extract the porphyrin. A 200-μL portion of the extract was mixed with 200 μL of water and 500 μL of 1 M HCl and the optical density measured at 550 nm. Under these conditions, all porphyrins tested here had an absorbance maximum at this wavelength. A 200-μL portion of the incubation medium was then mixed with 300 μL of DMF + 500 μL of 1 M HCl for measurement of optical density. Standards were prepared by mixing known levels of porphyrins with water, DMF, and HCl in the proportions shown above. The porphyrin concentration in medium and in cell pellets was then calculated.
Accumulation of radioactive nucleoside (uridine, thymidine) was measured at 10 °C, a temperature which minimized subsequent incorporation of label into nucleic acid without affecting nucleoside transport (Scholtissek, 1967). One-milliliter portions of cell suspensions (in Hepes-buffered growth medium) were incubated with porphyrin ± light, as described above and then resuspended in fresh medium at 10 °C containing 20 μM labeled nucleoside (in the dark). After 10 min, the cells were collected and washed with 0.9% NaCl containing 1 mM persantin (Kessel and Dodd, 1972) to minimize loss of nucleoside, and intracellular radioactivity was measured by liquid scintillation counting. Uptake of nonmetabolized (or poorly metabolized) substrates was carried out as described above, but at 37 °C. These substrates included cycloleucine (Kessel and Hall, 1967), 2-deoxy-D-glucose, D-ribose, and L-fucose.
Incorporation of substrates into macromolecules was measured at 37 °C. Drug-treated cells were incubated (dark) for 10 min with 20 μM levels of radioactive leucine, thymidine, or uridine; radioactivity precipitated by 0.3 M HClO4 was measured by liquid scintillation counting.
Accumulation of actinomycin D was measured as described before (Kessel et al., 1976). After treatment of L1210 cells with porphyrin + light, cells were incubated for 5 min at 37 °C (dark) in medium containing 2 μg/mL of actinomycin D (3H-labeled). In similar experiments, binding of Con A was measured: cells were suspended in PBS containing 2.5 μg/mL of [3H]Con A (Köteles et al., 1976) for 5 min at 0 °C. The cells were then washed with cold 0.9% NaCl and the amount of bound radioactivity was measured by liquid scintillation counting.
Studies with Ans
Porphyrin-treated cells (7 × 10⁶) were suspended for 90 min at 10 °C in 3 mL of PBS containing 10 μM Ans. The suspension was then transferred to a quartz cuvette for determination of fluorescence (excitation 375 nm, emission 480 nm). This provides a measure of the fluorescence (f) of bound Ans. To measure total bound Ans (b), replicate cell suspensions were prepared, and the cells were collected by centrifugation and suspended in 0.1 mL of Triton X-100 and mixed with 2.5 mL of 1-propanol. Fluorescence was then measured as described above. The fluorescence yield, defined here as 100(f/b), is a measure of the extent of interaction between bound Ans and fluorogenic sites (Stryer, 1968).
Partitioning Behavior of Cells
After treatment of cells with porphyrin as described above, pellets containing 106 cells were suspended in 50 μL of 0.9% NaCl and then added to a 10-g mixture at 0 °C containing 5.0% (w/v) Dextran T 500 and 3.1% (w/v) PEG made up in 75 mM NaCl + 60 mM NaH2PO4 (pH 7.0). In other experiments, we used a NaCl-rich system (140 mM NaCl + 10 mM NaH2PO4, pH 7.0), or a partitioning system based on Na2SO4 (60 mM Na2SO4 + 60 mM NaH2PO4, pH 7.0). All of these systems formed two phases at 0 °C. After gentle mixing of the phases + cell suspension, a 1-mL portion was removed and the cell concentration measured with a Coulter Electronic Particle Counter, after appropriate dilution. The phases were then permitted to separate (20 min, 0 °C), an aliquot of the upper phase was removed, and the cell concentration was measured. The partition coefficient is defined here as the number of cells present in the top phase expressed as % total number of cells (Walter, 1975).
Measurement of Nucleoside Kinases
Pellets of 6 × 10⁶ cells were suspended in 200 μL of 50 mM Hepes buffer (pH 7.2) containing 1 mM mercaptoethanol, and disrupted by three freeze-thaw cycles. Particulate material was removed by centrifugation and a 10-μL portion of the supernatant fluid was diluted to 50 μL so as to contain 6 mM ATP, 5 mM MgCl2, 50 mM Hepes (pH 7.2), 1 mM mercaptoethanol, and 0.1 mM radioactive nucleoside. After a 20-min incubation at 37 °C, we measured nucleotide formation as represented by radioactivity absorbed by a disc of DEAE-impregnated paper and not removed by washing (Kessel et al., 1971).
Measurement of 5′-Nucleotidase
This enzyme was measured by incubation of 107 cells in PBS containing 1 mM [14C]adenosine 5′-monophosphate (0.025 μCi) and 1 mM nonradioactive adenosine in a total volume of 1 mL. After incubation at 37 °C for 30 min, the cells were removed by centrifugation, and the supernatant fluid was washed through 0.5 × 1 cm columns of Dowex- 1–glycine, using 5 mL of 0.1 M glycine buffer (pH 8.5) (Glastris and Pfeiffer, 1974). A 1-mL portion of the eluate was then used for determination of [14C]adenosine released by the action of 5′-nucleotidase.
Properties of Porphyrins
Solubility of porphyrins was measured by mixing 10 mg/mL stock solutions of these compounds in DMF with water to achieve a 1:100 dilution. The resulting mixture was clarified by centrifugation to remove undissolved material. A 400-μL portion of the supernatant fluid was mixed with 10 μL of 1 M HCl and the optical density of 550 nm was measured. The extinction coefficient of individual porphyrins was measured by preparing solutions in DMF which were then diluted with ⅕ volume of 1 M HCl.
Yields of singlet oxygen from different porphyrin solutions were measured as described by Dougherty et al. (1976). A solution of 1,3-diphenylisobenzofuran (4 mg/2 mL of ethanol) was mixed with 20 μL of 10 mg/mL of porphyrin (in DMF). The resulting mixture was illuminated as were cell suspensions (as described above). At 5-min intervals, 20-μL portions of the mixture were removed and diluted with 3 mL of ethanol and absorbance at 400 nm was measured. The relative rate of decrease of optical density provides a measure of the rate of production of singlet oxygen.
The partition of porphyrins between octanol and water was measured by equilibrating equal parts of PBS and 2-octanol at 22 °C. From each phase, 400 μL was taken and mixed with 2 μL of a 20 mg/mL solution of porphyrin in DMF. The system was thoroughly mixed, the phases were separated by centrifugation, and any insoluble material at the interface was removed. From each phase, 200 μL was removed and mixed with 25 μL of 1 M HCl + 200 μL of acetone. Optical density was measured at 550 nm and the partition ratio (octanol–water) calculated.
Results
Compounds Tested
Structures of water-soluble agents examined in this study are shown in Table I. Methyl and ethyl esters of certain of these derivatives were initially evaluated, but their low solubility (<1 μg/mL) proved to be a limiting factor. All of the compounds shown in Tables I and II were soluble to at least 10 μg/mL.
TABLE II.
Effects of Photoactivated Porphyrins on Transport and Synthesis of Macromolecules of L1210 Cells.
| Porphyrina | Uridineb | Cycloleucinec | RNAd | Proteine | Actinomycin Df |
|---|---|---|---|---|---|
| 20097 | 100 | 96 | 100 | 100 | 100 |
| 36001 | 96 | 92 | 95 | 95 | 100 |
| 121180 | 96 | 100 | 95 | 98 | 100 |
| 177389 | 55 | 60 | 60 | 65 | 175 |
| 2632 | 15 | 22 | 25 | 25 | 290 |
| 59265 | 13 | 15 | 15 | 18 | 305 |
| 407317 | 10 | 12 | 10 | 15 | 340 |
| 19663 | 9 | 10 | 10 | 10 | 395 |
| 19665 | 10 | 10 | 15 | 18 | 350 |
| 407318 | 15 | 20 | 20 | 25 | 290 |
Structures are described in Table I; all compounds were tested at 10 μg/mL; cells were exposed to drug + light for 10 min, washed free from drug, and then tested. All values shown as % of control.
Uridine uptake measured over a 10-min period at 10 °C.
Cycloleucine uptake measured over a 10-min interval at 37 °C.
Incorporation of uridine into RNA measured for 10 min at 37 °C.
Incorporation of leucine into protein measured for 10 min at 37 °C.
Actinomycin D accumulation measured at 37 °C over a 5-min interval.
Uptake and Incorporation
Effects of ten porphyrins on uptake of uridine, actinomycin D, and cycloleucine, and on incorporation of uridine into RNA and leucine into prdtein are shown in Table II. All drugs were tested at a 10 μg/mL level; cells were exposed to light-activated porphyrins for 10 min, then washed, and used for experiments as described above. There was a marked correlation between effects of these agents on uridine uptake vs. RNA synthesis and on cycloleucine uptake vs. protein synthesis. Agents which inhibited transport of cycloleucine and uridine promoted accumulation of actinomycin D. In other studies, we found that uptake of thymidine was inhibited to the same extent as that of uridine. In contrast, accumulation of sugars (L-fucose, 2-deoxy-D-glucose, and D-ribose) was only inhibited by 20% when L1210 cells were treated with 10 μg/mL of porphyrin 19663, a level which inhibited amino acid and nucleoside uptake by 90%.
Data described in Table II were collected in experiments wherein cells were incubated in Hepes-buffered growth medium. When incubations of cells with photoactivated porphyrins were carried out in PBS containing 10% fetal calf serum, the results were not altered, but omission of serum potentiated drug action substantially. Porphyrin levels in PBS of 0.2–0.5 μg/mL were sufficient to cause effects which required 10 μg/mL porphyrin in MEM. These data indicate that an interaction between porphyrins and serum3 markedly decreased the effectiveness (cytotoxic action) of these agents.
Accumulation of Con A
When incubated at 0 °C in medium containing 2.5 μg/mL or 3H-labeled Con A, as described above, L1210 cells accumulated approximately 15% of the total extracellular radioactivity, representing a binding of 75 μg of Con A/g of cells (wet weight). Prior incubation of cells in light with 10 μg/mL levels of compounds listed ill Table I did not alter this result.
Correlation between Inhibition of Nucleoside Transport, 5′-Nucleotidase Kinase Activity, and Viability
When L1210 cells were treated for 10 min with graded levels of deuteroporphyrin IX (NSC 19663) in light, inhibition of uridine transport, of activity of uridine kinase, and a decline in cell viability were all observed, but the kinase was relatively insensitive to drug action. The data show that a 3 μg/mL drug level caused a substantial inhibition of uridine transport and of cell viability, without affecting the activity of uridine kinase (Figure 1). Similar results were obtained when thymidine replaced uridine. We found that the extent of inhibition of 5′-nucleotidase by the drug closely paralleled inhibition of uridine uptake. At a 3 μg/mL level, in light, the activity of this enzyme was inhibited to 40% of control, at 10 μg/mL, to 5% of control. These data indicate loss of viability4 occurred at a level of photoactivated drug which caused an alteration in nucleoside transport and 5′-nucleotidase activity, but did not alter the activity of an intracellular enzyme. A dose-response curve showing effects of photoactivated deuteroporphyrin IX on uptake of actinomycin D is shown in Figure 2. A substantial promotion of actinomycin D uptake was produced at a 3 μg/mL drug level. This same effect was produced by several other porphyrins as shown in Table II.
FIGURE 1.
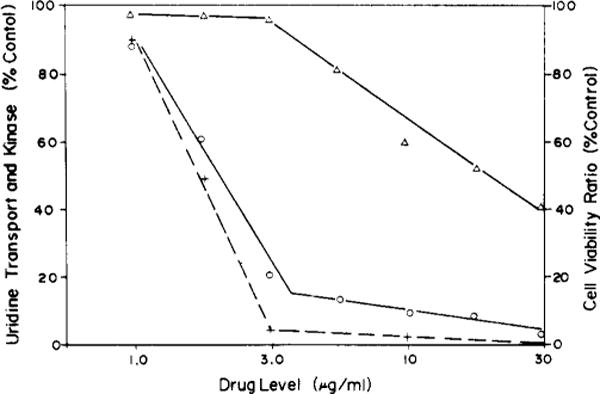
The effect of graded levels of deuteroporphyrin IX (NSC 19663) on uridine kinase (Δ), transport of uridine (○), and on cell viability (+). After exposure of cells to the light-activated drug (0–30 μg/mL), rates of uridine uptake and intracellular level of uridine kinase were measured. Cell viability is calculated as (ratio of cell number after 24 h/initial cell number) and is shown as percent of a control culture with a doubling time of 16 h.
FIGURE 2.
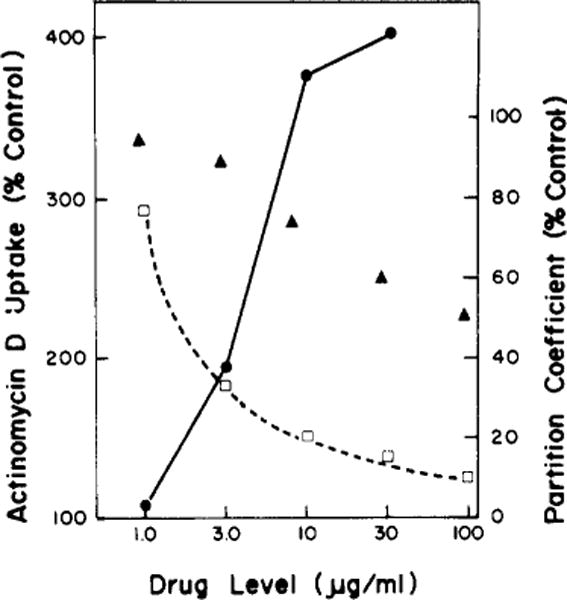
Effect of varying concentrations of photoactivated deuteroporphyrin IX on uptake of actinomycin D (●) and on partition coefficient of L1210 cells (□). The latter was measured in a dextran-PEG system containing 75 mM NaCl and 60 mM NaHPO4 at pH 7.0. Effects of graded levels of the porphyrin on the partition coefficient without exposure to light are also shown (▲). Partition coefficients and actinomycin D accumulation are depicted as a percent of control values (untreated cells).
Effects on Partitioning Behavior of L1210 Cells and Cell-Surface pI
When L1210 cells were partitioned between the two phases of a dextran-PEG system containing 75 mM NaCl + 60 mM Na2HPO4 (pH 7.0), approximately 30% of the cells partitioned into the upper phase. Treatment of cells with 3 μg/mL of photoactivated deuteroporphyrin (NSC 19633) for 10 min resulted in a substantial reduction (to 35% of control) in number of cells which partitioned into the upper phase of the system (Figure 2). In another study, we examined the behavior of control L1210 cells in a dextran-PEG system containing 140 mM NaCl + 10 mM NaH2PO4 (pH 7.0); only 8% of the cells partitioned into the upper phase. We also employed another system containing 60 mM Na2SO4 + 60 mM NaH2PO4. In the latter mixture, all cells from the control culture partition into the upper phase regardless of pH. But with porphyrin-treated cells, the partition ration was reduced to 60%.
When cells were exposed to graded levels of photoactivated deuteroporphyrin IX, the partition coefficient of these cells progressively fell. When the drug exposure was solely in the dark, we also observed a drug-related decrease in partition coefficient of treated cells, but this effect was substantially lower than the dose-related effect produced in the presence of light. These data are shown in Figure 2.
Fluorogenic Interactions with Ans
We examined effects of graded levels of deuteroporphyrin IX (NSC 19663, Table I), the most potent agent identified by criteria shown in Table II, on the fluorogenic interaction between the dye Ans and the L1210 cells. In the presence of light, treatment of cells with a low level of porphyrin caused a marked increase both in the amount of Ans bound and in the fluorescence yield (Figure 3A). The latter is a measure of the fluorogenic interaction between bound Ans and its environment. As the porphyrin level was increased (in light), we observed a corresponding increase in total binding of Ans, but the fluorescent yield was reduced. In the dark, increasing levels of porphyrin caused a slightly reduced total binding of Ans, but markedly reduced the fluorescent yield (Figure 3B). Similar results were obtained with other porphyrins (NSC 59265, 407317, 19665) shown in Table I.
FIGURE 3.
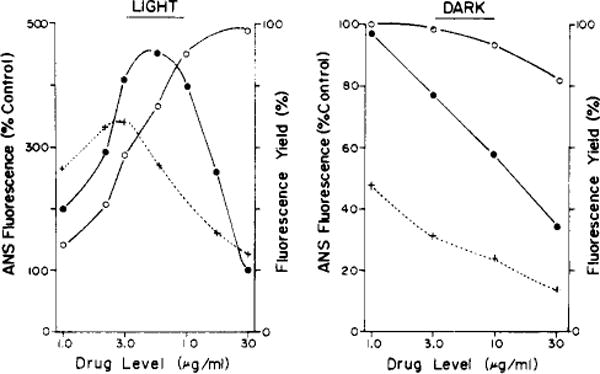
(A, left) The effect of increasing levels of light-activated deuteroporphyrin IX (NSC 19663) on total binding (○) and on the fluorogenic interaction (●) of Ans with L1210 cells. The fluorescence yield (+) represents the ratio of cell fluorescence/total Ans binding. (B, right) Shows the same measurements when cells were exposed to increasing deuteroporphyrin concentrations in the dark.
Properties of Porphyrins
When these water-soluble porphyrins were tested for their capacity to form singlet oxygen (Dougherty et al., 1976) we found no significant differences among the compounds listed in Table I. We also found no correlation between optical density of porphyrin solutions and light-promoted cytotoxicity at the porphyrin concentrations employed in this study. Other determinants of the effectiveness of these agents as inhibitors of transport and other cell-surface phenomena were therefore sought.
One such determinant was the capacity of different porphyrins to bind to L1210 cells. The extent of such binding, at 0 or 37 °C (dark), was correlated with subsequent photoactivated cytotoxicity (Table III).
TABLE III.
Temperature Sensitivity of Porphyrin Binding and Porphyrin Effects on Subsequent Nucleoside Transport in Light and Dark.a
| Drug | Temp (°C) | Porphyrin bindingb
|
Transportc (%)
|
||
|---|---|---|---|---|---|
| Light | Dark | Light | Dark | ||
| Deuteroporphyrin IX (19663) | 0 | 20 | 13 | 60 | |
| 37 | 60 | 50 | 11 | 12 | |
| Hematoporphyrin (59265) | 0 | 10 | 4.5 | 16 | 80 |
| 37 | 30 | 25 | 15 | 19 | |
| Biscarboxycyclopropyldeuteroporphyrin IX (36001) | 0 | 0.35 | 0.2 | 95 | 98 |
| 37 | 0.5 | 0.4 | 100 | 102 | |
L1210 cells were incubated with specified agents at 10 μg/mL for 10 min at 0 °C or at 37 °C.
Binding shown as distribution ratio of drug concentration: per g of cells/per mL of medium, achieved after 10 min at the specified temperature in light or dark.
Nucleoside transport (%control). Light = cells exposed to porphyrin in light at specified temperature and then suspended in fresh medium (10 °C). Dark = cells treated with porphyrin in dark for 10 min at the specified temperature and then suspended in fresh medium at 10 °C and exposed to light for 10 min. Nucleoside transport was then measured over a 10-min interval at 10 °C in the dark.
In a related study, we measured the partition of each water-soluble porphyrin between 2-octanol and water (P value). The data are shown in Figure 4 in a plot of partition coefficient vs. cytotoxicity, the latter being represented by capacity of each drug, in light, to interfere with nucleoside transport by L1210 cell.5 In order to demonstrate the resulting correlation, four different drug levels were employed in the transport inhibition study. The data indicate a marked correlation between partition ration and cytotoxicity of these agents, the optimal octanol–water P value being in the range of 2–10. Agents with higher or lower values tend to have a decreased capacity to inhibit nucleoside transport and (see Table III) to be less able to bind to L1210 cells.
FIGURE 4.
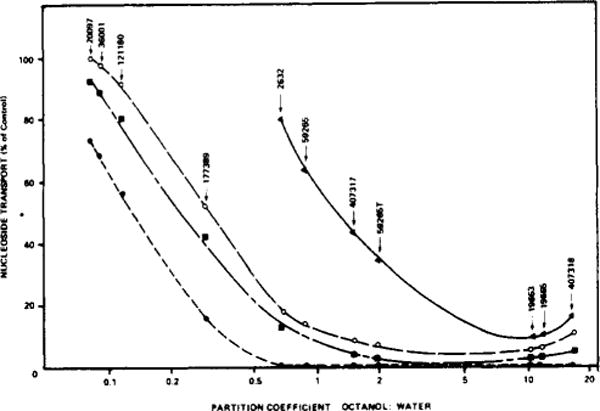
Comparison of effectiveness of porphyrins (in light) as inhibitors of nucleoside transport vs. partition ratio of each drug in a 2-octanol-water system. Drug levels employed in the inhibition study were: (▲) 3 μg/mL; (○) 10μg/mL; (■) 30 μg/mL; (●) 100 μg/mL. Nucleoside transport was measured after a 10-min exposure to porphyrin in light, using [14C]uridine at 10 °C. NSC drug numbers are shown; 59265T is a sample of hematoporphyrin treated with 0.1 N NaOH as described in the text.
We had previously noted that treatment of hematoporphyrin (NSC 59265) with dilute NaOH resulted in a twofold activation of the compound. When we compared the octanol-water partition of treated vs. untreated drug, we found the former to be the more soluble in octanol and to be a more potent inhibitor of nucleoside transport (Figure 4).
Reaersibility and Temperature Sensitiaity of Porphyrin Effects
Binding of different porphyrins to L1210 cells was found to be temperature sensitive, in the dark, and to be promoted by light. The latter observation suggests that a singlet oxygen induced disruption of barrier to porphyrin binding. When cells were exposed to deuteroporphyrin IX (19663) or to hematoporphyrin (59265) in the dark at 0 °C and then suspended in fresh medium and exposed to light, the extent of porphyrin binding was insufficient to cause demonstrable damage to nucleoside transport. In contrast, exposure of cells to porphyrin + light at 0 °C resulted in binding of sufficient porphyrin to cause a substantial inhibition of nucleoside transport. At 37 °C, sufficient porphyrin was accumulated in the dark, to cause substantial inhibition of nucleoside transport when cells were suspended in fresh medium and exposed to light. These data are summarized in Table III.
Discussion
We have demonstrated effects of a 10-min exposure of L1210 cells to photoactivated porphyrins which include marked inhibition of nucleoside and amino acid transport, alteration in barriers to uptake of actinomycin D, promotion of binding of the fluorogenic dye Ans, lowered cell-surface electronegativity, and inhibition of the ectoenzyme (DePierre and Karnovsky, 1974) 5′-nucleotidase. The most potent compounds tested produced the effects outlined above during a 10-min exposure to light at a level of 3 μg/mL. At a tenfold higher drug level, a substantial inhibition of intracellular nucleoside kinases and of sugar transport was observed. Cell viability was inhibited at the lower drug level. These data show an association between cytotoxicity and cell-surface effects at a drug level below that required for inhibition of the activity of an intracellular enzyme. The data of Table II indicate that the apparent inhibition of incorporation of precursors into nucleic acid and protein is based on the inhibition of precursor transport across the cell membrane.
The promotion, by porphyrins, of the uptake of actinomycin D apparently represents the disruption of a barrier to accumulation of this drug found in L1210 cells (Kessel and Bosmann, 1970). Similar disruptive effects may be involved in the observation that porphyrin binding is more extensive in light than in the dark, suggesting that the interaction between the cell membrane and activated porphyrin enhances further porphyrin binding, along with accumulation of Ans and actinomycin D. Moreover, the fluorescence yield from bound Ans was enhanced by prior treatment of cells with porphyrins in light. The fluorescence yield (ratio of cellular fluorescence to total Ans bound) is a measure of the polarity of the environment of the dye (Stryer, 1968). Although other factors affect fluorescence yield (Waggoner, 1976; Gomperts et al., 1970), binding of the dye to more hydrophobic cell components following treatment of cells with photoactivated porphyrins is proposed here. At progressively higher levels of photoactivated deuteroporphyrin IX, the fluorescence yield fell markedly. although the amount of total bound Ans remained constant (Figure 3). This phenomenon could be explained by an alteration in the environment of dye-binding sites at high levels of singlet oxygen. But we also observed a decrease in the fluorescence yield when L1210 cells were exposed to high porphyrin levels in the dark (Figure 3B). Competition between porphyrin and Ans for fluorogenic binding sites apparently accounts, at least in part, for the reduced fluorescence yield from Ans found at high porphyrin levels.
Exposure to photoactivated deuteroporphyrin IX markedly decreased the partition of L1210 cells between dextran and PEG. The finding that the number of untreated cells partitioning into the upper phase was greatly reduced by lowering the phosphate concentration in the mixture indicates the major determinant of partitioning behavior to be the negative charge at and near the cell surface (Walter, 1975; Albertsson, 1971; Reitherman et al., 1973). The data shown in Figure 2 indicate a dose-related decrease in the partition ratio caused by photoactivated porphyrin treatment.
Some cell-surface properties were not altered by a level of photoactivated deuteroporphyrin IX which did inhibit nucleoside transport and cell viability. Unaffected parameters include Con A binding and sugar transport. Thus the initial sites of interaction between the putative singlet oxygen intermediate and the cell surface must involve only specific membrane components.
The determinants of drug effectiveness are complex. We tested a number of porphyrin esters which readily generate singlet oxygen in ethanolic solution, but were inactive in the cell-culture system because of their low solubility in water. All of the agents examined here were water soluble and produced essentially similar amounts of singlet oxygen. We found two agents, NSC 36001 and 121180, which were relatively inactive. A study of porphyrin binding (in the dark) to L1210 cells revealed that neither of these inactive compounds was significantly bound, at 0 °C or at 37 °C. In contrast, an active agent, e.g., deuteroporphyrin IX, NSC 19663, was extensively bound, even at 0 °C. The extent of binding was found correlated with the octanol–water partition ratio for each porphyrin. The most active agents, e.g., NSC 19663, 59265,407317, were relatively hydrophobic with P values between 2 and 12. Hydrophilic agents, e.g., NSC 36001 and 121180, bearing multiple carboxyl or amino group substituents, with P less than 0.2, were poorly bound to L1210 cells. The hydrophobic agent NSC 407318 (P = 18), containing only a single COOH substituent, was less cytotoxic than the less hydrophobic agents.
We postulate that binding of porphyrin to a hydrophobic region of the cell membrane, a phenomemon related to the P value for each porphyrin, is an obligatory first step in drug cytotoxicity. Passage through a relatively hydrophilic membrane region, which acts as a barrier to uptake of hydrophobic materials (Am, actinomycin D, hydrophobic porphyrins), restricts accumulation of agents with high P values. Porphyrins concentrated within the hydrophobic membrane region are then photoactivated to produce singlet oxygen which acts to disrupt transport processes and barriers to uptake of hydrophobic compounds.
Girotti (1976) has described cross-linking of erythrocyte membrane proteins following exposure to photoactivated porphyrins; a similar phenomenon in the L1210 cell membrane may be the cause of all effects seen here. Alternatively, such cross-linking could be one of a number of separate effects produced by an agent which alters membrane properties.
We found other evidence of binding of porphyrins to the cell membrane in the absence of light: (a) a decreased partition coefficient (dextran-PEG) of cells treated with active agents, shown in Figure 2; and (b) a decreased fluorogenic interaction between cells and Ans (Figure 3). Inactive porphyrins, not bound to the cell membrane, failed to produce these effects.
Dougherty has calculated that the persistence of singlet oxygen in solution is theoretically sufficient to permit its traverse of 3–4 cell diameters (Dougherty et al., 1976) and has proposed that long-term exposure of cells to hematoporphyrin results in formation of singlet oxygen within the cell (Weishaupt et al., 1976). Our finding that inactive agents were unable to bind to the L1210 cell suggests that generation of singlet oxygen beyond the cell membrane does not have cytotoxic consequences. The present series of experiments, involving treatment of cells in suspension with soluble porphyrins, describes a series of toxic effects predominantly associated with the cell surface. Since loss of cell viability was correlated with cell-surface and membrane alterations, we propose that these alterations are implicated in the mode of action of the photoactivated porphyrins.
Footnotes
Supported by a contract (N-01 CM 53789) with the Division of Cancer Treatment, National Cancer Institute, National Institutes of Health.
Chemical names of these compounds and NSC identification numbers: 2632, protoporphyrin IX; 19663, deuteroporphyrin IX; 19665, mesoporphyrin IX: 20097. 2,4-diacetyldeuteroporphyrin IX; 36001, 2,4-bis(2-carboxycyclopropyl)deuteroporphyrin IX; 59265, hematoporphyrin; 121180, 2,18-porphinedipropionamide, N,N′-bis(2-aminocthyl)-8,13-bis[(2-aminoethyl)amino]-5,6,10,11,14,15,19,20-octahydro-3,7,12,17-tetramethyl: 177389, 2.18-porphinedipropionic acid, 7,12-diethenyl-3,8,13,17-tetramethyl; 407317, rhodoporphyrin; 407318, phylloporphyrin.
Abbreviations used are: DMF, N,N′-dimethylformamide; Ans, 8-anilino-1-naphthalenesulfonic acid; PEG, poly(ethyleneglycol) (mol wt 6000); MEM, minimal-essential Eagles’s medium (spinner modification); Con A, concanavalin A; Tes, N-tris(hydroxymethyl)-2-aminoethanesulfonate; Hepes, N-2-hydroxyethylpiperazine-N′-2-ethanesulfonate; PBS, phosphate-buffered saline (130 mM NaCl-20 mM sodium phosphate (pH 7.4))
In other studies, involving equilibrium dialysis, we found a 90–95% binding of deuteroporphyrin IX to fetal calf serum.
Microscopic examination 2 h after exposure of cells to photoactivated NSC 19663 (3 μg/mL) revealed substantial morphologic changes. suggesting a cytotoxic, rather than a cytostatic effect.
In other studies, we found a correlation between drug-induced inhibition of nucleoside transport vs. inhibition of cell viability in several agents selected from Table I (NSC 20097, 36001, 2632, 59265, 407318).
References
- Albertsson P. Partition of Cell Particles and Macromolecules. New York, N.Y.: 1971. pp. 95–99. [Google Scholar]
- DePierre JW, Karnovsky ML. Science. 1974;183:1096. doi: 10.1126/science.183.4129.1096. [DOI] [PubMed] [Google Scholar]
- Dougherty TJ, Gomer GJ, Weishaupt KB. Cancer Res. 1976;36:2320. [PubMed] [Google Scholar]
- Dougherty TJ, Grindey GB, Fiel R, Weishaupt KR, Boyle DG. J Natl Cancer Inst. 1975;55:115. doi: 10.1093/jnci/55.1.115. [DOI] [PubMed] [Google Scholar]
- Girotti AW. Biochem Biophys Res Commun. 1976;72:1367. doi: 10.1016/s0006-291x(76)80165-9. [DOI] [PubMed] [Google Scholar]
- Glastris B, Pfeiffer SE. Methods Enzymol. 1974;32:124. doi: 10.1016/0076-6879(74)32015-0. [DOI] [PubMed] [Google Scholar]
- Gomperts G, Lanthelme F, Stock R. Membrane Biol. 1970;3:241. doi: 10.1007/BF01868018. [DOI] [PubMed] [Google Scholar]
- Kessel D. Biochem Pharrnacol. 1976;25:483. doi: 10.1016/0006-2952(76)90353-1. [DOI] [PubMed] [Google Scholar]
- Kessel D. Biochem Pharrnacol. 1977 in press. [Google Scholar]
- Kessel D, Bruns R, Hall TC. Mol Pharrnacol. 1971;7:1971. [PubMed] [Google Scholar]
- Kessel D, Dodd DC. Biochim Biophys Acta. 1972;288:190. doi: 10.1016/0005-2736(72)90237-4. [DOI] [PubMed] [Google Scholar]
- Kessel D, Hall TC. Biochem Pharrnacol. 1967;16:2395. doi: 10.1016/0006-2952(67)90224-9. [DOI] [PubMed] [Google Scholar]
- Kessel D, Smith G, Blahnik J. Biochem Pharrnacol. 1976;25:1893. doi: 10.1016/0006-2952(76)90195-7. [DOI] [PubMed] [Google Scholar]
- Köteles GJ, Kubasova T, Barga L. Nature (London) 1976;259:507. doi: 10.1038/259507a0. [DOI] [PubMed] [Google Scholar]
- Reitherman R, Flanagan SD, Barondes SH. Biochim Biophys Acta. 1973;297:1973. doi: 10.1016/0304-4165(73)90065-2. [DOI] [PubMed] [Google Scholar]
- Scholtissek C. Biochim Biophys Acta. l967;145:228. doi: 10.1016/0005-2787(67)90041-x. [DOI] [PubMed] [Google Scholar]
- Spikes JD. Ann NY Acad Sci. 1975;244:496. doi: 10.1111/j.1749-6632.1975.tb41550.x. [DOI] [PubMed] [Google Scholar]
- Stryer L. Science. 1968;162:526. doi: 10.1126/science.162.3853.526. [DOI] [PubMed] [Google Scholar]
- Waggoner A. Enzymes of Biological Membranes. 1976:128–130. [Google Scholar]
- Walter H. Methods Cell Biol. 1975;9:25. doi: 10.1016/s0091-679x(08)60067-9. [DOI] [PubMed] [Google Scholar]
- Walter H, Krob EJ, Brooks DE. Biochemistry. 1976;15:2959. doi: 10.1021/bi00659a004. [DOI] [PubMed] [Google Scholar]
- Weishaupt KR, Gromer CJ, Dougherty TJ. Cancer Res. 1976;36:2326. [PubMed] [Google Scholar]