

SUMMARY
In skeletal myogenesis, the transcription factor MyoD activates distinct transcriptional programs in progenitors compared to terminally differentiated cells. Using ChIP-Seq and gene expression analyses, we show that in primary myoblasts, Snail-HDAC1/2 repressive complex binds and excludes MyoD from its targets. Notably, Snail binds E box motifs that are G/C rich in their central dinucleotides, and such sites are almost exclusively associated with genes expressed during differentiation. By contrast, Snail does not bind the A/T-rich E boxes associated with MyoD targets in myoblasts. Thus, Snai1-HDAC1/2 prevent MyoD occupancy on differentiation-specific regulatory elements, and the change from Snail to MyoD binding often results in enhancer switching during differentiation. Furthermore, we show that a regulatory network involving myogenic regulatory factors (MRFs), Snai1/2, miR-30a, and miR-206 acts as a molecular switch that controls entry into myogenic differentiation. Together, these results reveal a regulatory paradigm that directs distinct gene expression programs in progenitors versus terminally differentiated cells.
INTRODUCTION
The myogenic regulatory factors (MRFs) are a closely related family of basic helix-loop-helix (bHLH) transcription factors (MyoD, Myf5, myogenin, and MRF4) that regulate the skeletal muscle developmental program (Perry and Rudnicki, 2000). The MRF proteins contain a conserved basic DNA binding domain that binds the E box, a DNA motif that contains the core sequence CANNTG (Ma et al., 1994; Weintraub et al., 1994). The HLH domain mediates dimerization with other HLH-containing proteins such as the products of E2A gene (E12, E47), ITF2 and HEB (Barndt et al., 1999; Braun and Arnold, 1991; Davis et al., 1990; Murre et al., 1989).
The introduction of null mutations of the MyoD family into the germline of mice revealed the hierarchical relationships existing among the MRFs and established that functional overlap is a feature of the MRF regulatory network (Charge and Rudnicki, 2004). Strikingly, newborn mice deficient in both Myf5 and MyoD are totally devoid of myoblasts and myofibers. Thus, Myf5 and MyoD are required in myoblasts to establish their myogenic identity, and act upstream of myogenin and MRF4 (Braun et al., 1992; Rudnicki et al., 1992, 1993). Initiation of myogenic differentiation is characterized by cell-cycle withdrawal and sequential induction of myogenin and Mef2 expression (Berkes and Tapscott, 2005). However, at odds with this simplistic model are data from gene expression and binding-site studies revealing that MyoD directs multiple subprograms of gene expression, each of which is uniquely regulated (Bergstrom et al., 2002; Blais et al., 2005; Cao et al., 2010).
Snai1 and Snai2 are DNA-binding transcription factors widely expressed in mesodermal cells, including myoblasts. Snai1/2 bind the same DNA motif as the basic helix-loop-helix transcription factors such as MyoD. Snail1/2 have been shown to act as transcriptional repressors by recruiting HDAC1/2 (Bolos et al., 2003; Hajra et al., 2002; Peinado et al., 2007).
To study the differential functions of MyoD during the switch from proliferating myoblasts to terminally differentiated myotubes, we identified genome-wide MyoD targets in primary cultures of myoblasts, myocytes, and myotubes. We found that MyoD binding to DNA is highly regulated through differentiation and that distinct regulatory elements are employed, resulting in extensive enhancer switching during muscle differentiation. Our experiments identify a regulatory paradigm that directs MyoD to activate distinct myoblast-specific versus differentiation-specific gene expression programs. This regulatory network is made possible by sequence variation within E box motifs that affords differential binding affinities to Zn finger and bHLH proteins. Furthermore, we show that a molecular switch involving MRFs, Snai1/2, and miR-30a/miR-206 regulates transition from growth to differentiation. Together, our data uncover a unique regulatory paradigm that controls gene expression in progenitors versus terminally differentiated cells during muscle development.
RESULTS
MyoD Binding to DNA Is Regulated through Differentiation
To identify MyoD target sites throughout muscle cell development, we employed an improved ChIP-Seq method based on chromatin tandem affinity purification (ChTAP) (Soleimani et al., 2012). We generated C-terminal TAP-tagged fusion constructs of MyoD, Myf5, E47, Snai1, HDAC1, and HDAC2 by fusing their respective open reading frame (ORF) with 6xHis-TEV-3xFLAG TAP tag and performed high-throughput sequencing of the purified DNA (see Table S1 available online, binding data are available at GEO accession number GSE24852). We confirmed the low-level expression, nuclear localization, and functionality of MyoD-TAP-tagged protein in MyoD−/− myoblasts (Figure S1). Further confirmation of full functionality of MyoD-TAP construct was obtained by conversion of the C3H10T1/2 fibroblast cell line into myotubes by ectopic expression of MyoD-TAP.
We tested the efficacy of ChTAP-Seq by drawing a random set of 20 MyoD peaks from the pool of total peaks identified in MyoD-2DM (myotubes 2 days in differentiation) data set (Table S1), and validated by ChTAP-qPCR (Figures S1A–S1C, Table S2) against a negative control (IgH locus) (Bergstrom et al., 2002; Gillespie et al., 2009), and by ChIP using an antibody against the endogenous MyoD in differentiating myotubes (Figure S1D, Table S2). Notably, we observed a high correlation between fold enrichment of qPCR with both locus conservation (R = 0.559, p = 0.00679) and peak height (R = 0.48, p = 0.042) (Figures S1E and S1F). Moreover, we observed a high correlation in peak height/fold enrichment between ChTAP-Seq/ChTAP-qPCR and ChIP-qPCR (Figure S1G). In addition, a direct comparison between our ChTAP-Seq experiment and a recently published MyoD-ChIP-Seq experiment (Cao et al., 2010) revealed a highly significant linear correlation for peak height for the 5,581 peaks common between the two independent data sets (data not shown). Therefore, these results demonstrate that ChTAP faithfully detects the location and degree of binding across the genome.
MyoD and Myf5 Have Largely Distinct Targets in Myoblasts
To define MyoD and Myf5 binding sites, we applied modelbased analysis for ChIP-Seq (MACS) (Zhang et al., 2008), a widely used ChIP-Seq peak calling tool that allows subtraction of background determined in control experiments. Using this method, we identified only 1,428 MyoD-binding sites (including 718 conserved sites) in proliferating myoblasts, while 9,300 binding sites, including 5,517 conserved sites, were identified in myotubes (48 hr in differentiation) (Figure 1A, Figure S2, Table S3, and Table S4). This dramatic difference in the number of MyoD binding sites between myoblasts and myotubes was not due to differences in sequencing depth or fewer tags in myoblasts data set (Table S1). By contrast, we found that Myf5 binds to only 1,052 genomic regions including 585 conserved loci in proliferating myoblasts (Figure 1A, Figure S2, Table S5). Interestingly, there was a notable (30%) overlap between MyoD and Myf5 targets in proliferating myoblasts (Table S6), supporting the notion that these factors share a role in defining myoblast identity. Overall, 59% of MyoD and 55% of Myf5 binding sites were conserved. Analysis of peak quality scores for a number of criteria including peak height, tag number, MACS score, and the number of E boxes per peaks showed that conserved binding sites had higher quality scores than unconserved sites (Figure S2).
Figure 1. MyoD and Myf5 Binding Sites Are Highly Conserved.
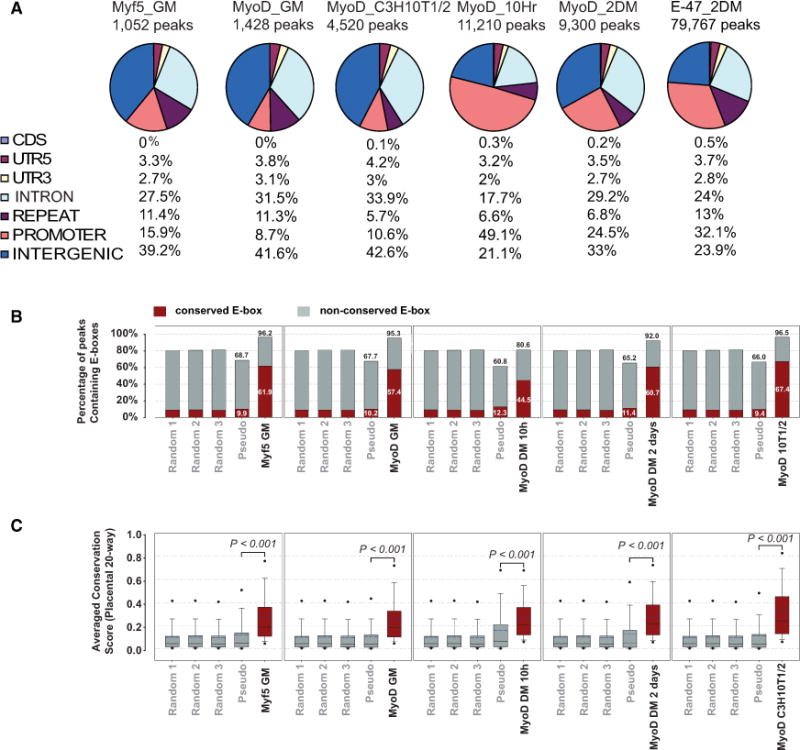
(A) Distribution of MyoD, Myf5, and E47 binding sites throughout muscle cell development. Numbers (percentages) indicate the distribution of various genomic features. GM, myoblasts in growth medium (proliferating myoblasts); DM, myotubes in differentiation medium.
(B) Comparison of conservation scores of E boxes in MyoD and Myf5 ChTAP-Seq peaks with those of pseudopeaks (control) and random genomic blocks (see the Supplemental Experimental Procedures). Red and gray indicate conserved and unconserved E boxes, respectively.
(C) Average conservation scores of MyoD and Myf5 ChTAP-Seq peaks. Scores are based on placental 20-way phastcon conservation scores. Black dots represent the fifth and the ninety-fifth percentiles. Bars represent the tenth and the ninetieth percentiles. In-box dashed lines represent means, and solid lines represent median values. See also Table S1, Table S3, Table S4, Table S5, Table S7, and Figure S1.
MyoD dominantly induces myogenic differentiation in a range of nonmuscle cells (Davis et al., 1987). Therefore, we employed ChTAP-Seq to identify MyoD binding sites in C3H10T1/2 fibroblasts that ectopically expressed MyoD-TAP (Figure 1A, Table S7). Interestingly, we identified 4,520 MyoD peaks in C3H10T1/2 cell line, of which 1,592 (35%) were common with myotubes derived from muscle cells (Figure S2), and only 322 (7.1%) were common with MyoD targets in proliferating myoblasts (Figure S2). Together, these data indicate that forced expression of MyoD in fibroblasts primarily drives the myogenic differentiation program by binding a subset of bona fide sites utilized in differentiated myogenic cells. Surprisingly, proliferating myoblasts exhibited MyoD binding at only 1,428 sites, of which only 392 (27.4%) sites were similarly bound in differentiated myotubes. The minimal overlap between myoblasts and myotubes strongly supports the assertion that MyoD has distinct functions in these two states of postnatal muscle development.
We estimated the number of MyoD molecules at a single cell level, both in the primary myoblasts (98,459 ± 5,119 molecules per cell) (Figure S3, Supplemental Information) and in the C2C12 myogenic cell line (38,793 ± 4,574 molecules per cell) (Figure S3). Based on previous studies on the kinetics of transcription factors binding to DNA showing that approximately 10% of transcription factor is bound to its recognition motif specifically at any given time (Elf et al., 2007), we speculated that MyoD is expected to bind to approximately 9,800 specific sites in primary muscle cells and to approximately 3,800 sites in C2C12 myogenic cell line. The theoretical estimates based on the measured number of MyoD molecules in primary muscle cells are consistent with our MyoD binding data of 9,300 sites during differentiation of primary muscle cells and similar to a recently published MyoD ChIP-Seq in myotubes with reported 13,688 binding sites (Mullen et al., 2011).
Snai1/2 Block MyoD Access to Differentiation Genes
To answer the key question of how MyoD is excluded from accessing differentiation genes during growth phase of myoblasts as indicated by our data (Figure 1A, Figure 2, Table S3, Table S4), we focused on Snai1 and Snai2 transcriptional repressors that share the same DNA binding motif as helix-loop-helix transcription factors such as MRFs (Bolos et al., 2003; Hajra et al., 2002; Peinado et al., 2007). Gene expression analysis of myoblasts undergoing differentiation showed that both Snai1 and Snai2 are rapidly turned off as muscle differentiation proceeds (Figure 2C). Ectopic overexpression of Snai1/2 blocks myoblasts’ entry into differentiation (Figure S4A). Genome-wide binding site analysis of Snai1 together with HDAC1 and HDAC2 revealed that Snai1-HDAC1/2 repressive complex binds to multiple differentiation-specific genes during the growth phase of myoblasts (Figures 2A and 2D). Furthermore, this binding results in the exclusion of MyoD from these sites (Figure 2). Progression of differentiation is characterized by binding of MyoD to targets, resulting in the recruitment of histone acetylase activity (de la Serna et al., 2001; Sartorelli et al., 1997). We confirmed the enrichment of acetylated histone on myogenin promoter during differentiation (Figures S4B–S4D). Conversely, during the growth phase of myoblasts, Snai1/2 recruit HDACs to block the activation of differentiation genes (Figures 2A and 2D and see below). In vivo depletion of Snai1/2 by siRNAs resulted in substantial reduction of HDAC1 on the promoter of differentiation genes in myoblasts (Figure S4).
Figure 2. Dynamic Switch of Snai1/HDACs and MyoD/E47 during Differentiation.
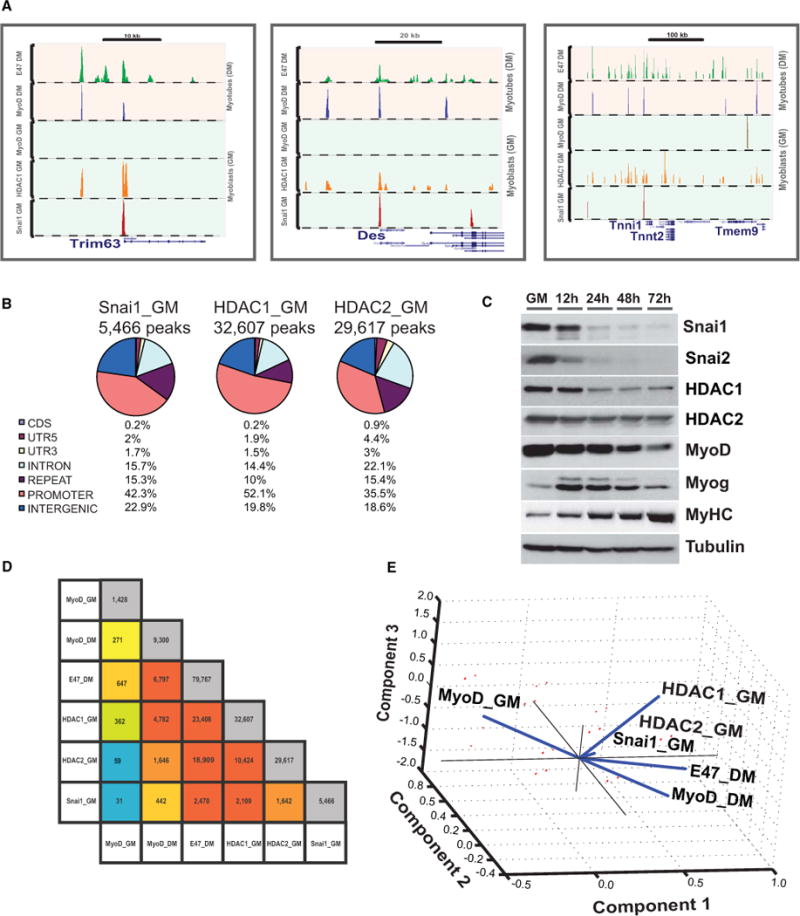
(A) Switch from repressive (Snai1/HDAC1) to activating (MyoD/E47) on a representative set of genes during myogenic differentiation.
(B) Genome-wide distribution of Snai1, HDAC1, and HDAC2 binding sites in growing primary skeletal myoblasts. Numbers (percentages) indicate the distribution of peaks within various genomic features.
(C) Western blots analysis of differentiation time course of myoblasts (GM) to myotubes (72 hr) in differentiation media. Snai1, Snai2, and MyoD have overlapping expression in myoblasts but not in myotubes.
(D) Pairwise overlaps of binding sites of MyoD, E47, Snai1, HDAC1, and HDAC2. Diagonal shows the total number of binding sites per factor. Color represents the extent of overlap from blue to red, lowest to the highest.
(E) PCA used to visualize the overall relationship among six ChIP-Seq data sets. PCA was performed using an input binary matrix of 1 and 0 s for presence and absence of a peak on a given genomic site, respectively. See also Table S2, Table S6, and Figure S2 and Figure S3.
We also performed whole transcriptome analysis (RNA-Seq) to identify global targets of Snai1 and Snai2 in siRNA-treated myoblasts. Notably, we observed a significant overlap between Snai1 and Snai2 targets (Figure 3B). In vivo depletion of Snai1, Snai2, or both resulted in derepression of >2,000 genes (fold change >2, p value <10−5), suggesting that these factors have a large sets of target genes in muscle cells (Figure 3).
Figure 3. Snai1 and Snai2 Repress Differentiation Genes.
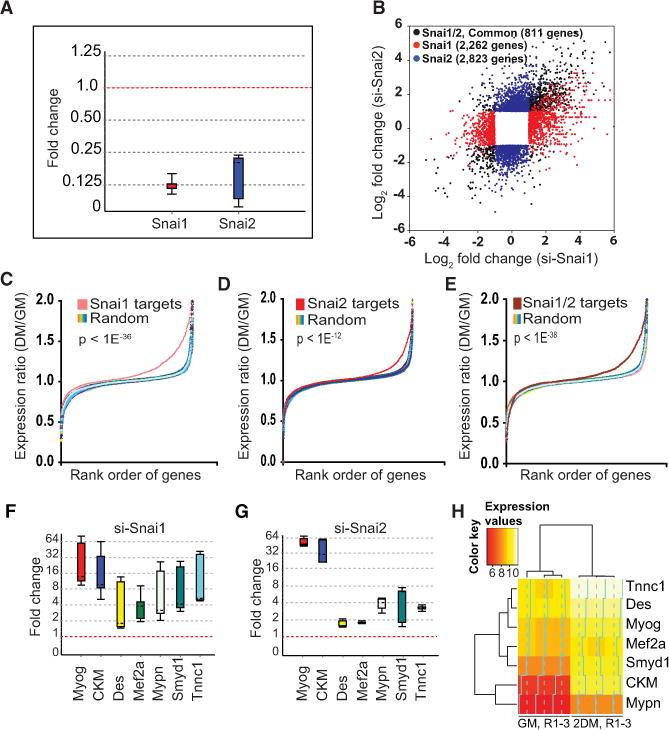
(A) Transient in vivo depletion of Snai1 and Snai2 in growing primary skeletal myoblasts by siRNA. Whisker box plots were generated using REST 2009 Qiagen software (Pfaffl et al., 2002) to assess the relative abundance of transcript level using gene-specific primers (Supplemental Experimental Procedures). The box represents 50% of all observations, dashed line inside the box represents median. Top and bottom whiskers represent upper and lower twenty-fifth percentiles, respectively. GAPDH (housekeeping gene) was used as reference for normalization.
(B) Scatterplot of significantly regulated genes in si-Snai1- and si-Snai2-treated myoblasts. RNA-seq analysis was performed on purified mRNA. Black circles represent significantly regulated (fold change >2, p value <10−5) genes common between si-Snai1- and si-Snai2-treated myoblasts, red circles represent genes that are significantly up- or downregulated in si-Snai1, and blue circles represent genes that are significantly up- or downregulated in si-Snai2-treated myoblasts. An si-Scrambled siRNA was used as a control.
(C) Genes that are repressed by Snai1 are upregulated during differentiation. Gene expression profile of Snai1 targets (red) versus an equal number of randomly selected set of genes (rainbow) taken from microarray analysis of wild-type myoblasts and myotubes shows that genes that are repressed by Snai1 are primarily upregulated during differentiation. The ratio of myotubes to myoblasts (DM/GM) is log2 ratio of normalized expression between myotubes, 2 days in DM, divided by their corresponding expression values in myoblasts. Controls (rainbow) represent ten randomly selected sets of probes after randomizing the order of probes on Affymetrix chip. p values are based on the Kolmogorov-Smirnov probability distribution.
(D and E) Similar analysis as in (C) for Snai2 and Snai1/2 targets, respectively, showing that genes repressed by Snai2 are primarily those that are upregulated during differentiation.
(F) Real-time RT-qPCR validation of a subset of Snai1 targets showing upregulation of these genes in si-Snai1-treated myoblasts relative to si-Scrambled treated control myoblasts, as described in (A). Also, see the Supplemental Experimental Procedures for primer sequences.
(G) Real-time RT-qPCR validation of a subset of Snai2 target genes using gene-specific primers as described in (F).
(H) A heat map based on the hierarchical clustering showing the expression pattern of genes from (F) and (G) during muscle cell differentiation program. Input expression data are from microarray analysis.
To see if Snai1/2 repress developmentally upregulated genes, we first performed microarray analysis on satellite cell-derived myoblasts and myotubes (GEO accession number GSE24811). We divided genes into upregulated, downregulated, and unchanged groups based on their expression patterns between myoblasts and myotubes (data not shown). We took the full set of genes repressed by Snai1, Snai2, and Snai1/2 (Figure 3) to test the hypothesis that Snai1/2 repress developmentally upregulated genes. We compared the expression ratio of myotubes/myoblasts (DM/GM) for the entire set of genes that were repressed by Snai1, Snai2, or both and compared it to randomly selected sets of genes. We found that genes repressed by Snai1, Snai2, or both mainly constitute genes that are upregulated during muscle cell differentiation (Figures 3C–3E). We further validated a subset of these genes, all of which are known MyoD targets and upregulated during myogenic differentiation (Figures 3F–3H) by quantitative real-time PCR using genespecific primers (Supplemental Information, Figures 3F and 3G).
Using ChTAP-Seq, we found that Snai1/HDAC1/2 complex occupies many important muscle differentiation genes in myoblasts (Figure 2). Importantly, the same binding sites are occupied by MyoD/E47 in myotubes (Figures 2D and 2E), suggesting that there is a dynamic switch from a repressive to an activating complex on muscle-specific genes during differentiation (Figure 2). Snai1/2-depleted myoblasts undergo precocious differentiation, as evidenced by significant increase in the expression of myosin heavy chain, a marker for terminal differentiation of muscle cells (Figure 4). Conversely, continuous ectopic expression of Snai1/2 blocked myoblasts’ entry into differentiation (Figure S4).
Figure 4. Snai1 and Snai2 Inhibit Myogenic Differentiation.
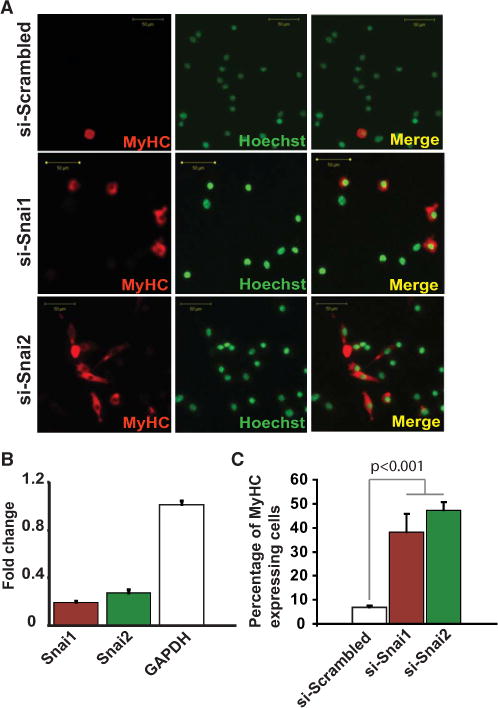
(A) Immunostaining of in vitro cultures of primary skeletal myoblasts treated with si-Snai1, si-Snai2, or si-Scrambled (control). Depletion of Snai1 or Snai2 results in precocious differentiation of myoblasts under growth conditions as shown by a significant increase in the number of myosin heavy-chain (MyHC)-expressing cells (red) in the si-Snai1- or si-Snai2-treated myoblasts compared to the control. Nuclei were counterstained with Hoechst (green).
(B) Real-time RT-PCR with gene-specific primers showing the extent of knockdown of Snai1 and Snai2 compared to si-Scrambled (control).
(C) Quantification of MyHC expressing myoblasts from (A) compared to the baseline spontaneous differentiation of a control from (A). Error bars represent standard deviation (n = 3). See also Figure S4.
Variation in E Box Motifs Is Essential for the Regulation of MyoD Binding
To mechanistically understand how Snai1 or Snai2 can block MyoD-mediated induction of myogenic differentiation but exert no effect on MyoD function in growth, we first synthesized oligonucleotides containing canonical E box sequence (Supplemental Information). We then mutated the center dinucleotides, hitherto described as degenerate sequences, to various combinations ranging from 0% to 100% GC content. We subcloned these sequences into pGL4.23 luciferase reporter plasmid and performed luciferase assay in two independent cell lines, namely HEK293T and Cos7 cells. We found that while Snai1 effectively abolishes MyoD/E-47 activity on G/C-rich E boxes, it has no significant affect on MyoD or MyoD/E-47 activity on G/C-poor E boxes (Figures 5A and 5B). Similarly, we found that Snai1 actively repressed Myf5 activity on G/C-rich E box, suggesting that Snails directly compete against MRFs for binding to E box motifs (Figure 5C). The same experiment performed with Snai2 showed similar results (data not shown). In vitro electrophoretic mobility shift assay (EMSA) also corroborated the above observations (Figure 5).
Figure 5. Snai1 Competes with MyoD on G/C-Rich E Boxes.
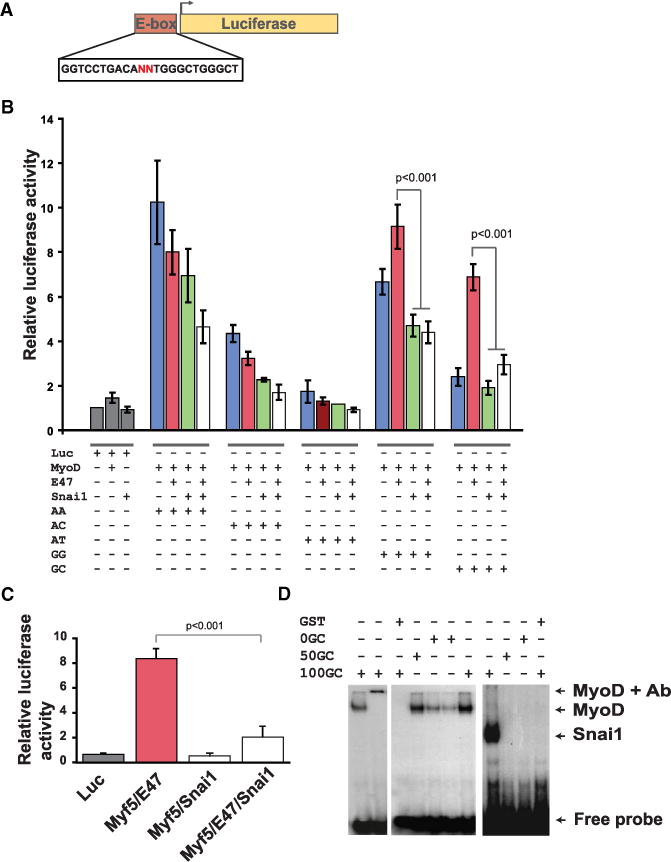
(A) A multimerized (3×) oligonucleotide containing canonical E box (CANNTG) was subcloned into pGL4.23 luciferase construct.
(B) Relative luciferase activity showing the outcome of competition between MyoD versus Snai1 and MyoD/E47 versus Snai1 on a set of E boxes ranging from 0% to 100% GC content in their center, variable dinucleotides in Cos7 cells. Transfections were done using polyethylenimine (PEI) with 1:1 molar ratio of plasmids in competition assays. Error bars represent standard deviation (n = 9).
(C) Snai1 competes against Myf5 on CAGGTG E box similar to in (B).
(D) EMSA of MyoD and Snai1 on E boxes with various GC content in their center dinucleotides. GST-tagged MyoD and Snai1 were expressed in E. coli, and proteins were purified using GST-tagged protein purification system.
MyoD Switches Binding Sites on Genes Regulated through Differentiation
The observation that Snai1/2 block MyoD access to differentiation genes while having no such effects on MyoD targets in proliferation raised an intriguing question on how developmentally upregulated MyoD targets (i.e., genes that are targeted by MyoD in both myoblasts and myotubes and are upregulated during differentiation) are regulated. We determined MyoD target genes (genes up- or downregulated by >1.5-fold in MyoD−/− cells) (Porter et al., 2007) for which there was a MyoD peak within ±10 kb of the TSS. We found that 60 genes fulfilled the above criteria. Analysis of these genes showed that MyoD utilizes different enhancer elements to direct their expression between myoblasts and myotubes (Figures 6A and 6B). Importantly, we found a significant increase in the number of A/T-rich E boxes utilized in myoblast enhancers of these genes (Figure 6A). However, in myotubes, the enhancer elements that are utilized by MyoD are preferentially G/C rich (Figure 6A). This result indicates that during growth, when MyoD is coexpressed with repressor Snail proteins, A/T-rich E boxes are accessible to MyoD because these motifs have no affinity for Snai1/2 binding. This finding is further supported by the analysis of genome-wide MyoD-bound E boxes (Figure 6), where there is a notable increase in the number of A/T-rich-containing E boxes within MyoD peaks in growth compared to the corresponding number in differentiation.
Figure 6. Enhancer Switching on Differentiation-Induced Genes.
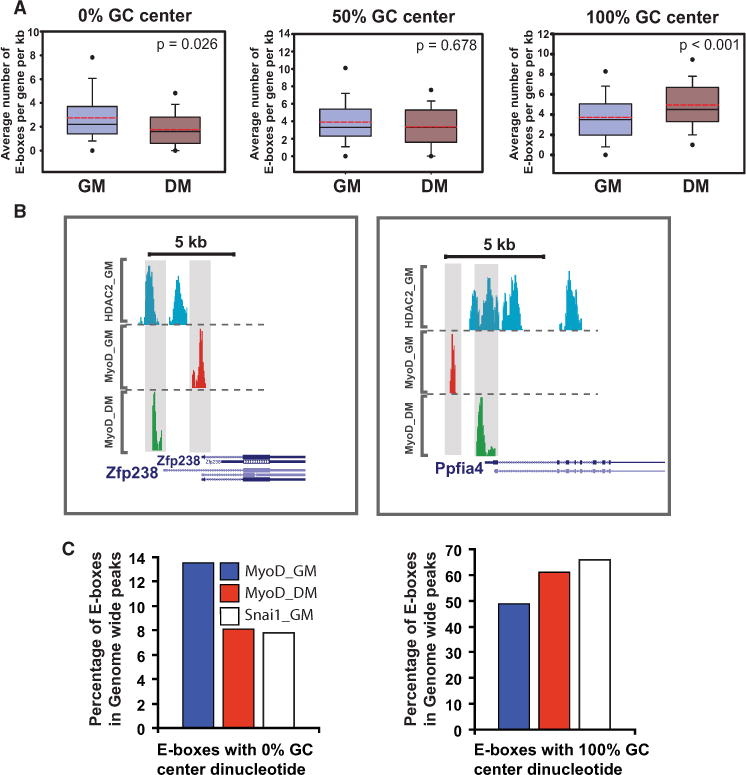
(A) Distribution of E box classes with various GC content in their center dinucleotides associated with MyoD peaks in growth and differentiation for MyoD targets genes that are upregulated during myogenic differentiation for all MyoD peaks within ±10 kb of the TSS. y axis shows the average number of E boxes per peaks per gene, normalized per kilobase. In-box dashed red line indicates mean, solid line (black) indicates median. Lower and upper solid circles indicate the fifth and ninety-fifth percentiles, respectively. p values are calculated based on the Wilcoxon signed rank test.
(B) Binding pattern of MyoD on two representative genes from (A).
(C) Genome-wide distribution pattern of E boxes (0%, 50%, and 100% GC content in their center dinucleotides) among MyoD GM, MyoD 2DM, and Snai1 GM ChIP-Seq data sets.
Our experiments uncover an epigenetic regulatory paradigm whereby sequence degeneracy in cis-regulatory motif controls the interplay between a repressor and an activator to direct enhancer switching and thus direct distinct gene expression programs in progenitors versus terminally differentiated cells.
A Regulatory Loop Controls Entry into the Differentiation Program
Our data show that continuous expression of Snai1 and Snai2 impedes myogenic differentiation (Figure S4). Therefore, removal of these repressive factors is essential for the progression of differentiation. Consistent with this observation, the Snail proteins are rapidly removed at the onset of differentiation (Figure 2C). Snai1 is a known target of miR-30a (Kumarswamy et al., 2011). Ectopic expression of miR-30a in Cos7 cells resulted in significant reduction in Snai1 protein (Figure S5A). Transient transfection of myoblasts with miR-30a-expressing plasmid also resulted in significant reduction in the Snai1 transcript, confirming the previous report that Snai1 is targeted by miR-30a. Interestingly, we identified two myogenin binding sites around Mir30a gene, suggesting that this microRNA is a target of MRFs (Figure S5B).
We show that rapid removal of Snai2 at the onset of muscle cell differentiation program is mediated by the muscle-specific microRNA miR-206. The 3′UTR of Snai2 contains miR-206 target, and the seed sequence is highly conserved among vertebrates (Figure 7A). Overexpression of miR-206 in Cos7 cells resulted in near-complete removal of Snai2 protein in this cell line (Figure 7B). Transient transfection of primary myoblasts with miR-206 plasmid resulted in approximately 50% reduction in Snai2 transcript level (Figures 7C and 7D). This is consistent with approximately 50% transfection efficiency of primary myoblasts with a DNA plasmid. Notably, miR-206 is a known target of MRFs such as MyoD (Sweetman et al., 2008; and Figure S5C). Taken together, our data show that at the onset of myogenic differentiation a regulatory loop involving Snail family, MRFs, and mircoRNAs acts as a molecular switch to regulate entry into myogenic differentiation program (Figure 7F).
Figure 7. A Regulatory Network Controls Entry into Myogenic Differentiation.
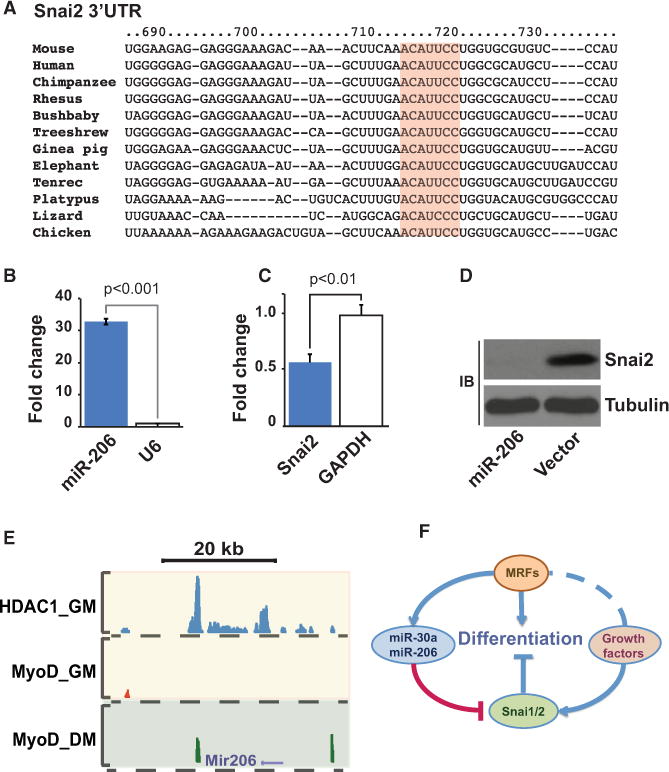
(A) Snai2 is a target of miR-206. The 3′UTR of Snai2 contains miR-206 binding sequence. The seed sequence (highlighted) is highly conserved among vertebrates.
(B) Ectopic overexpression of miR-206 in primary myoblasts.
(C) Transient transfection of primary myoblasts with miR-206 plasmid results in significant reduction in Snai2 transcript.
(D) Transient transfection of Cos7 cells with miR-206 expression plasmid results in near-complete elimination of Snai2 protein. The high efficiency of miR-206-mediated removal of Snai2 in Cos7 cells is due to high transfection efficiency of the latter cell line compared to primary myoblasts.
(E) MyoD binds to Mir206 promoter during differentiation. In growing myoblasts, the promoter of Mir206 is occupied with HDAC1.
(F) A regulatory loop controls entry into myogenic differentiation. At the onset of differentiation, MRFs target miR-30a and miR-206, which in turn remove Snai1 and Snai2 transcripts, respectively. Incremental removal of Snai1/2 weakens Snai1/2-HDAC1/2 complex and tilts the balance toward MyoD/E-protein activating complex, allowing progression of differentiation. See also Figure S5.
DISCUSSION
MyoD functions as a muscle stem cell determination factor that is required to establish myogenic progenitor cell identity (Asakura et al., 2002; Bentzinger et al., 2012; Kablar et al., 1998; Rudnicki et al., 1993). MyoD also plays a key role as a differentiation factor, for example by inducing the expression of myogenin, a potent differentiation factor, among others (Cheng et al., 1995; Deato et al., 2008; Ishibashi et al., 2005). Understanding how a single transcription factor such as MyoD can initiate distinct subprograms during development has profound impact on the understanding of gene regulatory network. Multiple mechanisms have been implicated to differentially modulate MyoD binding between growth and differentiation of muscle cells including heterodimerization with E-proteins such as E47/E12 (Spinner et al., 2002), interaction with Twist protein (Hamamori et al., 1997; Hebrok et al., 1997), interaction with the inhibitory Ids proteins (Chen et al., 1997), and posttranscriptional modifications of MyoD (Gillespie et al., 2009; Song et al., 1998) and its heterodimerization partners (Butler et al., 2009; Lluis et al., 2005; Mitsui et al., 1993). Importantly, none of these mechanisms adequately explain the discrete behavior in MyoD binding pattern on unique targets during two different stages of muscle development.
To gain further insight into the molecular mechanism that regulates MyoD access to DNA, we first identified genome-wide binding sites of Snai1, HDAC1, and HDAC2. These class I histone deacetylases have known functions in tissue development (Laherty et al., 1997; Montgomery et al., 2007; Peinado et al., 2004; von Burstin et al., 2009; Yoshikawa et al., 2007) and are highly expressed in myoblasts. We found that in myoblasts HDAC1/2 are enriched on numerous differentiation genes together with Snai1 (Figure 2). Snail/HDAC1/2 preferentially bind to G/C-rich E boxes in myoblasts. Importantly, these sites are not enriched for MyoD in myoblasts (Figure 2). However, during differentiation, removal of Snai1 and Snai2 by miR-30a and miR-206, respectively, results in MyoD occupancy on G/C-rich differentiation-specific E boxes. Therefore, MyoD binding to DNA is regulated by interplay with Snai1 and Snai2 acting on variations in cis-regulatory elements.
We provide both in vitro and in vivo evidence that Snai1 and Snai2 impede MyoD-mediated induction of myogenic differentiation under growth condition (Figure 3–5). Importantly, these repressor proteins have no affect on MyoD function on A/T-rich E-boxes. The antagonistic interplay between Snai1/2 and MyoD is important in muscle regeneration and development by allowing an initial expansion of a small pool of activated muscle satellite cells. Members of Snail family of proteins have been shown to bind GG/CC E-boxes (Niessen et al., 2008; Peinado et al., 2004) and Snai3 has been shown to compete with MyoD on a muscle-specific gene (Kataoka et al., 2000). In this study we show that preferential binding of Snai1 or Snai2 to G/C-rich E boxes deprives MyoD access to these motifs, which are preferentially associated with muscle differentiation genes. In addition, we show that both Snai1 and Snai2 bind to E47 (Figure S5D), which is a known heterodimerization partner of MyoD. Therefore our data suggest that heterodimerization of Snai1/2 with E47 can additionally deprive MyoD from activating G/C-rich E boxes in part by sequestering its dimerization partner. Expression from G/C-rich E boxes is strongly induced by MyoD/E-protein heterodimer as demonstrated previously (Foulds and Etzkorn, 1999) and confirmed in this study.
Previous studies have shown that E boxes with variable G/C content show differences in binding affinity for MyoD (Blackwell and Weintraub, 1990), and other HLH proteins (Grove et al., 2009). We show that as a result of the differential affinity of E box motifs for bHLH proteins such as MyoD and zinc finger repressor proteins such as the Snail family of proteins there is an asymmetric distribution of these cis-regulatory motifs across muscle-specific genes. Our data show that while differentiation genes are predominantly regulated through G/C-rich E boxes, the A/T-rich counterparts are more likely associated with MyoD targets in proliferation (Figure 6).
By in vitro and in vivo assays, we show that competition between Snail proteins and MyoD is an important mechanism that regulates distinct patterns of MyoD binding in myoblasts and myotubes. However, on a genome-wide scale, there are many more MyoD binding sites compared to Snai1 sites (Figure 2D). Furthermore, many Snai1 binding sites do not overlap with MyoD (Figure 2). This raises the possibility that additional mechanisms and E box binding repressors such as Zeb1 (Genetta et al., 1994) and Snai3 (Kataoka et al., 2000) may also have a role in the regulation of MyoD binding.
The transition from proliferation to differentiation is a critical step in muscle development. We show that a unique regulatory loop involving Snails, MRFs, and microRNAs regulates entry into the myogenic differentiation program (Figure 7). Rapid removal of Snai1 and Snai2 at the onset of differentiation is mediated by miR-30a and miR-206, which target Snai1 and Snai2, respectively. Both of these microRNAs are targeted by MRFs at the onset of differentiation. We propose a model in which transition into differentiation environment tilts the balance in favor of MRFs binding, resulting in incremental upregulation of myogenin. MRFs bind to miR-30a and miR-206 promoters (Figure 7, Figure S5). These microRNAs in turn target Snai1 and Snai2 for degradation (Figure 7). Under this model, an initial withdrawal of growth factors initiates a molecular cascade resulting in MRFs-mediated activation of microRNAs to specifically remove Snai1/2, inhibitors of differentiation.
Snail family proteins are widely expressed in mesodermal lineages and in cancers such as rhabdomyosarcoma, lung adenocarcinoma, and ovarian carcinoma (Khan et al., 1999; Kurrey et al., 2005; Shih et al., 2005; Wu et al., 2005). Therefore, the molecular mechanism involving interplay between E box binding Snail family members and bHLH factors on variation in cis-regulatory elements may have broad relevance for our understanding of the regulation of cell differentiation in development and in malignant progression.
EXPERIMENTAL PROCEDURES
Plasmids and Cell Culture
Mouse MyoD, Myf5, Snai1, Snai2, E47, HDAC1, and HDAC2 c-terminal TAP-tagged fusion constructs were produced by subcloning the complete ORF of these genes into pBRIT-CTAP-HF as described previously (McKinnell et al., 2008). Muscle stem cells were isolated from the hind limb of 4- to 6-week-old wild-type mice by fluorescence-activated cell sorting as described previously (Kuang et al., 2007) and propagated on collagen-coated culture dish in Ham’s F10 media supplemented with 20% fetal bovine serum, 1% penicillin/streptomycin, and 2.5 ng/ml bFGF. Low-passage myoblasts were infected with retroviral particles harboring the ORF of interest under low multiplicity of infection to prevent multiple integrations of retrovirus per cell (Supplemental Experimental Procedures). Stable primary cell cultures were obtained by applying puromycin selection. Cultures of primary myotubes were obtained by adding differentiation media (DMEM supplemented with 5% horse serum) to fully confluent myoblasts and allowed to differentiate.
Chromatin Tandem Affinity Purification
ChTAP was carried out by two sequential affinity pull-down with tandem affinity purification as described recently (Soleimani et al., 2012).
DNA Sequencing and Mapping
ChIP DNA library was prepared according to the Illumina protocol (http://www.illumina.com/). Sequencing reads (36 bp) were generated on Illumina GAIIX Genome Analyzer or on HI-SEQ 2000 platforms (Table S1). Sequenced reads with identical 5′ ends were counted as one to avoid PCR-induced sequencing bias. Reads were mapped to mouse mm9 genome (NCBI37) genome assembly by ELAND (Illumina), allowing up to two mismatches (see the Supplemental Experimental Procedures).
Peak Calling
Aligned sequence tags from the ChIP experiment and a corresponding control were fed to MACS (version 1.3) (Zhang et al., 2008). Background reads present in the control ChIP were subtracted from the experimental ChIP by calculating the raw score of 50 bp windows across the genome for the control and the experimental ChIP. We then subtracted the raw score of control from the raw score of ChIP to generate the subtracted scores. Pseudopeaks were generated from the tag-enriched genomic regions in the control experiment using GLobal Identifier of Target Region (GLITR) (Tuteja et al., 2009) (see the Supplemental Experimental Procedures).
Gene Expression Analyses
We used the Affymetrix MoGene 1.0 ST chip sets to study the global pattern of gene expression during muscle cell differentiation. Muscle satellite cells were isolated as described in the Supplemental Experimental Procedures. Total RNA was isolated from satellite-cell-derived myoblasts and myotubes in triplicate. Data analysis was performed as described previously (Soleimani et al., 2012). Also see the Supplemental Experimental Procedures. To study the genome-wide targets of Snai1 and Snai2, we used siRNAs to deplete Snai1 and Snai2 transcripts in vivo. We isolated mRNA and performed whole transcriptome analysis (RNA-seq) as described in the Supplemental Experimental Procedures.
Electrophoretic Mobility Shift Assay
MyoD-, Snai1-, and Snai2-GST-tagged fusion proteins were purified from BL21 E. coli cells. EMSA was carried out using a 32P-radiolabeled synthetic DNA probe containing the canonical E box sequence with various mutations in the degenerate center dinucleotide (Supplemental Experimental Procedures). EMSA experiments were carried out as described previously (Soleimani et al., 2012).
Luciferase Reporter Assays
Two independent cell lines were used for luciferase assays. HEK293T and Cos7 cells were cotransfected with pGL4.23-E box with a multimerized (3×) sequence containing triple tandem E box sequences using linear polyethylenimine (PEI) (Supplemental Experimental Procedures). For the competition between between MRFs/E47 (MyoD and Myf5) and Snail family (Snai1 and Snai2), a 1:1 ratio of plasmids was used.
Statistical Analysis
Results are expressed as mean ±SD. Pairwise comparisons were done using Student’s t test or as stated. Principle component analysis (PCA) was used for the visualization of genome-wide binding data. PCA was performed by Princomp function of MATLAB using an input binary matrix of 1 and 0 s for presence and absence of a peak on a given genomic site.
Other Experimetal Procedures
The complete description of experimental procedures is included in the Supplemental Experimental Procedures.
Supplementary Material
Acknowledgments
We thank Dr. Theodore Perkins, Christopher Porter, and Gareth Palidwor at the Ottawa Hospital Research Institute (OHRI) for help with data processing. We thank Andrew E. Jones at the OHRI for his critical review of the manuscript. M.A.R. holds the Canada Research Chair in Molecular Genetics and is an International Research Scholar of the Howard Hughes Medical Institute. This work was funded by the Canadian Institutes of Health Research (CIHR) grant MOP12080, NIH/NIAMS grant R01AR044031, and Ontario Research Fund (ORF) grants to M.A.R., and by the EuTRACC, a European Commission 6th Framework grant to F.G.
Footnotes
ACCESSION NUMBERS
The superseries GSE24904 at GEO contains all ChIP-Seq (GSE24852), RNA-seq (GSE38236), and microarray (GSE24811) data that are used throughout this study.
Supplemental Information includes five figures, seven tables, Supplemental Experimental Procedures, and Supplemental References and can be found with this article online at http://dx.doi.org/10.1016/j.molcel.2012.05.046.
References
- Asakura A, Seale P, Girgis-Gabardo A, Rudnicki MA. Myogenic specification of side population cells in skeletal muscle. J Cell Biol. 2002;159:123–134. doi: 10.1083/jcb.200202092. [DOI] [PMC free article] [PubMed] [Google Scholar]
- Barndt R, Dai MF, Zhuang Y. A novel role for HEB downstream or parallel to the pre-TCR signaling pathway during alpha beta thymopoiesis. J Immunol. 1999;163:3331–3343. [PubMed] [Google Scholar]
- Bentzinger CF, Wang YX, Rudnicki MA. Building muscle: molecular regulation of myogenesis. Cold Spring Harb. Perspect Biol. 2012;4 doi: 10.1101/cshperspect.a008342. http://dx.doi.org/10.1101/cshperspect.a008342. [DOI] [PMC free article] [PubMed] [Google Scholar]
- Bergstrom DA, Penn BH, Strand A, Perry RL, Rudnicki MA, Tapscott SJ. Promoter-specific regulation of MyoD binding and signal transduction cooperate to pattern gene expression. Mol Cell. 2002;9:587–600. doi: 10.1016/s1097-2765(02)00481-1. [DOI] [PubMed] [Google Scholar]
- Berkes CA, Tapscott SJ. MyoD and the transcriptional control of myogenesis. Semin Cell Dev Biol. 2005;16:585–595. doi: 10.1016/j.semcdb.2005.07.006. [DOI] [PubMed] [Google Scholar]
- Blackwell TK, Weintraub H. Differences and similarities in DNA-binding preferences of MyoD and E2A protein complexes revealed by binding site selection. Science. 1990;250:1104–1110. doi: 10.1126/science.2174572. [DOI] [PubMed] [Google Scholar]
- Blais A, Tsikitis M, Acosta-Alvear D, Sharan R, Kluger Y, Dynlacht BD. An initial blueprint for myogenic differentiation. Genes Dev. 2005;19:553–569. doi: 10.1101/gad.1281105. [DOI] [PMC free article] [PubMed] [Google Scholar]
- Bolos V, Peinado H, Perez-Moreno MA, Fraga MF, Esteller M, Cano A. The transcription factor Slug represses E-cadherin expression and induces epithelial to mesenchymal transitions: a comparison with Snail and E47 repressors. J Cell Sci. 2003;116:499–511. doi: 10.1242/jcs.00224. [DOI] [PubMed] [Google Scholar]
- Braun T, Arnold HH. The four human muscle regulatory helix-loop-helix proteins Myf3-Myf6 exhibit similar hetero-dimerization and DNA binding properties. Nucleic Acids Res. 1991;19:5645–5651. doi: 10.1093/nar/19.20.5645. [DOI] [PMC free article] [PubMed] [Google Scholar]
- Braun T, Rudnicki MA, Arnold HH, Jaenisch R. Targeted inactivation of the muscle regulatory gene Myf-5 results in abnormal rib development and perinatal death. Cell. 1992;71:369–382. doi: 10.1016/0092-8674(92)90507-9. [DOI] [PubMed] [Google Scholar]
- Butler DC, Haramizu S, Williamson DL, Alway SE. Phospho-ablated Id2 is growth suppressive and pro-apoptotic in proliferating myoblasts. PLoS ONE. 2009;4:e6302. doi: 10.1371/journal.pone.0006302. http://dx.doi.org/10.1371/journal.pone.0006302. [DOI] [PMC free article] [PubMed] [Google Scholar]
- Cao Y, Yao Z, Sarkar D, Lawrence M, Sanchez GJ, Parker MH, MacQuarrie KL, Davison J, Morgan MT, Ruzzo WL, et al. Genome-wide MyoD binding in skeletal muscle cells: a potential for broad cellular reprogramming. Dev Cell. 2010;18:662–674. doi: 10.1016/j.devcel.2010.02.014. [DOI] [PMC free article] [PubMed] [Google Scholar]
- Charge SB, Rudnicki MA. Cellular and molecular regulation of muscle regeneration. Physiol Rev. 2004;84:209–238. doi: 10.1152/physrev.00019.2003. [DOI] [PubMed] [Google Scholar]
- Chen B, Han BH, Sun XH, Lim RW. Inhibition of muscle-specific gene expression by Id3: requirement of the C-terminal region of the protein for stable expression and function. Nucleic Acids Res. 1997;25:423–430. doi: 10.1093/nar/25.2.423. [DOI] [PMC free article] [PubMed] [Google Scholar]
- Cheng TC, Tseng BS, Merlie JP, Klein WH, Olson EN. Activation of the myogenin promoter during mouse embryogenesis in the absence of positive autoregulation. Proc Natl Acad Sci USA. 1995;92:561–565. doi: 10.1073/pnas.92.2.561. [DOI] [PMC free article] [PubMed] [Google Scholar]
- Davis RL, Weintraub H, Lassar AB. Expression of a single transfected cDNA converts fibroblasts to myoblasts. Cell. 1987;51:987–1000. doi: 10.1016/0092-8674(87)90585-x. [DOI] [PubMed] [Google Scholar]
- Davis RL, Cheng PF, Lassar AB, Weintraub H. The MyoD DNA binding domain contains a recognition code for muscle-specific gene activation. Cell. 1990;60:733–746. doi: 10.1016/0092-8674(90)90088-v. [DOI] [PubMed] [Google Scholar]
- Deato MD, Marr MT, Sottero T, Inouye C, Hu P, Tjian R. MyoD targets TAF3/TRF3 to activate myogenin transcription. Mol Cell. 2008;32:96–105. doi: 10.1016/j.molcel.2008.09.009. [DOI] [PMC free article] [PubMed] [Google Scholar]
- de la Serna IL, Carlson KA, Imbalzano AN. Mammalian SWI/ SNF complexes promote MyoD-mediated muscle differentiation. Nat Genet. 2001;27:187–190. doi: 10.1038/84826. [DOI] [PubMed] [Google Scholar]
- Elf J, Li GW, Xie XS. Probing transcription factor dynamics at the single-molecule level in a living cell. Science. 2007;316:1191–1194. doi: 10.1126/science.1141967. [DOI] [PMC free article] [PubMed] [Google Scholar]
- Foulds GJ, Etzkorn FA. DNA-binding affinities of MyoD and E47 homo- and hetero-dimers by capillary electrophoresis mobility shift assay. J Chromatogr A. 1999;862:231–236. doi: 10.1016/s0021-9673(99)00923-1. [DOI] [PubMed] [Google Scholar]
- Genetta T, Ruezinsky D, Kadesch T. Displacement of an E-box-binding repressor by basic helix-loop-helix proteins: implications for B-cell specificity of the immunoglobulin heavy-chain enhancer. Mol Cell Biol. 1994;14:6153–6163. doi: 10.1128/mcb.14.9.6153. [DOI] [PMC free article] [PubMed] [Google Scholar]
- Gillespie MA, Le Grand F, Scime A, Kuang S, von Maltzahn J, Seale V, Cuenda A, Ranish JA, Rudnicki MA. p38-{gamma}-dependent gene silencing restricts entry into the myogenic differentiation program. J Cell Biol. 2009;187:991–1005. doi: 10.1083/jcb.200907037. [DOI] [PMC free article] [PubMed] [Google Scholar]
- Grove CA, De Masi F, Barrasa MI, Newburger DE, Alkema MJ, Bulyk ML, Walhout AJ. A multiparameter network reveals extensive divergence between C. elegans bHLH transcription factors. Cell. 2009;138:314–327. doi: 10.1016/j.cell.2009.04.058. [DOI] [PMC free article] [PubMed] [Google Scholar]
- Hajra KM, Chen DY, Fearon ER. The SLUG zinc-finger protein represses E-cadherin in breast cancer. Cancer Res. 2002;62:1613–1618. [PubMed] [Google Scholar]
- Hamamori Y, Wu HY, Sartorelli V, Kedes L. The basic domain of myogenic basic helix-loop-helix (bHLH) proteins is the novel target for direct inhibition by another bHLH protein, Twist. Mol Cell Biol. 1997;17:6563–6573. doi: 10.1128/mcb.17.11.6563. [DOI] [PMC free article] [PubMed] [Google Scholar]
- Hebrok M, Fuchtbauer A, Fuchtbauer EM. Repression of muscle-specific gene activation by the murine Twist protein. Exp Cell Res. 1997;232:295–303. doi: 10.1006/excr.1997.3541. [DOI] [PubMed] [Google Scholar]
- Ishibashi J, Perry RL, Asakura A, Rudnicki MA. MyoD induces myogenic differentiation through cooperation of its NH2- and COOH-terminal regions. J Cell Biol. 2005;171:471–482. doi: 10.1083/jcb.200502101. [DOI] [PMC free article] [PubMed] [Google Scholar]
- Kablar B, Asakura A, Krastel K, Ying C, May LL, Goldhamer DJ, Rudnicki MA. MyoD and Myf-5 define the specification of musculature of distinct embryonic origin. Biochem Cell Biol. 1998;76:1079–1091. [PubMed] [Google Scholar]
- Kataoka H, Murayama T, Yokode M, Mori S, Sano H, Ozaki H, Yokota Y, Nishikawa S, Kita T. A novel snail-related transcription factor Smuc regulates basic helix-loop-helix transcription factor activities via specific E-box motifs. Nucleic Acids Res. 2000;28:626–633. doi: 10.1093/nar/28.2.626. [DOI] [PMC free article] [PubMed] [Google Scholar]
- Khan J, Bittner ML, Saal LH, Teichmann U, Azorsa DO, Gooden GC, Pavan WJ, Trent JM, Meltzer PS. cDNA microarrays detect activation of a myogenic transcription program by the PAX3-FKHR fusion oncogene. Proc Natl Acad Sci USA. 1999;96:13264–13269. doi: 10.1073/pnas.96.23.13264. [DOI] [PMC free article] [PubMed] [Google Scholar]
- Kuang S, Kuroda K, Le Grand F, Rudnicki MA. Asymmetric self-renewal and commitment of satellite stem cells in muscle. Cell. 2007;129:999–1010. doi: 10.1016/j.cell.2007.03.044. [DOI] [PMC free article] [PubMed] [Google Scholar]
- Kumarswamy R, Mudduluru G, Ceppi P, Muppala S, Kozlowski M, Niklinski J, Papotti M, Allgayer H. MicroRNA-30a inhibits epithelial-to-mesenchymal transition by targeting Snai1 and is downregulated in non-small cell lung cancer. Int J Cancer. 2011;130:2044–2053. doi: 10.1002/ijc.26218. [DOI] [PubMed] [Google Scholar]
- Kurrey NK, A K, Bapat SA. Snail and Slug are major determinants of ovarian cancer invasiveness at the transcription level. Gynecol Oncol. 2005;97:155–165. doi: 10.1016/j.ygyno.2004.12.043. [DOI] [PubMed] [Google Scholar]
- Laherty CD, Yang WM, Sun JM, Davie JR, Seto E, Eisenman RN. Histone deacetylases associated with the mSin3 corepressor mediate mad transcriptional repression. Cell. 1997;89:349–356. doi: 10.1016/s0092-8674(00)80215-9. [DOI] [PubMed] [Google Scholar]
- Lluis F, Ballestar E, Suelves M, Esteller M, Munoz-Canoves P. E47 phosphorylation by p38 MAPK promotes MyoD/E47 association and muscle-specific gene transcription. EMBO J. 2005;24:974–984. doi: 10.1038/sj.emboj.7600528. [DOI] [PMC free article] [PubMed] [Google Scholar]
- Ma PC, Rould MA, Weintraub H, Pabo CO. Crystal structure of MyoD bHLH domain-DNA complex: perspectives on DNA recognition and implications for transcriptional activation. Cell. 1994;77:451–459. doi: 10.1016/0092-8674(94)90159-7. [DOI] [PubMed] [Google Scholar]
- McKinnell IW, Ishibashi J, Le Grand F, Punch VG, Addicks GC, Greenblatt JF, Dilworth FJ, Rudnicki MA. Pax7 activates myogenic genes by recruitment of a histone methyltransferase complex. Nat Cell Biol. 2008;10:77–84. doi: 10.1038/ncb1671. [DOI] [PMC free article] [PubMed] [Google Scholar]
- Mitsui K, Shirakata M, Paterson BM. Phosphorylation inhibits the DNA-binding activity of MyoD homodimers but not MyoD-E12 heterodimers. J Biol Chem. 1993;268:24415–24420. [PubMed] [Google Scholar]
- Montgomery RL, Davis CA, Potthoff MJ, Haberland M, Fielitz J, Qi X, Hill JA, Richardson JA, Olson EN. Histone deacetylases 1 and 2 redundantly regulate cardiac morphogenesis, growth, and contractility. Genes Dev. 2007;21:1790–1802. doi: 10.1101/gad.1563807. [DOI] [PMC free article] [PubMed] [Google Scholar]
- Mullen AC, Orlando DA, Newman JJ, Loven J, Kumar RM, Bilodeau S, Reddy J, Guenther MG, DeKoter RP, Young RA. Master transcription factors determine cell-type-specific responses to TGF-beta signaling. Cell. 2011;147:565–576. doi: 10.1016/j.cell.2011.08.050. [DOI] [PMC free article] [PubMed] [Google Scholar]
- Murre C, McCaw PS, Vaessin H, Caudy M, Jan LY, Jan YN, Cabrera CV, Buskin JN, Hauschka SD, Lassar AB, et al. Interactions between heterologous helix-loop-helix proteins generate complexes that bind specifically to a common DNA sequence. Cell. 1989;58:537–544. doi: 10.1016/0092-8674(89)90434-0. [DOI] [PubMed] [Google Scholar]
- Niessen K, Fu Y, Chang L, Hoodless PA, McFadden D, Karsan A. Slug is a direct Notch target required for initiation of cardiac cushion cellularization. J Cell Biol. 2008;182:315–325. doi: 10.1083/jcb.200710067. [DOI] [PMC free article] [PubMed] [Google Scholar]
- Peinado H, Ballestar E, Esteller M, Cano A. Snail mediates E-cadherin repression by the recruitment of the Sin3A/histone deacetylase 1 (HDAC1)/HDAC2 complex. Mol Cell Biol. 2004;24:306–319. doi: 10.1128/MCB.24.1.306-319.2004. [DOI] [PMC free article] [PubMed] [Google Scholar]
- Peinado H, Olmeda D, Cano A. Snail, Zeb and bHLH factors in tumour progression: an alliance against the epithelial phenotype? Nat Rev Cancer. 2007;7:415–428. doi: 10.1038/nrc2131. [DOI] [PubMed] [Google Scholar]
- Perry RL, Rudnicki MA. Molecular mechanisms regulating myogenic determination and differentiation. Front Biosci. 2000;5:D750–D767. doi: 10.2741/perry. [DOI] [PubMed] [Google Scholar]
- Pfaffl MW, Horgan GW, Dempfle L. Relative expression software tool (REST) for group-wise comparison and statistical analysis of relative expression results in real-time PCR. Nucleic Acids Res. 2002;30:e36. doi: 10.1093/nar/30.9.e36. [DOI] [PMC free article] [PubMed] [Google Scholar]
- Porter CJ, Palidwor GA, Sandie R, Krzyzanowski PM, Muro EM, Perez-Iratxeta C, Andrade-Navarro MA. StemBase: a resource for the analysis of stem cell gene expression data. Methods Mol Biol. 2007;407:137–148. doi: 10.1007/978-1-59745-536-7_11. [DOI] [PubMed] [Google Scholar]
- Rudnicki MA, Braun T, Hinuma S, Jaenisch R. Inactivation of MyoD in mice leads to up-regulation of the myogenic HLH gene Myf-5 and results in apparently normal muscle development. Cell. 1992;71:383–390. doi: 10.1016/0092-8674(92)90508-a. [DOI] [PubMed] [Google Scholar]
- Rudnicki MA, Schnegelsberg PN, Stead RH, Braun T, Arnold HH, Jaenisch R. MyoD or Myf-5 is required for the formation of skeletal muscle. Cell. 1993;75:1351–1359. doi: 10.1016/0092-8674(93)90621-v. [DOI] [PubMed] [Google Scholar]
- Sartorelli V, Huang J, Hamamori Y, Kedes L. Molecular mechanisms of myogenic coactivation by p300: direct interaction with the activation domain of MyoD and with the MADS box of MEF2C. Mol Cell Biol. 1997;17:1010–1026. doi: 10.1128/mcb.17.2.1010. [DOI] [PMC free article] [PubMed] [Google Scholar]
- Shih JY, Tsai MF, Chang TH, Chang YL, Yuan A, Yu CJ, Lin SB, Liou GY, Lee ML, Chen JJ, et al. Transcription repressor slug promotes carcinoma invasion and predicts outcome of patients with lung adenocarcinoma. Clin Cancer Res. 2005;11:8070–8078. doi: 10.1158/1078-0432.CCR-05-0687. [DOI] [PubMed] [Google Scholar]
- Soleimani VD, Punch VG, Kawabe Y, Jones AE, Palidwor GA, Porter CJ, Cross JW, Carvajal JJ, Kockx C, van Ijcken W, et al. Transcriptional dominance of pax7 in adult myogenesis is due to high affinity recognition of homeodomain motifs. Dev Cell. 2012;22:1208–1220. doi: 10.1016/j.devcel.2012.03.014. [DOI] [PMC free article] [PubMed] [Google Scholar]
- Song A, Wang Q, Goebl MG, Harrington MA. Phosphorylation of nuclear MyoD is required for its rapid degradation. Mol Cell Biol. 1998;18:4994–4999. doi: 10.1128/mcb.18.9.4994. [DOI] [PMC free article] [PubMed] [Google Scholar]
- Spinner DS, Liu S, Wang SW, Schmidt J. Interaction of the myogenic determination factor myogenin with E12 and a DNA target: mechanism and kinetics. J Mol Biol. 2002;317:431–445. doi: 10.1006/jmbi.2002.5440. [DOI] [PubMed] [Google Scholar]
- Sweetman D, Goljanek K, Rathjen T, Oustanina S, Braun T, Dalmay T, Munsterberg A. Specific requirements of MRFs for the expression of muscle specific microRNAs, miR-1, miR-206 and miR-133. Dev Biol. 2008;321:491–499. doi: 10.1016/j.ydbio.2008.06.019. [DOI] [PubMed] [Google Scholar]
- Tuteja G, White P, Schug J, Kaestner KH. Extracting transcription factor targets from ChIP-Seq data. Nucleic Acids Res. 2009;37:e113. doi: 10.1093/nar/gkp536. http://dx.doi.org/10.1093/nar/gkp536. [DOI] [PMC free article] [PubMed] [Google Scholar]
- von Burstin J, Eser S, Paul MC, Seidler B, Brandl M, Messer M, von Werder A, Schmidt A, Mages J, Pagel P, et al. E-cadherin regulates metastasis of pancreatic cancer in vivo and is suppressed by a SNAIL/HDAC1/HDAC2 repressor complex. Gastroenterology. 2009;137:361–371. doi: 10.1053/j.gastro.2009.04.004. [DOI] [PubMed] [Google Scholar]
- Weintraub H, Genetta T, Kadesch T. Tissue-specific gene activation by MyoD: determination of specificity by cis-acting repression elements. Genes Dev. 1994;8:2203–2211. doi: 10.1101/gad.8.18.2203. [DOI] [PubMed] [Google Scholar]
- Wu WS, Heinrichs S, Xu D, Garrison SP, Zambetti GP, Adams JM, Look AT. Slug antagonizes p53-mediated apoptosis of hematopoietic progenitors by repressing puma. Cell. 2005;123:641–653. doi: 10.1016/j.cell.2005.09.029. [DOI] [PubMed] [Google Scholar]
- Yoshikawa M, Hishikawa K, Marumo T, Fujita T. Inhibition of histone deacetylase activity suppresses epithelial-to-mesenchymal transition induced by TGF-beta1 in human renal epithelial cells. J Am Soc Nephrol. 2007;18:58–65. doi: 10.1681/ASN.2005111187. [DOI] [PubMed] [Google Scholar]
- Zhang Y, Liu T, Meyer CA, Eeckhoute J, Johnson DS, Bernstein BE, Nussbaum C, Myers RM, Brown M, Li W, et al. Model-based analysis of ChIP-Seq (MACS) Genome Biol. 2008;9:R137. doi: 10.1186/gb-2008-9-9-r137. http://dx.doi.org/10.1186/gb-2008-9-9-r137. [DOI] [PMC free article] [PubMed] [Google Scholar]
Associated Data
This section collects any data citations, data availability statements, or supplementary materials included in this article.