

Abstract
This study applied innovative data mining techniques to a community survey dataset to develop prediction models for two aspects of physical activity (active transport and screen time) in sample of older, primarily Hispanic, urban adults (N=2, 514). Main predictors for active transport (accuracy=69.29%, precision .67, recall .69) were immigrant status, high level of anxiety, having a place for physical activity, and willingness to make time for physical activity. The main predictors for screen time (accuracy=63.13%, precision .60, recall .63) were willingness to make time for exercise, having a place for exercise, age, and availability of family support to look up health information on the Internet. Data mining methods were useful to identify intervention targets and inform design of customized interventions.
Introduction
Physical activity is critical for older adults to reduce risks of cardiovascular disease, metabolic syndrome, cancer, mental disease and fall injuries. Despite its benefits, achieving adequate physical activity is challenging for older adults. Eight out of ten (79.6%) of older adults did not meet the national guidelines for physical activity in the United States in 2013 as compared to 52.6% a decade earlier (Center for Disease Control and Prevention, 2013).
The number of older adults is expected to grow from the current 43.1 million to 79.7 million in 2040 (U.S. Department of Health and human Services, 2012) highlighting the increasing importance of promoting physical activity. Evidence-based interventions targeting psychological, interpersonal and environmental correlates have the potential to influence physical activity behavior (Bauman et al., 2012).
Innovative strategies are required to discover specific targets of intervention for older adults and to aid in the design of appropriate physical activity interventions. Data mining, a set of analytical techniques for discovery, classification and prediction, has the potential to offer such insights. As compared to traditional statistical approaches, it offers several advantages for identifying intervention targets and strategies. These include application of algorithms to identify strongest predictors among hundreds of variables simultaneously, creation of categories and refined cut-off values for a large number of variables, and providing optimized criteria for customized intervention targets (e.g., refined age groups). To examine this potential, our study applied data mining techniques to a dataset gathered through a community survey as part of the Washington Heights/Inwood Informatics Infrastructure for Comparative Effectiveness Research (WICER) project.
Methods
Conceptual Framework
The social-ecological framework explicates four levels of factors (individual, interpersonal, environmental and global level) that affect physical activity behavior (Bronfenbrenner, 1994). Furthermore, the need to target the four levels in the design of physical activity interventions has been emphasized in systematic reviews (Bauman, Sallis, Dzewaltowski, & Owen, 2002). Thus, this framework guided identification of research questions, selection of variables in the modeling phase of data mining process and interpretation of results.
Study Design, Setting, Sample and Human Subjects Protection
A cross-sectional survey design was used for answering two research questions: 1) What is the level of physical activity among older urban adults? and 2) What are the predictors of physical activity among older urban adults? The study sample comprised English or Spanish speaking adults, 55 years and older living in New York City. Participants were recruited using a combination of probability, convenience and snowball sampling (i.e., asking for referrals to family and friends) strategies from March 2011 to November 2012. Bilingual community health workers collected survey data through individual interviews, 45–60 minutes in length, in English or Spanish. Participants received $25 as grocery vouchers, movie tickets or metro card as compensation for their time. The Columbia University Medical Center Institutional Review Board approved the study protocol. Written informed consent was obtained from each participant prior to the data collection. Data were entered via a web-based data entry program and stored in a secure, project-specific REDCap database hosted at Columbia University (Harris et al., 2009).
Measures
The WICER survey included objective physiological measures (blood pressure, height, weight, waist circumference) along with wide range of standardized self-report measures that served as predictors in the analysis. Standardized self-report measures included anxiety, depression, sleep disturbance from the Patient Reported Outcomes Measurement Information System ([PROMIS] (Pilkonis et al., 2011); health information seeking behaviors from the Health Information National Trends Survey (HINTS) (National Cancer Institute, 2007); Center for Epidemiologic Studies Depression (CES-D) (Radloff, 1977); Perceived Stress Scale (PSS) (Cohen, Kamarck, & Mermelstein, 1983); Neighborhood Trust and Cohesion (NTC) (Garcia, Taylor, & Lawton, 2007); Newest Vital Sign (NVS) for health literacy (Weiss et al., 2005); and Patient Heath Questionnaire-9 (PHQ-9 depression) (Spitzer, Kroenke, & Williams, 1999). For more details on the measures related to the 925 initial variables see (online supplement table 1). Physical activity was operationalized by two survey items that served as dependent variables in the analysis. Active transport (⩾30 minutes /week) was calculated from the question “over the past 30 days, have you walked or bicycled as part of getting to and from work, or school, or to do errands?” Screen time (>3 hours daily) was calculated from the question “over the past 30 days, on a typical day how much time did you spend sitting and watching TV or videos outside of work?”
Analysis
We extracted survey data for adults 55 years and older from REDCap. Data were summarized using descriptive statistics. The data mining processes comprised five steps that were executed using Weka software v 3.6 (http://www.cs.waikato.ac.nz/ml/weka/): 1) prime filtering, 2) secondary filtering, 3) feature selection, 4) iterative modeling, and 5) selecting final models (Figure 1) (Witten, Frank, & Hall, 2011). First, during prime filtering a domain expert (SY) - guided by the social-ecological framework and factors relevant to physical activity- filtered out variables with substantial numbers of missing values and selected 177 of 925 variables as relevant. Second, in the secondary filtering process we applied a data mining algorithm, i.e., a set of heuristics and calculations used to identify a model or patterns from data, to remove additional variables whose distributions suggested that they would not be useful in the analysis; this resulted in 156 variables. Third, in feature selection, we applied another data mining algorithm (Hall M., 2009), to select predictor variables that were strongly related to each dependent variable (14 variables for active transport, 11 variables for screen time). Fourth, during the iterative modeling process, we applied a third data mining algorithm which randomly divides data into two data sets (one for building models and another for evaluating the models) and iteratively generated models (Hall M., 2009). Fifth, in the final step, we selected our final models based on the strength of the relationships between the predictors and dependent variables, i.e., which models most accurately classified the participants according to values on active transport and screen time, and the clinical meaningfulness of variables.
Figure 1.
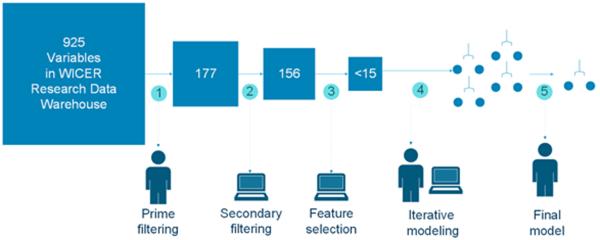
Illustration of data mining process to build prediction models for physical activity using WICER dataset
Results
Characteristics of Study Population
Study participants (N=2,514), age 55–100, were primarily of Hispanic origin, retired, immigrants, single with education levels of a high school diploma or less, had fair to excellent self-rated health, and had low levels of physical activity (Table 1). More than half perceived themselves as overweight.
Table 1.
Descriptive Statistics for Study Variables (n=2,514)
| Individual level factors | Mean | SD | Range |
| Age | 65.3 | 7.9 | [55–100] |
| Anxiety † | 49.1 | 10.4 | [40.3–81.6] |
| Depression † | 49.6 | 10.2 | [41–79.4] |
| Sleep disturbance † | 52.1 | 5.4 | [32–68.8] |
| Pain days in past 30 days | 4.0 | 8.5 | [0–30] |
| Years living in US | 31 | 17.8 | [0–82] |
| N | % | ||
| Immigrant | 2412 | 95.9 | |
| Gender: female | 1839 | 73.2 | |
| Hispanic origin | 2438 | 97.0 | |
| Race | |||
| American Indian/Alaska Native | 6 | 0.2 | |
| Asian | 2 | 0.1 | |
| Black/African American | 176 | 7.0 | |
| White/Caucasian | 439 | 17.5 | |
| Other* | 1253 | 49.8 | |
| High likelihood or possibly of limited literacy‡ | 1921 | 76.4 | |
| Education: High school or less | 2100 | 83.5 | |
| Self-report health status excellent to fair | 2348 | 93.4 | |
| Hypertension | 1595 | 63.4 | |
| History of heart attack, stroke, kidney disease or cancer | 280 | 11.1 | |
| Been told by health providers that they had mental illness | 732 | 29.1 | |
| Perceived overweight | 1341 | 53.3 | |
| Willing to make time for physical activity | 1571 | 62.5 | |
|
| |||
| Interpersonal level factors | |||
| Marital status: single, widowed, divorced | 1619 | 64.4 | |
| Family support to use internet to look up health info | 225 | 8.9 | |
| Mean | SD | Range | |
| Social role performance † | 51.8 | 8.1 | [26.9–66.1] |
|
| |||
| Environmental factors | N | % | |
| Easy to get to the places for physical activity | 1592 | 63.3 | |
| Have a place for physical activity | 1515 | 60.3 | |
|
| |||
| Structural and organizational factors | |||
| Cost barriers for physical activity | 1287 | 51.2 | |
| Insurance: private | 86 | 3.4 | |
| Medicare, Medicaid | 2131 | 84.8 | |
|
| |||
| Physical activity | |||
| Screen time: Watching TV or video > 3 hrs/day | 911 | 36.2 | |
| Active transport: Walking to work, school, errands ≥ 30 min/week | 615 | 26.2 | |
| Moderate physical activity ≥ 90 min/week | 126 | 5.0 | |
| Vigorous physical activity ≥ 30 min/week | 92 | 3.7 | |
Patient Reported Outcomes Measurement Information System,
Newest Vital Sign; missing data <1.5% except for family support to look up information on the Internet (5.8%) and PROMIS anxiety score (34. 3%)
Most respondents reported ethnicity (e.g., Hispanic) or country or origin (e.g., Dominican Republic) rather than race
Physical Activity Level
Few participants reported moderate (5.0%) or vigorous physical activity (3.7%) on a weekly basis. Less than 30% met the study's operational definition of active transport: Walking to work, school, errands ≥ 30 minutes/week. In contrast, 36.2% met the criterion for excess screen time: Watching TV or video > 3 hours/day.
Predictors
Active Transport
The sample size for the active transport data mining processes comprised 2,343 individuals who had valid answers for the variable (yes; n=615, 26.3%, no; n=1728, 73.8%). Immigration status (born in or outside of the U.S.), having a place for exercise, anxiety level, and willingness to make time for physical activity were the main predictors for classifying participants on active transport with 69.29% accuracy (precision .67, recall .69, F-measure= .57) (Figure 2 top). Immigrants were less likely to engage in active transport than non-immigrants and there were no modifiable factors identified for immigrants. Among non-immigrants who had a place for exercise, those with PROMIS anxiety scores greater than 65.3 (i.e., higher anxiety levels) were more likely to engage in active transport. Among non-immigrants without a place for physical activity, willingness to make time for physical activity was associated with increased likelihood of engaging in active transport.
Figure 2.

Prediction models for physical acthity: active transport (top) and screen time (bottom). *Modifiable factors in color.
Screen Time: Sitting and Watching TV or Videos
The sample size for the screen time data mining processes comprised 2,430 individuals (⩽3 hours daily n=1,519, 62.5%, >3hours daily n=911, 37.5%). The modifiable factors of willingness to make time for exercise, age, having a place for exercise, and availability of family support to look up health information on the Internet were the main predictors for classifying participants according to screen time with 63.13% accuracy (precision .60, recall .63, F-measure= .54) (Figure 2 bottom). Among those unwilling to make time for physical activity, participants less than 77 years of age as compared to those older were more likely to have shorter TV or video time. Among those with willing to make time and having a place for physical activity, participants less than 71 years of age and old with family support to look up information on the Internet were more likely to have shorter TV or video time; this was not true for those over 71 years of age without family support to look up information on the Internet.
Discussion
Although the study sample was fairly healthy (93.4% excellent to fair general heath, 11.1% serious disease comorbidity), the levels of physical activity were low and more than one third of the participants reported sitting and watching TV three or more hours daily. This study supports the need for a shift in physical activity goals to reduce sedentary time and promote light activities among older adults, which may be more realistic than intense exercise (Sparling, Howard, Dunstan, & Owen, 2015).
The models for active transport and screen time shared the modifiable predictors of having a place for exercise and willingness to make time for exercise, but there were also important distinctions between the models. For active transport, the strongest predictor was immigrant status, a non-modifiable factors, and the great majority of participants were immigrants. The literature suggests that immigrants can be targeted for a physical activity programs to increase active transport behavior (Jenum et al., 2006; Tovar et al., 2014), but our study did not identify any modifiable factors that could serve as specific physical activity intervention targets. Having a place for exercise was the strongest modifiable predictor among the small proportion of non-immigrants in our sample. The importance of having a place for exercise has been emphasized in literature. In fact, some health insurance plans have started offering free or low cost access to gym or exercise programs for seniors (Bethancourt, Rosenberg, Beatty, & Arterburn, 2014) and local health departments support programs such as `BeFitNYC' (NYC's source for free and low-cost fitness activities (www.nycgovparks.org/befitnyc) for seniors. PROMIS anxiety score over 65.3 was a predictor for active transport among the non-immigrants who had a place for exercise. The role of psychological factors, such as anxiety, on physical activity behavior have been understudied (less than 5% of physical activity studies) (Bauman et al., 2012). Further, given the small sample (n=43), this finding should be interpreted cautiously and explored in future studies.
In contrast, for screen time, willingness to make time for exercise, a modifiable factor, was the strongest predictor. Willingness to make time for exercise is a novel finding for Hispanics. A large body of literature has been focusing on `time' as a barrier for physical activity rather than a persons' willingness to make time. Considering the abrupt decrease trend of leisure-time physical activity among Hispanics (Gallagher, Yancy, Denissen, Kuhnel, & Voils, 2013), our findings highlight the need for future research on this aspect of time.
The non-modifiable factor of age was a strong predictor for screen time, but not active transport, regardless of whether or not the participant had a place to exercise. This suggests that interventions aimed at decreasing screen time should consider age and that special interventions may be needed for adults above 71 years of age.
Data mining techniques allowed us to investigate and to represent relations among individual, interpersonal, environmental, and structural level factors simultaneously and efficiently. The models were able to correctly classify participants with 69.29% accuracy for active transport, and 63.13% accuracy for screen time and are considered reasonable for the behavioral domain (Olson & Delen, 2008). Moreover, the findings compare favorably with the findings of physical activity studies that used logistic regression while having the advantage of more clearly defining subgroups for targeted intervention.
Despite its significant strengths, this study also has several limitations. First, the convenience sample is not representative of the population. Second, while standardized self-report measures of many phenomena included as variables in the analysis have strong support for reliability and validity, self-reports of physical activity may under- or over-estimate actual levels. Third, while the term prediction is used to describe the factors influencing physical activity, it is not intended to imply causality.
Conclusion
Data mining methods are useful for domain experts to build prediction models for physical activity among older urban adults. Interventions designed to address modifiable factors at the individual and environmental levels as well as interventions targeted to particularly vulnerable populations - immigrants and those in their 70s and older - are urgently needed. Results of this study can provide insights for intervention design to improve physical activity behavior among older urban adults.
Supplementary Material
Acknowledgement
This study was supported by Agency for Healthcare Research and Quality grants WICER (R01HS019853, PI: Bakken) and WICER4U (R01HS022961, PI: Bakken).
References
- Bauman AE, Reis RS, Sallis JF, Wells JC, Loos RJ, Martin BW, Lancet Physical Activity Series Working, G. Correlates of physical activity: why are some people physically active and others not? Lancet. 2012;380(9838):258–271. doi: 10.1016/S0140-6736(12)60735-1. doi: 10.1016/S0140-6736(12)60735-1. [DOI] [PubMed] [Google Scholar]
- Bauman AE, Sallis JF, Dzewaltowski DA, Owen N. Toward a better understanding of the influences on physical activity: the role of determinants, correlates, causal variables, mediators, moderators, and confounders. Am J Prev Med. 2002;23(2 Suppl):5–14. doi: 10.1016/s0749-3797(02)00469-5. [DOI] [PubMed] [Google Scholar]
- Bethancourt HJ, Rosenberg DE, Beatty T, Arterburn DE. Barriers to and facilitators of physical activity program use among older adults. Clin Med Res. 2014;12(1–2):10–20. doi: 10.3121/cmr.2013.1171. doi: 10.3121/cmr.2013.1171. [DOI] [PMC free article] [PubMed] [Google Scholar]
- Bronfenbrenner U. Ecological Models of Human Development. Vol. 3. Elsevier; Oxford: 1994. [Google Scholar]
- Center for Disease Control and Prevention Prevalence and Trends Data: Behavioral Risk Factor Surveillance System. 2013 from http://apps.nccd.cdc.gov/brfss/
- Cohen S, Kamarck T, Mermelstein R. A global measure of perceived stress. J Health Soc Behav. 1983;24(4):385–396. [PubMed] [Google Scholar]
- Eyler AE, Wilcox S, Matson-Koffman D, Evenson KR, Sanderson B, Thompson J, Rohm-Young D. Correlates of physical activity among women from diverse racial/ethnic groups. J Womens Health Gend Based Med. 2002;11(3):239–253. doi: 10.1089/152460902753668448. doi: 10.1089/152460902753668448. [DOI] [PubMed] [Google Scholar]
- Gallagher P, Yancy WS, Jr., Denissen JJ, Kuhnel A, Voils CI. Correlates of daily leisure-time physical activity in a community sample: Narrow personality traits and practical barriers. Health Psychol. 2013;32(12):1227–1235. doi: 10.1037/a0029956. doi: 10.1037/a0029956. [DOI] [PubMed] [Google Scholar]
- Garcia RM, Taylor RB, Lawton BA. Impacts of violent crime and neighborhood structure on trusting your neighbors. Justice Quarterly. 2007;24(4):679–704. doi: Doi 10.1080/07418820701717169. [Google Scholar]
- Hall M, F. E., Holmes G, et al. SIGKDD explorations. 2009. The weka data mining software: An update. [Google Scholar]
- Harris PA, Taylor R, Thielke R, Payne J, Gonzalez N, Conde JG. Research electronic data capture (REDCap)--a metadata-driven methodology and workflow process for providing translational research informatics support. J Biomed Inform. 2009;42(2):377–381. doi: 10.1016/j.jbi.2008.08.010. doi: 10.1016/j.jbi.2008.08.010. [DOI] [PMC free article] [PubMed] [Google Scholar]
- Jenum AK, Anderssen SA, Birkeland KI, Holme I, Graff-Iversen S, Lorentzen C, Bahr R. Promoting physical activity in a low-income multiethnic district: effects of a community intervention study to reduce risk factors for type 2 diabetes and cardiovascular disease: a community intervention reducing inactivity. Diabetes Care. 2006;29(7):1605–1612. doi: 10.2337/dc05-1587. doi: 10.2337/dc05-1587. [DOI] [PubMed] [Google Scholar]
- National Cancer Institute Health Information National Trends Survey (HINTS) SurveyInstruments. 2007 http://hints.cancer.gov/instrument.aspx.
- Olson DL, Delen D. Advanced Data Mining Techniques. 1st edition. Springer; Feb 1, 2008. p. 138. 2008. [Google Scholar]
- Pilkonis PA, Choi SW, Reise SP, Stover AM, Riley WT, Cella D, Group PC. Item banks for measuring emotional distress from the Patient-Reported Outcomes Measurement Information System (PROMIS(R)): depression, anxiety, and anger. Assessment. 2011;18(3):263–283. doi: 10.1177/1073191111411667. doi: 10.1177/1073191111411667. [DOI] [PMC free article] [PubMed] [Google Scholar]
- Radloff LS. The CES-D scale: A self report depression scale for research in the general population. Applied Psychological Measurement. 1977;1:385–401. [Google Scholar]
- Sparling PB, Howard BJ, Dunstan DW, Owen N. Recommendations for physical activity in older adults. BMJ. 2015;350:h100. doi: 10.1136/bmj.h100. doi: 10.1136/bmj.h100. [DOI] [PubMed] [Google Scholar]
- Spitzer RL, Kroenke K, Williams JB. Validation and utility of a self-report version of PRIME-MD: the PHQ primary care study. Primary Care Evaluation of Mental Disorders. Patient Health Questionnaire. JAMA. 1999;282(18):1737–1744. doi: 10.1001/jama.282.18.1737. [DOI] [PubMed] [Google Scholar]
- Tovar A, Boulos R, Sliwa S, Must A, Gute DM, Metayer N, Economos C. Baseline Socio-demographic characteristics and self-reported diet and physical activity shifts among recent immigrants participating in the randomized controlled lifestyle intervention: “Live Well”. J Immigr Minor Health. 2014;16(3):457–465. doi: 10.1007/s10903-013-9778-8. doi: 10.1007/s10903-013-9778-8. [DOI] [PMC free article] [PubMed] [Google Scholar]
- U.S. Department of Health and human Services A profile of older americans. 2012 Retrieved from http://www.aoa.gov/Aging_Statistics/Profile/2012/4.aspx.
- Weiss BD, Mays MZ, Martz W, Castro KM, DeWalt DA, Pignone MP, Hale FA. Quick assessment of literacy in primary care: the newest vital sign. Ann Fam Med. 2005;3(6):514–522. doi: 10.1370/afm.405. doi: 10.1370/afm.405. [DOI] [PMC free article] [PubMed] [Google Scholar]
- Witten IH, Frank E, Hall MA. Data mining : practical machine learning tools and techniques. 3rd ed. Morgan Kaufmann; Burlington, MA: 2011. [Google Scholar]
Associated Data
This section collects any data citations, data availability statements, or supplementary materials included in this article.