

Abstract
Background
Inflammatory and immune responses triggered by brain ischemia worsen clinical outcomes of stroke and contribute to hemorrhagic transformation, massive edema and reperfusion injury associated with intravenous alteplase. We assessed whether a combination of the immune-modulator fingolimod and alteplase is safe and effective in attenuating reperfusion injury in patients with acute ischemic stroke (AIS) treated within the first 4.5 hours of symptom onset.
Methods and Results
In this multi-center trial, we randomly assigned 25 eligible patients with hemispheric ischemic stroke stemming from anterior or middle cerebral arterial occlusion to receive alteplase alone or 22 patients to receive alteplase plus oral fingolimod 0.5 mg daily for three consecutive days within 4.5 hours of the onset of ischemic stroke. Compared with patients who received alteplase alone or patients who received combination of fingolimod with alteplase exhibited lower circulating lymphocytes, smaller lesion volumes (10.1 vs 34.3 ml, P = 0.04), less hemorrhage (1.2 vs 4.4 ml, p = 0.01) and attenuated neurodeficits in National Institute of Health Stroke Scales (4 vs 2, P =0.02) at day 1. Furthermore, restrained lesion growth from day 1 to day 7 (−2.3 vs 12.1 ml, P < 0.01) with a better recovery at day 90 (modified Rankin Scale 0-1, 73% vs 32%, P < 0.01) was evident in patients given fingolimod and alteplase. No serious adverse events were recorded in all patients.
Conclusions
In this pilot study, combination therapy of fingolimod and alteplase was well tolerated, attenuated reperfusion injury and improved clinical outcomes in AIS patients. These findings need to be tested in further clinical trials.
Keywords: cerebral infarction, thrombolysis, hemorrhage, edema, inflammation
Introduction
Ischemic stroke is a major cause of death and disability. Alteplase, a recombinant tissue plasminogen activator(rtPA) , is still the only approved medication for administration within 3 to 4.5 hours for patients undergoing an acute ischemic stroke (AIS).1 However, reperfusion injury, including hemorrhagic transformation or massive edema can accompany alteplase administration; 2,3 therefore, the use of this thrombolytic therapy can become a dilemma, particularly for patients with large infarct.
The high incidence of spontaneous hemorrhagic transformation in AIS patients has been documented, ranging from 38% to 71% in autopsy studies and from 13% to 43% in clinical trials.4,5 Notably, alteplase-treated stroke patients have a 10-fold higher risk of suffering an intracranial hemorrhage than untreated patients.3 Hemorrhagic transformation after thrombolysis is generally an early event (<24 hours), as documented in the NINDS rtPA trial, in which all fatal parenchymal hemorrhages occurred in this time period, with 80% occurring within 12 hours of treatment delivery.3 In addition, the patients’ brain water content also rises due to vasogenic edema that occurs within 1 to 4 hours of stroke onset, peaks between day 3 to 8 and vanishes at day 30.6-9 Such edema enlarges lesion volume in 10% of ischemic strokes, evoking the malignant middle cerebral artery occlusion syndrome. Severe edema and mass effect are associated with an up to an 80% mortality rate in malignant middle cerebral artery occlusion. 10
Brain ischemia and reperfusion activate the immune system. This abrupt and massive influx of lymphocytes from the periphery into the ischemic region orchestrates a focal inflammatory response, further disrupts the blood-brain barrier (BBB) and worsens the clinical outcomes of these patients. Early BBB disruption and pronounced inflammatory response elicited by ischemia and cell death play a critical role in lesion enlargement, hemorrhagic transformation and vasogenic edema.7,11 In addition, inflammation promotes hemorrhagic transformation and vasogenic edema as well as worsening reperfusion injury associated with the use of alteplase within 4.5 hours after ischemic stroke begins. 12-14 Therefore, we hypothesize that suppression of inflammation might not only attenuate immune-mediated brain damage as a monotherapy, but also would be a fitting complement to reperfusion thrombolytic therapy. Fingolimod is a sphingosine analog that acts on sphingosine-1-phosphate receptors. It was approved by the FDA in 2010 as the first oral disease-modifying therapy for the relapsing-remitting form of multiple sclerosis.15 Fingolimod inhibits the egress of lymphocytes from lymph nodes and limits their recirculation.16 Additional effects on the integrity of BBB and direct action on neurons and glia that bear S1PR may also contribute to its beneficial attributes in multiple sclerosis.17-19 Recently, the safety and efficacy of fingolimod in both intracerebral hemorrhage (ICH) and AIS patients have been investigated in proof-of-concept trials.20,21 In ICH, fingolimod treatment for 72 hours produced short term and long term clinical benefits as well as limiting the expansion of perihematomal edema. 20 In patients with acute anterior circulation occlusion, who are later than 4.5 hours after disease onset and otherwise ineligible for alteplase, fingolimod significantly improved the clinical outcome, reduced secondary lesion growth and decreased microvascular permeability.21 However, the safety and efficacy of early treatment with fingolimod in AIS patients eligible for alteplase (<4.5 hours after initial onset) are not known. The aim of this study was to investigate the safety and preliminary impact of co-administration of fingolimod with alteplase on clinical outcomes, hemorrhagic transformation and magnitude of edema in AIS patients.
Methods
Study design and patients
This randomized, open-label, evaluator-blind, multicenter pilot trial was performed between 2013 and 2015 at three stroke centers in Tianjin, China. Enrollment included 47 patients with first-ever hemispheric ischemic stroke, ages 18-80 and > 5 on NIHSS score. Exclusion criteria were patients with (1) standard contraindications to alteplase; (2) evidence of other diseases of the CNS; (3) pre-existing neurologic disability (a score greater than 2 on the modified Rankin Scale -mRS); (4) swallowing difficulties (defined by bedside dysphagia evaluation); (5) patients with any history of bradyarrhythmia or atrioventricular blocks; (6) concomitant use of antineoplastic, immunosuppressive or immune- modulating therapies; (7) macular edema. In addition, we used specific selection criteria for this trial that were based on the results of MRI imaging. The MRA inclusion criterion was the presence of intracranial occlusion in the anterior cerebral or middle cerebral artery. Patients with internal-carotid-artery and vertebrobasilar artery occlusions were excluded due to safety and variability concern.
Patients were randomly assigned in a 1:1 ratio to receive either the standard dose of alteplase (0.9 mg per kg, the first 10% administered as an initial bolus and the remainder over a 1-hour period, with a maximum dose of 90 mg) or the standard dose of alteplase plus fingolimod (Gilenya, Novartis). Each patient in the fingolimod plus alteplase group was given 0.5 mg of fingolimod orally once daily, for three consecutive days, with the first dose being given before alteplase administration (Figure 1). Randomization was performed by means of a coin toss by the clinicians who administrated fingolimod for the eligible patients (Z. Z., D.T. and Y. D.). The treating clinician was aware of the treatment assignments. Written informed consent was provided by the patients or their health care proxies. The study protocol and informed consent procedures were approved by the institutional review board at each participating center. This study is registered with ClinicalTrials.gov, number: NCT02002390.
Figure 1.
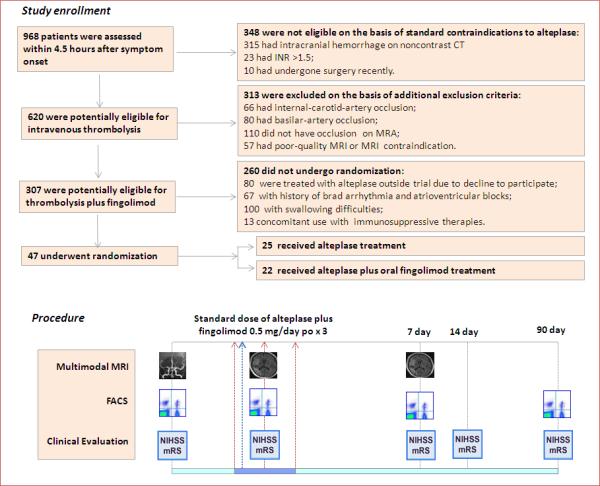
Study flow chart. A total of 968 patients with stroke-like symptoms underwent screening within 4.5 hours after symptom onset. The 620 patients potentially eligible for intravenous thrombolysis were further screened for participation in the study. 47 patients were randomly assigned in a 1:1 ratio to the standard dose of alteplase (0.9 mg per kg, the first 10% administered as an initial bolus and the remainder over a 1-hour period, with a maximum dose of 90 mg); or to the standard dose of alteplase immediately following the 1st dose of oral fingolimod (0.5 mg of FTY720 (Gilenya, Novartis). Fingolimod was administered once daily, for three consecutive days. Counts of circulating lymphocyte subsets were monitored by flow cytometry. Clinical assessments (NIHSS, mRS) were conducted at the indicated time points. Alterations of MRA status, lesion volume and hemorrhage volume were measured on MRI at the indicated time points.
Procedures
FACS assessments
The kinetics of lymphocyte subset alteration were monitored in whole-blood samples from all fingolimod- treated patients at the baseline, which preceded the first dose, and at day 1, day 7 and day 90 after the first dose for comparison with untreated patients at the same time points. Mononuclear cells were isolated from the whole-blood specimens and stained with antibodies to CD4-FITC, CD8-PE, CD19-PerCP, CD56-PE (BD Biosciences, Franklin Lakes, NJ, USA). Data were acquired using a FACSCalibur (Becton Dickinson Immunocytometry Systems, San Jose, CA, USA) and analyzed with Flow Jo software (Tree Star, Ashland, OR, USA).
Clinical assessments
Patients’ demographics and risk-factor characteristics were recorded. Hypertension was defined as systolic blood pressure greater than 140 mm Hg and/or diastolic blood pressure greater than 90 mm Hg; diabetes was defined as a fasting plasma glucose greater than or equal to 7.0 mmol/L and/or plasma glucose two hours after a meal greater than or equal to 11.1 mmol/L. Hyperlipidemia was defined as a serum total cholesterol levels greater than 5.72 mmol/L and/or triglycerides more than 1.7 mmol/L. Clinical assessments were performed by neurologists (X. X., Y. F. and N. S.) upon patients’ enrollment, at the time points when alteplase was given and on days 1, 7, 14 and 90 afterward in an evaluator-blinded fashion (Figure 1). The extent of neurologic deficit was evaluated by NIHSS. Recovery outcomes at 90 days were assessed with mRS.
Imaging protocol
Noncontrast CT imaging was performed to exclude cerebral hemorrhage in patients prior enrollment. For MRIs, 1.5 or 3 T scanners were used on day 1 and day 7, with a comprehensive acute stroke MRI protocol adopted by all three study centers. These include diffusion weighted imaging (DWI), perfusion weighted imaging (PWI), gradient-echo imaging (GRE), as well as MRA, the mean time for scanning is 15 minutes. Reviews of MRI images were performed at a clinical imaging workstation with the use of instrument-specific proprietary software. The image analysis was performed by the treating stroke neurologists, all of whom had experience in the evaluation of MRIs. Paired baseline and 24 hour MRA were graded using adapted Thrombolysis in Myocardial Infarction (TIMI) criteria,22 with vessel occlusion status classified as complete, minimal flow, partial flow, or normal. Recanalization was defined as normal flow or improvement in flow on day 1, no recanalization was defined as no improvement in flow. Each baseline site of occlusion was also recorded, with middle cerebral artery occlusions being sub-classified according to the most proximal segment occluded (terminal internal carotid artery, proximal-first segment, mid-first segment, distal-first segment, or second segment).
With regard to the type of hemorrhage, such transformation can be divided into hemorrhagic infarction and parenchymal hematoma defined as signal loss on GRE imaging. Petechial hemorrhagic transformation was defined as punctate areas of signal loss within the stroke bed on GRE imaging without any significant mass effect or intraventricular extension. Parenchymal hematoma was defined as a homogeneous, confluent area of signal loss with mass effect and/or intraventricular extension.23 Symptomatic intracranial hemorrhage was defined as a large parenchymal hematoma combined with a significant clinical deterioration of ≥4 points on the NIHSS.
Changes of lesion volume were measured on DWI (baseline) and Flair (day 1, day 7), and hemorrhage volume was measured on GRE (day 1). Measurements were performed independently by two blinded neuroradiologists (W.H. and Y.F.) using MIPAV software. Lesion volume and hemorrhage volume were manually outlined on the DWI, Flair and GRE slices and then automatically calculated for each slice from the measured area and corresponding slice thickness.
Outcomes
The primary outcomes were changes in lesion volume from baseline (DWI) to day 1 (Flair), the hemorrhage volume (GRE) at day 1 and extent of clinical improvement at day 1, as measured by the changes on the NIHSS score from baseline to day 1. Secondary outcomes were the extent of lesion volume growth from day 1 to day 7, extent of clinical improvement from day 1 to day 7 and the probability of excellent recovery at day 90 (defined as a score of 0 or 1 on the mRS).
Statistical analysis
Before the completion of the study, a biostatistician developed the statistical analysis plan to test the prespecified trial hypotheses defined in the protocol. The primary hypothesis was that a comparison between the alteplase group and the fingolimod plus alteplase group would show the superiority of fingolimod plus alteplase with respect to one or more primary outcomes (change in lesion volume at day 1, hemorrhage volume at day 1 or NIHSS change at day 1). An alpha level of 0.05 was prespecified for each of the three primary end points. We calculated the sample size for the current study on the basis of our pilot study,21 with the power set at 80% and an assumption of superiority with respect to one of the three primary outcomes, at an alpha level of 0.05.
SPSS for Windows version 17.0 software (SPSS, Inc, Chicago, IL, USA) was used for the analysis. For continuous variables such as age and lesion volumes, descriptive statistics were calculated and reported as means ± SE. All continuous variables for the fingolimod plus alteplase group were compared with the alteplase-only group using the t-test. The parameters which were non-normally distributed or discontinuous variables (e. g., NIHSS, mRS) were reported as median (range) and compared as groups using a Mann-Whitney test. Categorical variables were compared for the groups using the Chi-squared test (Fisher's exact test when the expected value is < 5).
Results
Baseline characteristics of patients
Figure 1 shows the screening profile of the trial. Between 2013 and 2015, a total of 620 patients potentially eligible for intravenous thrombolysis underwent screening within 4.5 hours after symptom onset. Of these patients, 47 (8%) were enrolled in the study. Patients with internal-carotid-artery occlusion, basilar-artery occlusion, an absence of intracranial vessel occlusion or dysphagia were excluded from the study. The median (range) NIHSS score at baseline for all enrolled patients was 12 (6-22). Of the 47 enrolled patients, 25 were randomly assigned to the alteplase group (treated with alteplase only) and 22 were assigned to the fingolimod plus alteplase group (treated with alteplase plus fingolimod). Most baseline clinical characteristics were well matched among the two groups, except the fingolimod plus alteplase group included more persons who had atrial fibrillation (P = 0.030; Table 1). Patients in the control group received treatment at a mean of 3.0 hours, as compared with 3.1 hours for those in the fingolimod-treated groups (P = 0.73). There were no significant differences in the sites of occlusion at baseline (P = 0.29) or infarct volumes (P = 0.90) at baseline among the groups.
Table 1.
Characteristics of the Patients at Baseline
| Characteristic | Alteplase (N =25) | Fingolimod + Alteplase (N = 22) | P value |
|---|---|---|---|
| Age, year | 59.0 ± 1.6 | 60.0 ± 2.5 | 0.66 |
| Male sex, n (%) | 17 (68) | 13 (59) | 0.56 |
| Hypertension, n (%) | 13 (52) | 11(50) | 1.00 |
| Diabetes mellitus, n (%) | 2 (8) | 1 (5) | 1.00 |
| Blood glucose, mmol/L | 6.5 ± 0.6 | 7.0 ± 0.7 | 0.59 |
| Hyperlipidemia, n (%) | 12 (48) | 8 (36) | 0.56 |
| Atrial fibrillation, n (%) | 2 (8) | 8 (36) | 0.03 |
| Current smoking, n (%) | 16 (64) | 11 (50) | 0.39 |
| Antiplatelet agent, n (%) | 6 (24) | 8 (36) | 0.52 |
| Anticoagulant, n (%) | 1 (4) | 1 (5) | 1.00 |
| INR | 1.0 ± 0.1 | 1.0 ± 0.1 | 0.66 |
| BP systolic, mm Hg | 144 ± 4 | 139 ± 6 | 0.49 |
| Time to treatment, hour | 3.0 ± 0.2 | 3.1 ± 0.2 | 0.75 |
| NIHSS score at baseline, median( range) | 11(6-20) | 12 (6-22) | 0.39 |
| Volume of infarct, ml | 20.0 ± 3.0 | 23.0 ± 4.0 | 0.90 |
| Occlusion site, n (%) | 0.29 | ||
| Anterior cerebral artery | 2 (8) | 0 (0) | |
| Proximal section of first segment of middle cerebral artery | 1 (4) | 2 (9) | |
| Midsection of first segment of middle cerebral artery | 4 (16) | 2 (9) | |
| Distal section of first segment of middle cerebral artery | 2 (8) | 4 (18) | |
| Second segment of middle cerebral artery | 14 (56) | 8 (36) | |
| Terminal internal carotid artery | 2 (8) | 6 (28) |
Plus–minus values are means ± SE. NIHSS =National Institutes of Health Stroke Scale, range from 0 to 42; higher scores indicate more severe neurologic deficits. BP = blood pressure. INR = International normalized ratio. Hypertension = Systolic blood pressure >140 mm Hg and/or diastolic blood pressure> 90 mm Hg; Diabetes = Fasting plasma glucose ≥ 7.0 millimoles per liter and/or plasma glucose after a meal for two hours ≥ 11.1 millimoles per liter. Hyperlipidemia = Serum total cholesterol levels >5.72 millimoles per liter and/or triglycerides > 1.7 millimoles per liter.
Alteration of lymphocytes after oral fingolimod
We used circulating lymphocyte counts to confirm the biological activity of fingolimod at a dosage of 0.5mg. At baseline, the numbers of CD4+ T, CD8+ T, CD19+ B and CD56+ natural killer (NK) cells in fingolimod-treated patients were similar to those of controls. Variable but steady reductions of these cell counts were recorded on day 1 after fingolimod administration, these were 54% (P < 0.01), 61% (P < 0.01), 59% (P < 0.01) and 58% (P < 0.01) decreases from baseline in CD4+ T cells, CD8+ T cells, CD19+ B cells and NK cells, respectively (Figure 2). The swift action of fingolimod on blood lymphocytes makes it potentially feasible to combine fingolimod (0.5mg) with alteplase treatment in acute ischemia. On the subsequent day 7 analyses, lymphopenia was consistently seen in fingolimod-treated patients. On the day 90 follow up, the total lymphocyte counts returned to baseline levels.
Figure 2.
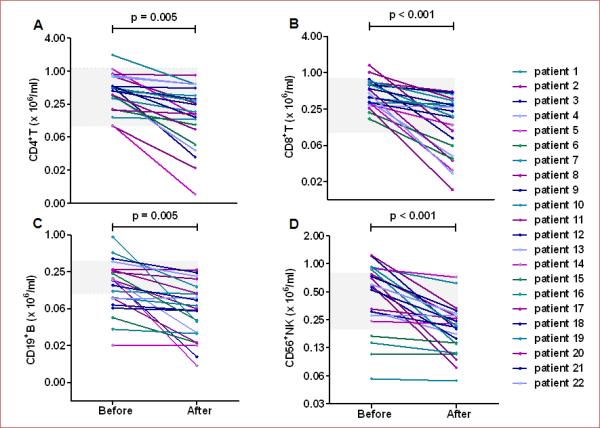
Lymphocyte subset counts decreased after one day of fingolimod treatment. Blood was drawn from patients at the baseline (3.1 hours) and at day 1 after the first dose of alteplase with or without fingolimod (grey horizontal square depicts pooled data from patients who received alteplase only; lines with patient numbers depict those who received alteplase with fingolimod. Mononuclear cells were purified and stained with antibodies to individual cell types. Percentages of CD4+ T cells (A), CD8+ T cells (B),CD19+ B cells (C) and CD56+ NK cells (D) were determined by flow cytometry; absolute numbers were calculated, and are displayed as × 106/ml of blood from patients. Each patient's mean ± SE is shown. Comparisons were performed with paired sample t-tests.
Clinical and MRI outcomes in patients receiving alteplase alone or combined with fingolimod
For all 47 patients, baseline and follow-up DWI, FLAIR, GRE and MRA images were available for analysis. There was no difference in the recanalization rates between groups on day 1 (P =0.77); 14 (64%) patients in the fingolimod plus alteplase group and 17(68%) patients in alteplase group experienced recanalization.
Compared to patients who received alteplase only, the addition of fingolimod appeared to be associated with better outcomes on all three primary end points adopted by the study (Figure 3 A-C): remarkable restraint of infarct volume expansion (10.1 ± 1.2 vs 34.3 ± 10.4 ml, P = 0.04), smaller hemorrhage volume (1.2 ± 0.4 vs 4.4 ± 1.1ml, P = 0.01) and greater clinical improvement (4 (0-8) vs 2 (−2-8), P =0.02) on day 1. The magnitude of hemorrhagic transformation was significantly milder in patients who received the combination of fingolimod with alteplase vs patients who received alteplase alone (P < 0.01) (Figure 3D). One patient in the alteplase group with malignant middle cerebral artery occlusion received craniotomy treatment on day 1, but no patient treated with fingolimod plus alteplase underwent craniotomy. No patients in these two groups had symptomatic intracranial hemorrhage at day 1.
Figure 3.
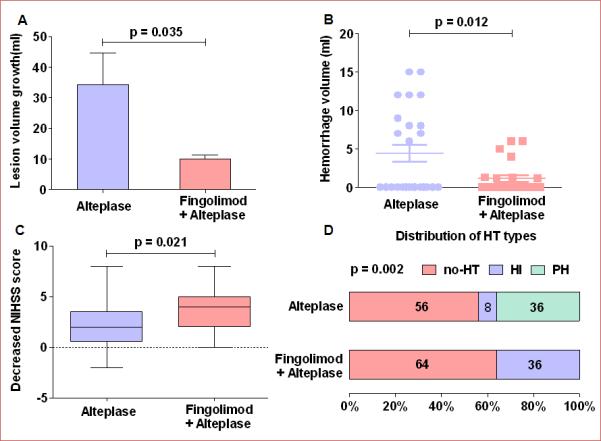
Lesion volume growth, hemorrhage volume and clinical status at day 1. Panel A: Lesion volume growth at day 1; lesion growth = lesion volume measured on Flair (day 1) minus lesion volumes measured on DWI (baseline); values are mean ± SE; comparisons were performed with independent t-tests. Panel B: Hemorrhage volume stemming from hemorrhagic transformation at day 1. Lesion volumes were measured on GRE at day 1; comparisons were performed using the Mann-Whitney test. Panel C: Changes in the NIHSS score at 24 hours. The horizontal line inside each box indicates the median, and the top and bottom of the box indicate the interquartile range. The error bars indicate the 5th and 95th percentiles. Comparisons were performed using the Mann-Whitney test. NIHSS = National Institutes of Health Stroke Scale. Panel D: Distribution of the type of hemorrhagic transformation at day 1; Chi-square test. HT = hemorrhagic transformation, HI = hemorrhagic infarction, PH = parenchymal hematoma, no-HT = no hemorrhagic transformation, Fin = fingolimod.
Fingolimod was also beneficial with respect to secondary outcomes (Figure 4). In comparison with patients who received alteplase only, patients who received the combination of fingolimod and alteplase exhibited a significant reduction of lesion volume growth (−2.3 ± 2.7 vs 12.1 ± 3.7 ml, P < 0.01), and decreased NIHSS scores (2.5 (0-7) vs 1 (−4-5), P < 0.01) from day 1 to day 7; a higher proportion of these patients experienced good recovery (mRS 0-1) by day 90 (73% vs 32%, P = 0.01).
Figure 4.
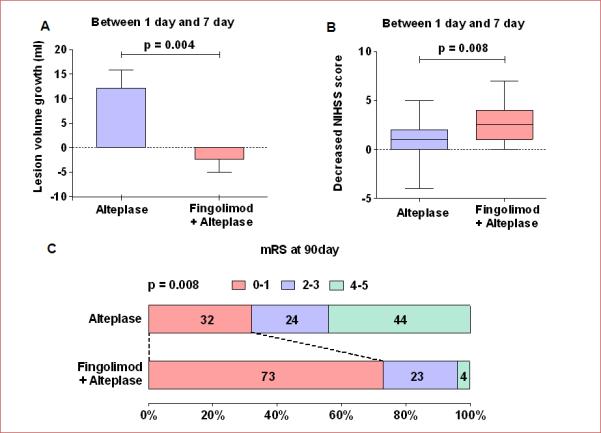
Lesion volume growth and clinical improvement from day 1 to day 7, as well as the probability of excellent recovery at 90 days. Panel A: Lesion volume growth from day 1 to day 7; lesion growth = Lesion volumes measured on Flair (day 7) minus Lesion volumes measured on Flair (day 1). Values are mean ± SE; comparisons were performed with independent t-tests. Panel B: Changes in the NIHSS score from day 1 to day 7; the horizontal line inside each box indicates the median, the top and bottom of the box indicate the interquartile range, the I bars indicate the 5th and 95th percentiles; comparisons were performed using the Mann-Whitney test; NIHSS = National Institutes of Health Stroke Scale. Panel C: Distribution of the degree of disability at day 90; comparisons were performed with Chi-squared test; mRS = modified Rankin Scale, Fin = fingolimod.
These results indicate that the addition of fingolimod was probably responsible for inhibiting hemorrhagic transformation and edema at early time points (less than 24 hours) and restrained the extension of lesion volume at later time points (from day 1 to day 7) as representative MRIs showed in Figure 5.
Figure 5.
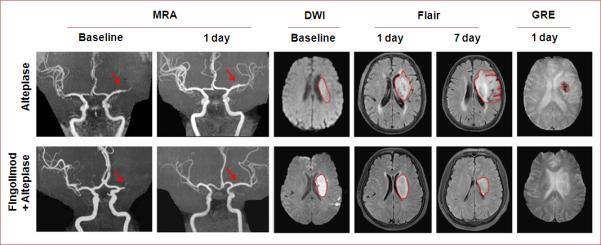
Representative MRI scans of a patient treated with alteplase plus fingolimod and a patient treated with only alteplase. Representative MRI scans show an acute left hemisphere infarct with the complete distal-first segment of middle cerebral artery occlusions in control (upper panel) and an acute left hemisphere infarct with complete mid-first segment of middle cerebral artery occlusions in fingolimod-treated patient (lower panel). At day 1, although the recanalization status of all their vessels was the same, striking differences were evident. The infarct volume was enlarged in the control patient on Flair imaging, and hemorrhagic transformation occurred with hypointense signaling on GRE. In contrast, the progression of infarct volume was restrained in our fingolimod-treated patient. At day 7, lesion volume in the control patients still increased, but to the contrary, lesion volume decreased in the fingolimod-treated patient. Fin = fingolimod.
Safety
Suspected lung infection and urinary tract infection occurred in 14% and 9% of the fingolimod plus alteplase- treated patients and in 12% and 8% of alteplase-only patients, respectively (Table 2). Infection signs in fingolimod plus alteplase-treated patients were relatively mild and resolved after a brief course of antibiotics. No recipient of fingolimod complained of chest discomfort. ECG monitoring found no cardiac arrhythmia or atrioventricular blocks. In addition, blood pressure, heart rate and routine laboratory investigations before and after the treatment showed no obvious fluctuations (Table s-1, Figure s-1).
Table 2.
Complications and adverse events*
| Alteplase (N = 25) | Fingolimod + Alteplase (N = 22) | P value | |
|---|---|---|---|
| Complications | |||
| Deaths | 0 (0) | 0 (0) | |
| Myocardial infarctions | 0 (0) | 0 (0) | |
| Recurrent strokes | 0 (0) | 0 (0) | |
| Cerebral hernia | 1 (4) | 0 (0) | 1.00 |
| Hemorrhage of digestive tract | 3 (12) | 1 (5) | 0.61 |
| Fever (>38 °C) | 5 (20) | 5 (23) | 1.00 |
| Event | |||
| All events | |||
| At least one adverse event | 8 (32) | 6 (27) | 0.76 |
| Any adverse event leading to discontinuation | 0 (0) | 0 (0) | |
| Any serious adverse event | 0 (0) | 0 (0) | |
| Frequent or special-interest adverse events | |||
| Suspected lung infection | 3 (12) | 3 (14) | 1.00 |
| Urinary tract infection | 2 (8) | 2 (9) | 1.00 |
| Herpes virus infection | 0 (0) | 0 (0) | |
| Abnormal laboratory liver-function test | 0 (0) | 0 (0) | |
| Gastrointestinal disorders | 0 (0) | 0 (0) | |
| Leukopenia | 0 (0) | 0 (0) | |
| Lymphopenia | 0 (0) | 0 (0) | |
| Bradycardia | 0 (0) | 0 (0) | |
| Atrioventricular block | 0 (0) | 0 (0) | |
| Macular edema | 0 (0) | 0 (0) |
Data are n (%).
Discussion
In this study, we found that fingolimod plus alteplase was superior to alteplase alone with respect to lesion volume enlargement, hemorrhage volume and clinical improvement at 24 hours after acute ischemic stroke. It is conventional in studies of acute stroke to use a primary outcome that assesses disability status at 90 days.1-3 However, hemorrhagic transformation after thrombolysis is generally an early event (<24 hours), and mass edema occurs within 1 to 4 hours of stroke onset.3, 7,11 Additionally, reperfusion injury must be measured at a shorter interval after early reperfusion to assess the biologic efficacy of fingolimod. Therefore, we adopted a primary clinical outcome that was most likely to be sensitive to reperfusion injury. A longer-term clinical benefit was also evident; that is, a higher probability patients will recover well (mRS 0-1) was seen in the fingolimod-treated group.
Clinical factors such as a high initial NIHSS, delayed treatment time, high blood pressure, atrial fibrillation, cerebral embolism, hyperglycemia and recanalization status are well known to increase the incidence of hemorrhagic transformation.11 In this trial, there was no difference between the two groups of patients in terms of these predictors except that more patients had atrial fibrillation in the fingolimod plus alteplase group (8 / 22 vs 2 / 25). At the baseline, patients enrolled in the fingolimod plus alteplase group were expected to be more prone to bleeding compared with the patients in the alteplase group on the basis of the former's higher rate of atrial fibrillation. To the contrary, however, no increase in the probability of bleeding or severity of hemorrhagic transformation was identified in this group of patients who received the combination therapy of fingolimod and alteplase. Thus, our findings suggest that fingolimod was effective in preventing hemorrhagic transformation associated with alteplase administration.
Abnormal permeability of the BBB resulting from ischemic endothelial dysfunction of capillaries and strong inflammatory reaction underlies both brain edema and hemorrhagic transformation of ischemic brain tissue at the earlier time after alteplase treatment.7,11 In addition, alteplase may degrade the integrity of the extracellular matrix and increase the risk of hemorrhagic transformation.24 We showed that fingolimod combined with alteplase reduced lesion volume expansion, mainly derived from vasogenic edema,8 and hemorrhage volume within 24 hours.
Our study suggests the possibility that fingolimod limits the lesion expansion, at least in part, via suppression of reperfusion injury. However the reduced infarct expansion and hemorrhagic transformation after fingolimod treatment may not solely result from its restriction of reperfusion injury. In addition to reducing cell homing to the brain, preservation of the endothelial integrity of the BBB as well as non-immunological effects on the CNS, such as preventing neuronal death, inhibiting the upregulation of adhesive molecules in endothelial cells, attenuating reactive astrogliosis and reducing microvascular thrombosis17-19, 21, 25-28 may also contribute to the observed beneficial effects of fingolimod. In support of this notion, alleviated BBB injury and reduced risk of brain hemorrhage have been reported in a mouse model of thromboembolic stroke after treatment with alteplase plus fingolimod.25 Between the acute and subacute stage in stroke, vasogenic edema increases the lesion volume visible on MRI, peaking between 3 to 8 days after ictus, after which that volume begins to subside, presumably from the resolution of edema, and lesion volume then remains stable until edema vanishes on day 30.9 A local inflammatory response after acute stroke can contribute to secondary vasogenic edema with lesion growth and impede clinical recovery.8,29 Injured and dying cells, after cessation of blood flow, activate the innate and adaptive immune systems and lead to a massive migration of peripheral leukocytes into the brain, such as neutrophils and macrophage, NK cells, CD4+ T , CD8+ T cell subpopulations.30-32 Such cells become intimately involved in all stages of the post-ischemic inflammation cascade.12, 13 On day 7, brain lesion results from the ischemic injury and the secondary inflammation damage. Post-ischemia inflammation injury is the main target of fingolimod. For that reason, we quantified the changes of lesion size from day 1 to day 7, which we deem to be a secondary outcome. A remarkable restriction in lesion growth between day 1 and day 7 was observed in patients who received the combination of fingolimod and alteplase, as compared to that in patients who received alteplase only (−2.3 vs 12.1ml). These findings confirmed the previous results that fingolimod limits the extent of lesion enlargement when fingolimod was administrated at a later time point, a mean of 20 hours after onset21. Further, it is important to note that the limitation of lesion expansion was more pronounced in the current study when fingolimod was administered at a mean time of 3.1 hours after disease onset. Thus, the current results imply that early immune modulation using fingolimod, with or without i.v. thrombolysis, appears to provide a beneficial impact on clinical and radiographic outcome in these patients, and an added-on effect in patients receiving thrombolytic therapy plus fingolimod.
Limitations of this study include the small sample size that precludes the power of the study, suboptimal randomization method and the lack of a parallel arm of patients treated with fingolimod only within 4.5 hours of disease onset to differentiate the effect of fingolimod alone. However, it is unethical to administer fingolimod alone to patients with acute ischemic stroke who are eligible for i.v. alteplase. The advantageous oral formulation of fingolimod for multiple sclerosis might be suboptimal for patients with stroke due to difficulty in swallowing and dysfunction of the gastrointestinal tract in some patients with stroke. The effects of fingolimod alone in preventing spontaneous hemorrhagic transformation or reducing its incidence when in combination with alteplase might be better visualized in patients with larger infarct volume. The narrow time window for managing patients with acute ischemic stroke and conducting sophisticated neuroimaging and other assessments poses a significant technical challenge. Nevertheless, the present data show that fingolimod was well tolerated and appeared to be safe when administered with alteplase within 4.5 hours of acute ischemic stroke. The safety and efficacy of immune modulation and non-immunological effects on the CNS imposed by fingolimod during the acute phase of ischemic stroke urges further evaluation by large scale clinical trials.
Supplementary Material
Acknowledgments
We thank our patients for participating in this study; Drs. H. Wang, L. Zhao, Y. Lu and stroke teams for facilitating the recruitment the patients; Dr. G. Liu for expertise on statistical analysis; Dr. J. Pan for technical assistance; Ms. P. Minick and Mr. K. Wood for editorial assistance. Contributors: F.-D. S. formulated the study concept, acquired funding and supervised execution of the study. F.-D. S, Y. F., D. H. designed the study. Z. Z., D. T., Y. D., N. S., G. C., W. H., Y. F. and X. X. collected data. Y. F. and D. T., analyzed the data. F.-D. S., Y. F., Q. L. and N. S. wrote the manuscript.
Funding Sources: This study was funded by National Basic Research Program of China (2013CB966900), the National Science Foundation of China (81230028), National Key Clinical Specialty Construction Program of China, the US National Institute of Health (R01AI083294) and American Heart Association (14GRNT18970031).
Footnotes
Clinical Trial Registration Information- www.clinicaltrials.gov. Identifier: NCT02002390.
Disclosures: None.
References
- 1.Hacke W, Kaste M, Bluhmki E, Brozman M, Dávalos A, Guidetti D, Larrue V, Lees KR, Medeghri Z, Machnig T, Schneider D, von Kummer R, Wahlgren N, Toni D, ECASS Investigators Thrombolysis with alteplase 3 to 4.5 hours after acute ischemic stroke. N Engl J Med. 2008;359:1317–1329. doi: 10.1056/NEJMoa0804656. [DOI] [PubMed] [Google Scholar]
- 2.The National Institute of Neurological Disorders and Stroke rt-PA Stroke Study Group Tissue plasminogen activator for acute ischemic stroke. N Engl J Med. 1995;333:1581–1587. doi: 10.1056/NEJM199512143332401. [DOI] [PubMed] [Google Scholar]
- 3.The NINDS t-PA Stroke Study Group Intracerebral hemorrhage after intravenous t-PA therapy for ischemic stroke. Stroke. 1997;28:2109–2118. doi: 10.1161/01.str.28.11.2109. [DOI] [PubMed] [Google Scholar]
- 4.Jaillard A, Cornu C, Durieux A, Moulin T, Boutitie F, Lees KR, Hommel M. Hemorrhagic transformation in acute ischemic stroke. The MAST-E study. MAST-E Group. Stroke. 1999;30:1326–1332. doi: 10.1161/01.str.30.7.1326. [DOI] [PubMed] [Google Scholar]
- 5.Bang OY, Saver JL, Kim SJ, Kim GM, Chung CS, Ovbiagele B, Lee KH, Liebeskind DS, UCLA-Samsung Stroke Collaborators Collateral flow averts hemorrhagic transformation after endovascular therapy for acute ischemic stroke. Stroke. 2011;42:2235–2239. doi: 10.1161/STROKEAHA.110.604603. [DOI] [PubMed] [Google Scholar]
- 6.Schwamm LH, Koroshetz WJ, Sorensen AG, Wang B, Copen WA, Budzik R, Rordorf G, Buonanno FS, Schaefer PW, Gonzalez RG. Time course of lesion development in patients with acute stroke: serial diffusion- and hemodynamic-weighted magnetic resonance imaging. Stroke. 1998;29:2268–2276. doi: 10.1161/01.str.29.11.2268. [DOI] [PubMed] [Google Scholar]
- 7.Simard JM, Kent TA, Chen M, Tarasov KV, Gerzanich V. Brain oedema in focal ischaemia: molecular pathophysiology and theoretical implications. Lancet Neurol. 2007;6:258–268. doi: 10.1016/S1474-4422(07)70055-8. [DOI] [PMC free article] [PubMed] [Google Scholar]
- 8.Neumann-Haefelin T, Kastrup A, de Crespigny A, Yenari MA, Ringer T, Sun GH, Moseley ME. Serial MRI after transient focal cerebral ischemia in rats: dynamics of tissue injury, blood-brain barrier damage, and edema formation. Stroke. 2000;31:1965–1972. doi: 10.1161/01.str.31.8.1965. discussion 1972-1963. [DOI] [PubMed] [Google Scholar]
- 9.Gaudinski MR, Henning EC, Miracle A, Luby M, Warach S, Latour LL. Establishing final infarct volume: stroke lesion evolution past 30 days is insignificant. Stroke. 2008;39:2765–2768. doi: 10.1161/STROKEAHA.107.512269. [DOI] [PMC free article] [PubMed] [Google Scholar]
- 10.Hacke W, Schwab S, Horn M, Spranger M, De Georgia M, von Kummer R. ‘Malignant’ middle cerebral artery territory infarction: clinical course and prognostic signs. Arch Neurol. 1996;53:309–315. doi: 10.1001/archneur.1996.00550040037012. [DOI] [PubMed] [Google Scholar]
- 11.Alvarez-Sabin J, Maisterra O, Santamarina E, Kase CS. Factors influencing haemorrhagic transformation in ischaemic stroke. Lancet Neurol. 2013;12:689–705. doi: 10.1016/S1474-4422(13)70055-3. [DOI] [PubMed] [Google Scholar]
- 12.Iadecola C, Anrather J. The immunology of stroke: from mechanisms to translation. Nat Med. 2011;17:796–808. doi: 10.1038/nm.2399. [DOI] [PMC free article] [PubMed] [Google Scholar]
- 13.Macrez R, Ali C, Toutirais O, Le Mauff B, Defer G, Dirnagl U, Vivien D. Stroke and the immune system: from pathophysiology to new therapeutic strategies. Lancet Neurol. 2011;10:471–480. doi: 10.1016/S1474-4422(11)70066-7. [DOI] [PubMed] [Google Scholar]
- 14.Chamorro A, Meisel A, Planas AM, Urra X, van de Beek D, Veltkamp R. The immunology of acute stroke. Nat Rev Neurol. 2012;8:401–410. doi: 10.1038/nrneurol.2012.98. [DOI] [PubMed] [Google Scholar]
- 15.Cohen JA, Chun J. Mechanisms of fingolimod's efficacy and adverse effects in multiple sclerosis. Ann Neurol. 2011;69:759–777. doi: 10.1002/ana.22426. [DOI] [PubMed] [Google Scholar]
- 16.Massberg S, von Andrian UH. Fingolimod and sphingosine-1-phosphate--modifiers of lymphocyte migration. N Engl J Med. 2006;355:1088–1091. doi: 10.1056/NEJMp068159. [DOI] [PubMed] [Google Scholar]
- 17.Sanchez T, Estrada-Hernandez T, Paik JH, Wu MT, Venkataraman K, Brinkmann V, Claffey K, Hla T. Phosphorylation and action of the immunomodulator FTY720 inhibits vascular endothelial cell growth factor-induced vascular permeability. J Biol Chem. 2003;278:47281–47290. doi: 10.1074/jbc.M306896200. [DOI] [PubMed] [Google Scholar]
- 18.Cannon RE, Peart JC, Hawkins BT, Campos CR, Miller DS. Targeting blood-brain barrier sphingolipid signaling reduces basal P-glycoprotein activity and improves drug delivery to the brain. Proc Natl Acad Sci U S A. 2012;109:15930–15935. doi: 10.1073/pnas.1203534109. [DOI] [PMC free article] [PubMed] [Google Scholar]
- 19.Hait NC, Wise LE, Allegood JC, O'Brien M, Avni D, Reeves TM, Knapp PE, Lu J, Luo C, Miles MF, Milstien S, Lichtman AH, Spiegel S. Active, phosphorylated fingolimod inhibits histone deacetylases and facilitates fear extinction memory. Nat Neurosci. 2014;17:971–980. doi: 10.1038/nn.3728. [DOI] [PMC free article] [PubMed] [Google Scholar]
- 20.Fu Y, Hao J, Zhang N, Ren L, Sun N, Li YJ, Yan Y, Huang D, Yu C, Shi FD. Fingolimod for the treatment of intracerebral hemorrhage: a 2-arm proof-of-concept study. JAMA Neurol. 2014;71:1092–1101. doi: 10.1001/jamaneurol.2014.1065. [DOI] [PubMed] [Google Scholar]
- 21.Fu Y, Zhang N, Ren L, Yan Y, Sun N, Li YJ, Han W, Xue R, Liu Q, Hao J, Yu C, Shi FD. Impact of an immune modulator fingolimod on acute ischemic stroke. Proc Natl Acad Sci U S A. 2014;111:18315–18320. doi: 10.1073/pnas.1416166111. [DOI] [PMC free article] [PubMed] [Google Scholar]
- 22.Gupta R, Vora NA, Horowitz MB, Tayal AH, Hammer MD, Uchino K, Levy EI, Wechsler LR, Jovin TG. Multimodal reperfusion therapy for acute ischemic stroke: factors predicting vessel recanalization. Stroke. 2006;37:986–990. doi: 10.1161/01.STR.0000209303.02474.27. [DOI] [PubMed] [Google Scholar]
- 23.Chalela JA, Kang DW, Luby M, Ezzeddine M, Latour LL, Todd JW, Dunn B, Warach S. Early magnetic resonance imaging findings in patients receiving tissue plasminogen activator predict outcome: Insights into the pathophysiology of acute stroke in the thrombolysis era. Ann Neurol. 2004;55:105–112. doi: 10.1002/ana.10781. [DOI] [PubMed] [Google Scholar]
- 24.Wang X, Tsuji K, Lee SR, Ning M, Furie KL, Buchan AM, Lo EH. Mechanisms of hemorrhagic transformation after tissue plasminogen activator reperfusion therapy for ischemic stroke. Stroke. 2004;35:2726–2730. doi: 10.1161/01.STR.0000143219.16695.af. [DOI] [PubMed] [Google Scholar]
- 25.Campos F, Qin T, Castillo J, Seo JH, Arai K, Lo EH, Waeber C. Fingolimod reduces hemorrhagic transformation associated with delayed tissue plasminogen activator treatment in a mouse thromboembolic model. Stroke. 2013;44:505–511. doi: 10.1161/STROKEAHA.112.679043. [DOI] [PMC free article] [PubMed] [Google Scholar]
- 26.Cipriani R, Chara JC, Rodriguez-Antiguedad A, Matute C. FTY720 attenuates excitotoxicity and neuroinflammation. J Neuroinflammation. 2015;12:86. doi: 10.1186/s12974-015-0308-6. [DOI] [PMC free article] [PubMed] [Google Scholar]
- 27.Deogracias R, Yazdani M, Dekkers MP, Guy J, Ionescu MC, Vogt KE, Barde YA. Fingolimod, a sphingosine-1 phosphate receptor modulator, increases BDNF levels and improves symptoms of a mouse model of Rett syndrome. Proc Natl Acad Sci U S A. 2012;109:14230–14235. doi: 10.1073/pnas.1206093109. [DOI] [PMC free article] [PubMed] [Google Scholar]
- 28.Di Menna L, Molinaro G, Di Nuzzo L, Riozzi B, Zappulla C, Pozzilli C, Turrini R, Caraci F, Copani A, Battaglia G, Nicoletti F, Bruno V. Fingolimod protects cultured cortical neurons against excitotoxic death. Pharmacol Res. 2013;67:1–9. doi: 10.1016/j.phrs.2012.10.004. [DOI] [PubMed] [Google Scholar]
- 29.Ahmad M, Graham SH. Inflammation after stroke: mechanisms and therapeutic approaches. Transl Stroke Res. 2010;1:74–84. doi: 10.1007/s12975-010-0023-7. [DOI] [PMC free article] [PubMed] [Google Scholar]
- 30.Kleinschnitz C, Schwab N, Kraft P, Hagedorn I, Dreykluft A, Schwarz T, Austinat M, Nieswandt B, Wiendl H, Stoll G. Early detrimental T-cell effects in experimental cerebral ischemia are neither related to adaptive immunity nor thrombus formation. Blood. 2010;115:3835–3842. doi: 10.1182/blood-2009-10-249078. [DOI] [PubMed] [Google Scholar]
- 31.Shichita T, Sugiyama Y, Ooboshi H, Sugimori H, Nakagawa R, Takada I, Iwaki T, Okada Y, Iida M, Cua DJ, Iwakura Y, Yoshimura A. Pivotal role of cerebral interleukin-17-producing gammadeltaT cells in the delayed phase of ischemic brain injury. Nat Med. 2009;15:946–950. doi: 10.1038/nm.1999. [DOI] [PubMed] [Google Scholar]
- 32.Gan Y, Liu Q, Wu W, Yin JX, Bai XF, Shen R, Wang Y, Chen J, La Cava A, Poursine-Laurent J, Yokoyama W, Shi FD. Ischemic neurons recruit natural killer cells that accelerate brain infarction. Proc Natl Acad Sci U S A. 2014;111:2704–2709. doi: 10.1073/pnas.1315943111. [DOI] [PMC free article] [PubMed] [Google Scholar]
Associated Data
This section collects any data citations, data availability statements, or supplementary materials included in this article.