Abstract
Purpose
To examine the across-species scalability of monoclonal antibody (mAb) pharmacokinetics (PK) and assess similarities in tissue distribution across species using a recently developed minimal PBPK (mPBPK) model.
Methods
Twelve sets of antibody PK data from various species were obtained from the literature, which were jointly and individually analyzed. In joint analysis, vascular reflection coefficients for tissues with either tight (σ1) or leaky endothelium (σ2) were assumed consistent across species with systemic clearance allometrically scaled (CL= a·BWb). Four parameters (σ1, σ2, a, and b) were estimated in the joint analysis. In addition, the PK from each species was individually analyzed to assess species similarities in tissue distribution.
Results
Twelve mAb PK profiles were well-captured by the mPBPK model in the joint analysis. The estimated σ1 ranged 0.690 to 0.999 with an average of 0.908; and σ2 ranged 0.258 to 0.841 with an average of 0.579. Clearance was reasonably scaled and b ranged 0.695 to 1.27 averaging 0.91. Predictions of plasma concentrations for erlizumab and canakinumab in humans using parameters obtained from fitting animal data were consistent with actual measurements.
Conclusions
Therapeutic mAbs given IV usually exhibit biexponential kinetics with their distribution properties best captured using physiological concepts. The mPBPK modeling approach may facilitate efforts in translating antibody distribution and overall PK across species.
Keywords: Second-generation mPBPK, monoclonal antibody, allometric scaling
INTRODUCTION
Pharmacokinetic and pharmacodynamic (PK/PD) assessments play a critical role in the monoclonal antibody (mAb) discovery and development process (1). The PK/PD properties of antibody drugs are unique and largely different from small molecule drugs. Antibody drugs show several special properties, including limited vascular permeability, neonatal Fc receptor recycling, and more common receptor-mediated nonlinearity (2). Despite the complexity of mAb PK properties, a number of well-established methodologies are available for interspecies scaling of PK of mAb either from animals to humans or from one species to another (3,4).
There are three widely utilized approaches for anticipating mAb PK. Allometric scaling is the fundamental and most widely used approach, which is based on the assumption that different species have similarities in anatomy, physiology, and biochemistry (3). In many cases, mAb PK parameters, such as systemic clearance and volume of distribution at steady-state, have been scaled across species as a function of body weight with the relationship Y = a·BWb, where Y is the parameter of interest, BW is body weight, a is the allometric coefficient, and b is the allometric exponent (4, 5). Allometric scaling usually can provide good predictions of mAb PK in man if the assumption is valid that body weight alone determines all differences. This may not always be true (6). Some corrective factors have been applied accounting for additional differences in PK among species, such as brain weight, maximum life span potential, protein binding, or in vitro hepatocyte intrinsic CL (7-9). This approach often requires linear PK across species and sometimes is not applicable for mAbs that exhibit target-mediated nonlinear drug disposition.
Another approach for predicting mAbs PK in man based on animal data is the Dedrick approach (10), which applies physiological time to superimpose the concentration-time profiles of several species. This has been applied in projecting concentration-time profiles of mAbs in man reasonably well (1). An advantage of the Dedrick approach is that data from only one species is needed. Additionally, this approach could apply in a nonlinear system assuming that the Michaelis-Menten variables (Km and Vmax) are scalable or similar across species and differences of target expression among species are not taken into consideration (1).
Integrating fundamental allometric scaling principles into physiologically-based pharmacokinetic (PBPK) modeling provides an alternative and most advanced approach for PK interspecies scaling. Species-specific parameters [i.e., tissue volumes and blood flow rates] and drug specific information [i.e., tissue to plasma partition coefficients (Kp), protein binding parameters] are specified in the model building process (11). Once the model predicts PK behavior well in one species, it can be extended to other species by utilizing species-specific physiological information. A PBPK model was first applied to scale-up distribution of mAb from mice to man by Baxter et al (11, 12). The PBPK model produced good predictions of mAb disposition in man as well as tumor uptake by scaling murine parameters using known empirical relationships (13). Full PBPK models best integrate drug- and species-specific information providing prediction of PK parameters, tissue concentration versus time profiles, and providing more mechanistic insights into the properties of mAbs. However, full PBPK models for mAbs have limitations in regard to availability of tissue concentrations and the mathematical complexity of the model (14).
The targets of many therapeutic mAbs often exist in extravascular space, mostly in interstitial fluid (ISF). Antibody concentrations in ISF are directly associated with target engagement and efficacy. However, measuring mAb concentrations in ISF is technically challenging because of difficulties in sampling ISF. In such situations, PBPK models are believed to be useful alternatives. Minimal PBPK models were recently developed to allow analysis of only plasma time-course data to reasonably predict antibody concentrations in ISF (15-17). Such models bridge compartmental and full PBPK models. They provide greater insight into mAb disposition and elimination with less complexity than a full PBPK model. More importantly, these models provide meaningful predictions of antibody distribution in two groups of lumped tissues.
This study evaluates the feasibility of integrating allometric principles into the basic minimal PBPK model to scale antibody PK across species and compare tissue bio-distribution. This model was used to jointly and individually analyze the PK of 12 antibodies across species, mainly to: 1) evaluate scalability using this model for mAb PK analysis, 2) demonstrate the feasibility of this model for predicting human PK as a general approach in species translation, and 3) compare antibody PK and tissue bio-distribution across species.
THEORETICAL
Second-generation mPBPK model integrated with allometric scaling
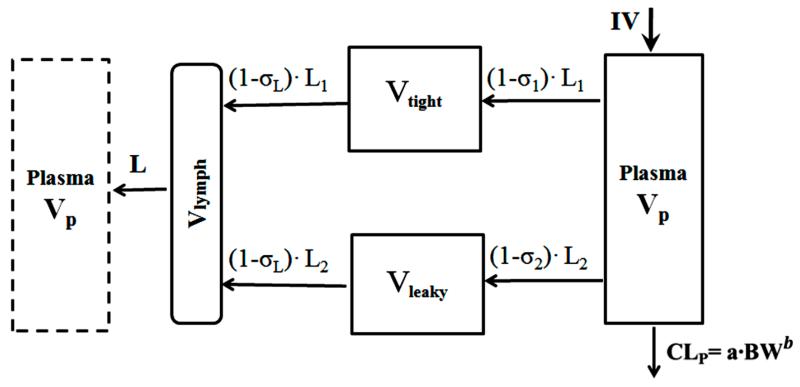
Allometric principles were incorporated into the basic second-generation mPBPK model (Figure 1). The model structure was described in our previous publications (15, 16). Tissues are divided into two compartments Vtight and Vleaky according to their tissue vascular endothelial structure. Muscle, skin, adipose, and brain are assigned as Vtight, whereas, liver, kidney, heart, and all other tissues are denoted as Vleaky. We assumed clearance from plasma. In joint analysis, vascular reflection coefficients for tissues with either tight (σ1) or leaky endothelium (σ2) were assumed consistent across species. The differential equations for the model are:
| (1) |
| (2) |
| (3) |
| (4) |
where Cp is mAb concentration in Vp (plasma volume), Ctight and Cleaky refer to mAb concentration in Vtight and Vleaky, Vlymph is lymph volume, assumed equal to blood volume in this model, L1 and L2 are lymph flow for Vtight and Vleaky, and L is total lymph flow equal to the sum of L1 and L2 assuming L1 = 0.33·L and L2 = 0.67·L. The relative fractions of lymph flow in the two types of tissues are believed to be constant across species. The σ1 and σ2 are vascular reflection coefficients for Vtight and Vleaky and we assume both σ1 and σ2 < 1. The σL is lymphatic capillary reflection coefficient, which is assigned to be 0.2 in this model. We assumed clearance (CLp) from plasma and allometric scaling of systemic clearance across species based on body weight (BW) with the allometric equation: CL= a·BWb, where a and b are allometric coefficients.
Figure 1.
The mAb minimal PBPK model with allometric scaling of systemic clearance (CLp). Symbols and physiological restrictions are defined with Eq (1-4). The left box represents the venous plasma as in full PBPK models, but is not applied in the present model.
In this model, we used typical species-specific physiological values for body weight, plasma and tissue sizes, and lymph flows (L) and volumes (Vlymph). We assumed Vtight = 0.65·ISF·Kp and Vleaky = 0.35·ISF·Kp, where ISF is total interstitial fluid. The Kp is available fraction of interstitial fluid for mAb distribution, which was assigned as 0.8 for native IgG1 and 0.4 for native IgG4 according to previous studies. The Kp was fixed 0.8 given the fact that most developed antibodies show similar isoelectric points with native IgG1 (18). The relative fractions of Vtight and Vleaky to total ISF were calculated based upon the values used in full PBPK models (19). The relative fractions of ISF in Vtight and Vleaky were assumed to be constant across species. For joint analysis, we assumed that each mAb had the same vascular reflection coefficients for both tight tissues (σ1) and leaky tissues (σ2) among species. For individual fitting, we calculated each species’ distribution rate, which also known as the transcapillary escape rate (TER) (20). TER is an essential factor to evaluate mAb distribution in extravascular spaces. TER is the sum of two routes, TER = L1 ·(1 − σ1) + L2 ·(1 − σ2). The concentration ratio at equilibrium between ISF and plasma was calculated as (1 − σ1)/(1 − σL) for Vtight and (1 − σ2)/(1 − σL) for Vleaky.
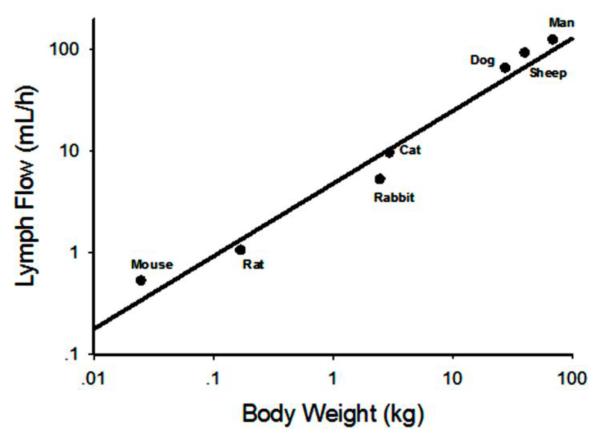
For lymph flow, since no monkey value was available from the literature, we applied allometric scaling between lymph flow and body weights for the values from available species. The physiological parameters used for lymph flow scaling (21-23) and model fitting are listed in Table I.
Table I.
Physiological parameters used for scaling of lymph flow and PK properties of 12 mAbs across species.
| Man | Sheep | Dog | Monkey | Cat | Rabbit | Rat | Mouse | |
|---|---|---|---|---|---|---|---|---|
| Body weight, kg | 70 | 40.8 | 28 | 3.5 | 3.0 | 2.5 | 0.3 | 0.020 |
| Thoracic duct a, ml/h/kg | 1.38 | 1.82 | 1.88 | NA | 2.56 | 1.68 | 4.10 | 4.80 |
| Lymph flow, ml/h/kg | 1.73 | 2.27 | 2.35 | 3.51 | 3.20 | 2.10 | 5.13 | 6.00 |
| ISF, L | 15.6 | NA | NA | 0.735 | NA | NA | 0.0699 | 0.00435 |
| Lymph volume (Vlymph ), L |
5.2 | NA | NA | 0.314 | NA | NA | 0.0162 | 0.0016 |
| Plasma (Vp), L | 2.6 | NA | NA | 0.157 | NA | NA | 0.0081 | 0.00085 |
Data analysis
The PK profiles of 12 mAbs in different species were analyzed using the mPBPK model (Table II). The rituximab PK in mice were in-house data. Data for other biologics in animals and man were digitized using Digitizer software (25): rituximab (S1,S2), dacetuzumab (S3), RSHZ19 (S4-6), bevacizumab (S7,S8), trebananib (S9,S10), belimumab (S11,S12), AB-01(S13,S14), erlizumab (S15,S16), canakinumab (S17), SB249417 (S18,S19), rilotumumab (S20,S21), and AB-02 (S14,S22). The mAbs selected were those with linear PK in the tested dose range and study conditions.
Table II.
The 12 mAbs analyzed using the mPBPK model with allometric scaling
| Compound (Refb) | Source | Binding target | Species |
|---|---|---|---|
| Rituximab (S1,S2) | chimeric IgG1 | CD20 | mouse, rat, human |
| Dacetuzumab (S3) | humanized IgG1 | CD40 | mouse, rat, monkey |
| RSHZ19 (S4-6) | humanized IgG1 | RSV | mouse, rat, monkey, human |
| Bevacizumab (S7,S8) | humanized IgG1 | VEGF | mouse, human |
| Trebananib (S9,S10) | peptibody | ANG-1/ ANG-2 | mouse, rat, human |
| Belimumab (S11,S12) | human IgG1 | BAFF, BLyS | monkey, human |
| AB-01(S13,S14) | human | IL-13 | mouse, rat, monkey |
| Erlizumab(S15,S16) | humanized IgG1 | VEGF | mouse, rat, monkey, human |
| Canakinumab(S17) | humanized IgG1 | IL-1β | mouse, monkey, human |
| SB249417(S18,S19) | humanized IgG1 | IX/IXa | monkey, human |
| Rilotumumab(S20,S21) | human IgG2 | HGF | monkey, human |
| AB-02 (S14,S22) | humanized IgG1 | IL-13 | monkey, rat |
References provided in supplementary materials
The PK data from different species were analyzed either jointly or individually. In joint analysis, all species were assumed to have common vascular reflection coefficients for both types of tissues (σ1, σ2) with CL allometrically scaled. This analysis was designed to assess the across-species scalabilities of the mPBPK parameters. With this approach, the plasma profiles of erlizumab and canakimumab in man were predicted and compared with experimental observations to evaluate model performance. The model-predicted CL for all these antibodies was further compared with that derived from non-compartmental analysis (NCA). The NCA was performed using Phoenix TM WinNonlin® 6.3 (Pharsight, Mountain View, CA). The concentration at time zero (C0) was estimated via linear back extrapolation to time zero using the first two time points. Area under the concentration time curve from time zero to infinity (AUC) was calculated by the linear trapezoidal interpolation method. The slope of the apparent terminal phase was estimated by log-linear regression using weighting with power -2. In individual analyses, the PK profiles for each species were separately analyzed with the mPBPK model to estimate species-specific vascular reflection coefficients by fixing allometric factors a and b that were obtained from jointly fitting data from all of the species for each antibody. This analysis evaluates the species differences of each mAb in tissue distribution and explores which species reveals the most similar distribution behaviors comparing values from man.
Model fitting was evaluated in terms of parameter estimates and several model performance criteria. Computer simulations were performed using ADAPT 5 and fittings utilized the maximum likelihood method in ADAPT 5 with naïve pooling data analysis (26). The variance model was defined as:
where Vi is the variance of the response at the ith time point, ti is the actual time at the ith time point, and Y(ti) is the predicted value at time ti from the model. The variance parameter intercept and slope were estimated to together with system parameters. Model performance was evaluated by goodness of fitting with visual checks, sum-of-squared residuals, Akaike Information Criterion (AIC), Schwarz Criterion (SC), and Coefficient of Variation (CV %) of the estimated parameters.
RESULTS
The mAbs analyzed in this study are summarized in Table II. Data for 12 mAb and mAb derivatives include ten full antibodies, one mAb fragment, and one peptibody. One mAb is chimeric IgG, two mAb are human IgG, and eight mAb are humanized IgG. Allometric scaling was applied with four species for 2 mAb, three species for 5 mAbs, and two species for 5 mAbs. All mAb selected in this analysis showed linear PK that is usually analyzed with a two-compartment (2CM) mammillary model. The human data in this study, except for RSHZ19, canakinumab, and SB249147, were from healthy volunteers with the others from patients. We included all the species data available in the literature for rodent (eg, mouse, rat) and non-rodent species (eg, monkey, rabbit). Some studies showed that monkey is the most common species for PK analysis due to similar affinity of target binding for most mAbs in monkeys and man (27). Non-cross-reactive species, such as mouse and rat, have also been used for CL determination, particularly for nonspecific clearance (usually linear and not related to the binding with target antigen), which might be suitable for characterizing CL for mAbs showing linear kinetics (28). The mAbs selected in this analysis include 9 antibodies targeting soluble antigens and 3 for membrane-bound antigens.
Physiological parameters are important components for physiologically-based PK models. The physiological parameters used in lymph flow scaling and model fitting are shown in Table I. The lymph flow and volume of interstitial fluid are two critical physiological components in mAb PK analysis. However, directly measured lymph flow for each organ was not available, which necessitates two major assumptions: a) Lymph flow for each tissue is proportional to tissue blood flow (an assumption commonly used in full PBPK models) (29). This gives the fraction of lymph flow for Vtight as 0.33 (L1 = 0.33·) and for Vtight as 0.67 (L2 = 0.33·L). b) Lymph flow through the thoracic duct measured by cannulation accounts for 80% of total lymph flow (23), and the percentage is conserved across species. Then, using the literature reported thoracic lymph flow, the total lymph flow was calculated (Table I). These values conform to an allometric relationship (Figure 2): Lymph Flow = 4.92·BW 0.730. The total lymph flow for monkey was not available and thus predicted with this equation, and the lymph flow for other species in our model utilized the calculated total lymph flow (Table I).
Figure 2.
Allometric relationship between total lymph flow and species body weights. Mouse, rat, rabbit, cat, dog, and man data were extracted from Lindena et al (23). Sheep data were obtained from Porter et al (22). The regression line is Lymph Flow = 4.92·BW 0.730
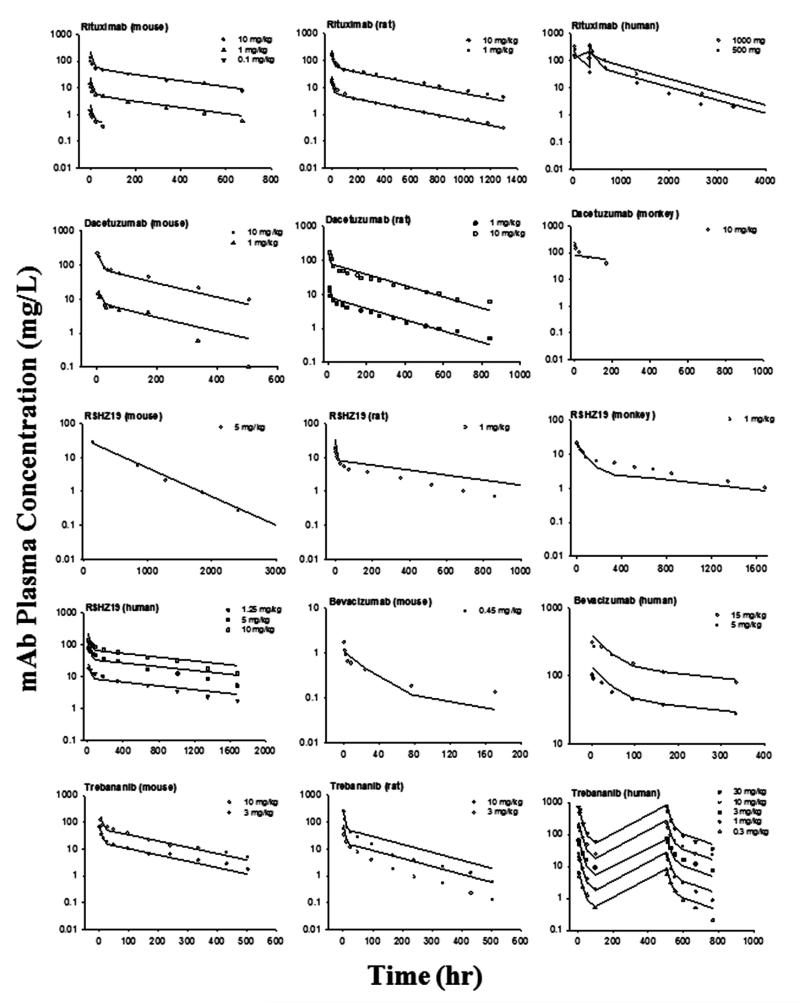
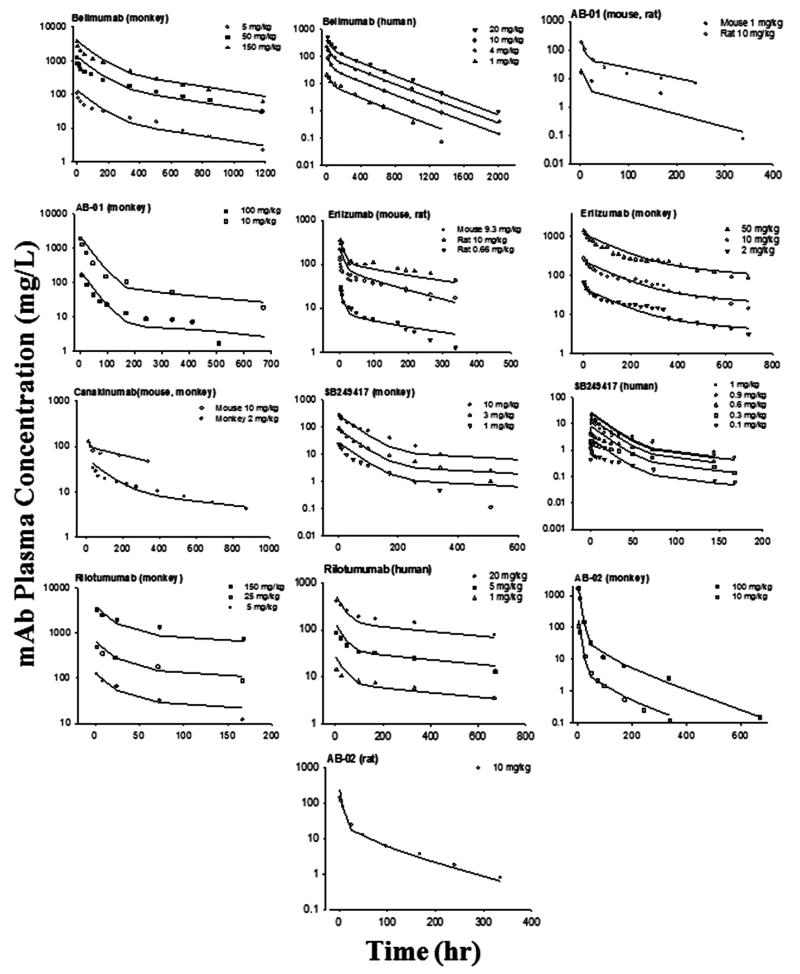
For joint fitting, the PK profiles of 12 mAbs were well-captured by the mAb mPBPK model for various species resulting in estimates of parameters with high precision (CV% < 50%). The fitted profiles are shown in Figures 3 and 4 and the parameters are listed in Table III. In this analysis, we assumed that the parameters derived from the minimal PBPK model are either conserved (σ1 and σ2) or scalable across species (CLp). These physiological components help to reveal the intrinsic factors that are closely related to drug properties and leave the species differences accounted for by physiological parameters. The low CV% values for the parameter estimates indicate good model performance, although fittings for some of the digitized data are only approximate.
Figure 3.
Pharmacokinetic profiles of 5 mAbs across species. Symbols are observations and curves are model fittings.
Figure 4.
Pharmacokinetic profiles of 7 mAbs across species. Symbols are observations and curves are model fittings.
Table III.
Estimated pharmacokinetic parameters (CV%) for 12 mAbs
| Compound | Reflection Coefficients |
Allometric Factors |
||
|---|---|---|---|---|
| σ 1 | σ 2 | a (10−4 L/h) | b | |
| Rituximab | 0.712 (12.0) | 0.467 (8.58) | 3.02 (5.15) | 0.888 (1.40) |
| Dacetuzumab | 0.917 (18.0) | 0.596 (30.2) | 2.81 (31.8) | 0.820 (24.3) |
| RSHZ19 | 0.952 (16.2) | 0.497 (21.4) | 1.85 (12.5) | 0.906 (5.10) |
| Bevacizumab | 0.995 (0.199) | 0.637 (21.3) | 4.07 (38.0) | 0.762 (11.4) |
| Trebananib | 0.999 (<0.01) | 0.258 (11.1) | 8.90 (1.68) | 1.02 (0.536) |
| Belimumab | 0.963 (4.66) | 0.694 (3.84) | 2.32 (12.8) | 1.03 (4.63) |
| AB-01 | 0.999 (<0.01) | 0.464 (43.6) | 8.08 (32.7) | 0.893 (13.7) |
| Erlizumab | 0.990 (9.05) | 0.841 (12.1) | 2.61 (3.18) | 0.844 (1.56) |
| Canakinumab | 0.903 (9.08) | 0.737 (10.2) | 1.69 (5.70) | 0.885 (2.39) |
| SB249417 | 0.990 (<0.01) | 0.654 (8.04) | 4.86 (10.3) | 1.27(2.56) |
| Rilotumumab | 0.796 (<0.01) | 0.577(<0.01) | 4.71 (<0.01) | 0.695 (<0.01) |
| AB-02 | 0.690 (43.7) | 0.526 (41.1) | 23.4 (8.32) | 0.929 (6.76) |
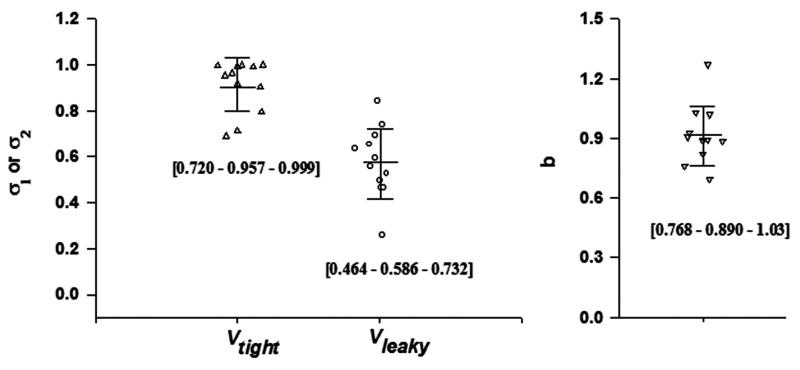
The vascular reflection coefficients were quite consistent across species, but differed among the antibodies: σ1 ranged 0.690 to 0.999 with an average of 0.908, σ2 ranged 0.258 to 0.841 with an average of 0.579 (Figure 5). The estimated ranges of σ are consistent with our survey results of the PK of over 72 antibodies in man (16). In this model, the higher σ indicates greater vascular reflection and lower extravasation rate and extent. Thus, tissues with continuous endothelial vasculature exhibit lesser antibody distribution than tissues with fenestrated or discontinuous vasculature. This distributional feature of antibodies is consistent across species. The CL was reasonably scaled based on body weight. The range for b was 0.695 to 1.27 averaging 0.91 (Figure 5). This differs from the typical value of 0.75 that is commonly found for small molecules. Interestingly, this value is slightly greater than the commonly found value of 0.85 (30) based on scaling NCA-derived clearance (CL = Dose/AUC).
Figure 5.
The estimated parameters of 12 mAbs using the mAb minimal PBPK model with allometric scaling of CLp providing reflection coefficients (σ1 and σ2) for two groups of tissues (Vtight and Vleaky) and allometric exponents (b). Bars represent mean and standard deviation. Numbers in brackets are [10% - 50% - 90%] percentiles.
Comparisons of CL between NCA and mPBPK model fitting are listed in Table IV. The allometric coefficients for clearance (a and b) are generally consistent between these two methods. Compared to NCA, the mPBPK model fitting not only provides clearance values, but also provides a physiologically meaningful use of plasma volume and prediction of antibody distribution in two groups of lumped tissues (asbased on estimated σ1 and σ2). The σ1 and σ2 values shown in Figure 5 and listed in Table III demonstrate the differences in tissue distribution parameters among antibodies.
Table IV.
Comparisons of CL between non-compartmental analysis and mPBPK model fitting
| Non-compartmental analysis | mPBPK | Comparison | |||||||
|---|---|---|---|---|---|---|---|---|---|
|
| |||||||||
| Compound | Mouse | Rat | Monkey | Human | Equation | Prediction CLhuman |
Equation | Prediction CLhuman |
Ratio of Prediction
human CL |
|
| |||||||||
| CL(×l0−4 L/h/kg) | (×10−4 L/h) | (×l0−4 L/h/kg) | (×10−4 L/h) | (×l0−4 L/h/kg) | CLNCA human/ CLmPBPK human |
||||
| Dacetuzumab | 4.58-7.05 | 4.61-4.58 | 5.17 | NA | CL=4.87×BW0.975 | 4.38 | CL=2.81×BW0.820 | 1.31 | 3.34 |
| Rituximab | 5.16-18.2 | 3.17-3.43 | NA | 44.8-49.2 | CL=11.5×BW1.24 | 31.8 | CL=3.02×BW0.888 | 1.87 | 17.0 |
| RSHZ19 | 2.49 | 3.96 | 1.43 | 1.19-1.35 | CL=2.06×BW0.886 | 1.26 | CL=1.64×BW0.867 | 0.92 | 1.36 |
| Bevacizumab | 72.2 | NA | NA | 1.40-1.80 | CL=11.5×BW0.532 | 1.57 | CL=4.07×BW0.762 | 1.48 | 1.06 |
| Trebananib | 7.04-7.63 | 17.4-20 | NA | 1.16-12.1 | CL=5.72×BW0.783 | 2.28 | CL=8.90×BW1.02 | 9.68 | 0.24 |
| Belimumab | NA | NA | 2.48-2.77 | 2.44-2.72 | CL=2.58×BW1.00 | 2.58 | CL=2.32×BW1.03 | 2.63 | 0.99 |
| AB-01 | 7.65 | 17.3 | 9.51-11.3 | NA | CL=11.1×BW1.02 | 12.1 | CL=8.08×BW0.893 | 5.13 | 2.35 |
| Erlizumab | 6.39 | 2.39-3.52 | 2.32-2.48 | 1.17 | CL=2.64×BW0.821 | 1.23 | CL=2.61×BW0.844 | 1.35 | 0.91 |
| Canakinumab | 2.04 | NA | 1.56 | 1.01 | CL=1.54×BW0.918 | 1.09 | CL=1.69×BW0.885 | 1.03 | 1.05 |
| SB249417 | NA | NA | 4.72-7.83 | 21.4-27.2 | CL=3.22×BW1.46 | 22.7 | CL=4.86×BW1.27 | 15.3 | 1.48 |
| Rilotumumab | NA | NA | 4.26-6.56 | 1.23-1.94 | CL=9.48×BW0.563 | 1.48 | CL=4.71×BW0.695 | 1.29 | 1.14 |
| AB-02 | NA | 28.1 | 44.1-51.0 | NA | CL=37.7×BW1.18 | 80.9 | CL=23.4×BW0.929 | 17.3 | 4.67 |
NA: not applicable
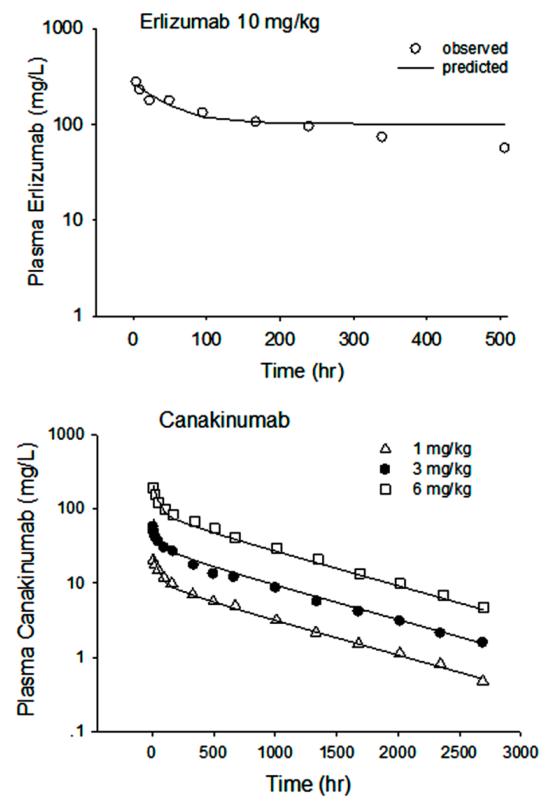
Based on the physiological and PK parameters estimated across animal species for erlizumab and canakinumab, simulations were conducted to predict the PK profiles in man (Figure 6). These case studies indicating how human profiles can be predicted by allometric scaling of preclinical data across species is provided as an example of utilizing the mAb mPBPK model to scale from preclinical animal experiments to man.
Figure 6.
Predictions of human PK profiles of erlizumab and canakinumab from animal data, where erlizumab used mouse, rat and monkey data and canakinumab used mouse and monkey data. Symbols are observations and curves are model simulations.
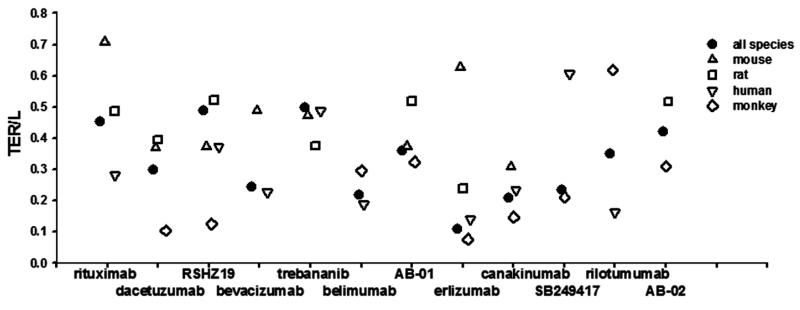
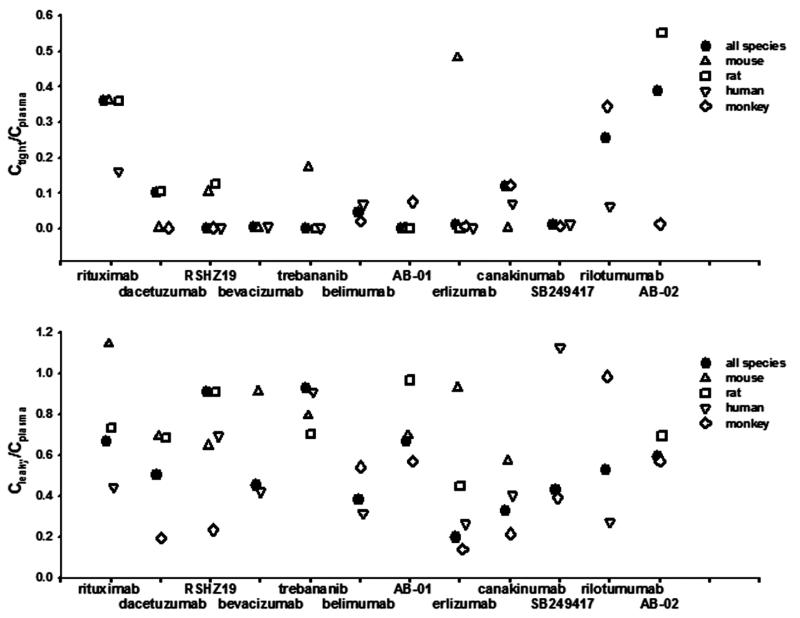
To further explore species differences in tissue distribution, the PK profiles were individually fitted for each species and the species-specific σ1 and σ2 values were estimated. Figures 7 and 8 summarize the predictions of TER, the equilibrium concentration ratios for tissues with tight endothelial junction (Ctight/Cplasma), and for tissues with leaky endothelium(Cleaky/Cplasma). Some antibodies exhibit similar extravasation rate (TER) and bio-distribution among species, such as trebananib and belimumab, while some show considerable species differences. Two-way ANOVA revealed that inter-species varability (F = 1.58, p = 0.204) for Ctight/Cplasma ratios is much smaller than inter-antibody variability (F = 3.35, p = 0.004), indicating higher predictabilities of bio-distribution into tight tissues are expected using species information than using antibody-averaged values. However, despite certain antibodies showing similar bio-distribution into tissues that have leaky endothelium (Cleaky/Cplasma), significant species differences of Cleaky/Cplasma ratios (F = 1.39, p = 0.227) were detected. Although monkey is normally thought to be the most suitable preclinical species, our analysis did not find greater similarity of monkey than other species for presumed bio-distribution.
Figure 7.
Transcapillary extravascular rate/lymph flow (TER/L) for each antibody obtained by joint fitting all species and individual fitting each species. Two-way ANOVA revealed a significant effect of species on TER/L (F = 3.36, p = 0.022), but no significant effect of antibody on TER/L (F = 1.42, p = 0.216).
Figure 8.
Ctight/Cplasma and Cleaky/Cplasma ratios at equilibrium for each antibody obtained by joint and individual fitting each species. Two-way ANOVA revealed a significant effect of the antibody on Ctight/Cplasma (F = 3.35, p = 0.004), but no significant effect of the species on Ctight/Cplasma (F = 1.58, p = 0.204). For Cleaky/Cplasma at equilibrium, no significant effect of antibody on the Cleaky/Cplasma (F = 1.39, p = 0.227) but a significant effect of species on Cleaky/Cplasma (F = 3.03, p = 0.0331).
DISCUSSION
Allometric scaling has been applied for large molecule drugs in some studies using NCA and compartmental model approaches. Mordenti (31) first applied allometric scaling for five therapeutic proteins showing that clearance could be well described using an allometric equation with the clearance exponent close to 0.75. Ling (32) found that simple allometric scaling using three species is useful for mAbs showing either linear kinetics over the tested dose range or receptor-mediated disposition only accounting for a small part of mAb disposition. Wang (4) confirmed that human CL can generally be predicted reasonably well with a fixed exponent of 0.8 in simple allometric scaling. Deng (1) demonstrated that using cynomolgus monkey PK data alone with a fixed scaling exponent of 0.85 could accurately predict mAb clearance in man. Our analysis indicated that the average scaling exponent for CL is around 0.90, but differs across antibodies.
The allometric exponent for CL varied with the modeling approach. This difference may be rooted theoretically. In an ideal situation with highly intensive sampling density, the minimal PBPK model-predicted CL, NCA-inferred CL, and compartmental model-predicted CL all should equal Dose/AUC. However, in practice, the physiological features of the minimal model such as initial dilution space (plasma volume) and tissue distribution mechanism (convection dominated), may make the model-predicted AUC slightly different than NCA-derived AUC, resulting a different estimation of CL. The NCA and compartment models both employ extrapolation for fitting of zero-time (Cp(0)) values, which may result in a biased AUC, particularly when initial sampling is scarce. The biased AUC may further give different predictions of clearance that would partly explain the different estimates of allometric exponents for CL (Table IV). The minimal PBPK model considers that antibodies poorly distribute into blood cells and assumes plasma volume as the initial dilution space. This assumption, also made in full PBPK models, adds greater certainty and stability in fittings of the initial PK decline phases.
One advantage of the mPBPK model is to provide physiologically relevant predictions of antibody distribution in two groups of lumped tissues. This was affirmed by comparisons with actual tissue concentrations from animal studies (15). The NCA or compartmental model approaches fit plasma profiles but reveal little about true tissue distribution for either small or large molecules.
In this model, only four parameters need to be estimated: vascular reflection coefficients σ1 and σ2, and the allometric slope (a) and exponent (b). For joint fittings, assuming all species share the same σ1 and σ2, we applied allometric scaling for 12 antibodies using the mPBPK modeling approach and obtained a mean b value of 0.91, with the range of 0.695 to 1.27. This differs from the mean value of 0.75 for small molecules and their wider distribution (0.3 to 1.2) (30). Using this mean exponent could be helpful for the prediction of clearance using the mAb mPBPK model when PK data from only one species are available.
The vascular reflection coefficients (σ1 and σ2) are specific distribution parameters for the mAb mPBPK model. They are not only associated with vascular permeability rates but also reflect the extent of distribution of mAb in tissues (16, 17). For joint fitting, the vascular reflection coefficients were assumed consistent across antibodies: σ1 ranged 0.690 to 0.999 with an average of 0.908; σ2 ranged 0.258 to 0.841 with an average of 0.579. Assuming the mean values simplifies this scaling approach leaving only clearance to be scaled across species. With this assumption, the model had a good performance for both joint fittings (Figure 3 and 4) and predictions from animals to man (Figure 6). In contrast, in our individual analysis, the vascular reflection coefficient σ2 showed moderate inter-species variability (Figure 8).
The inconsistency between the joint and individual analysis may be related to computational issues. Firstly, joint fitting is more robust than fitting each species separately as more data produces greater certainty in the fitted parameters. Secondly, antibodies are known to have restricted tissue distribution and long blood persistence. These properties usually produce biexponential plasma profiles (Figures 3 and 4) with a short distribution phase (1-2 days) but a long terminal phase (often > 3 weeks). The overall AUC is primarily determined by the latter, while the initial phase is mainly associated with distribution properties. Thus, as long as plasma volume determines Cp(0) and the clearance is well predicted, the model would reasonably characterize the overall profiles. Any bias in σ1 and σ2 values causes deviations in initial phase predictions. This is particularly true when there are limited early data. The insensitivity of the overall PK profiles for σ1 and σ2 may explain the discrepancy in our two stages of analysis. When assuming common σ1 and σ2 values across species in joint fittings, the PK profiles were reasonably captured by the mPBPK model. With the limited available data, this study showed that most antibodies could be handled with common σ1 and σ2 values. For greater clarity on antibody distribution, population-type data from many animals and more intensive early samplings are needed.
Multiple factors can influence mAb distribution and clearance including size, shape, charge, and hydrophobicity (33). An increase of net positive charge is associated with increased tissue retention and systemic clearance (34). A larger molecule generally exhibits less tissue penetration (35). These factors might account for different values of vascular reflection coefficients among the mAbs. Data quality also reflects σ1 and σ2 as sparse data results in problems for their estimation. This model predicts antibody ISF concentrations based on analyzing plasma profiles only and direct measurements of ISF concentrations are needed for confirmation.
There are some limitations of this study due to the assumptions and data sources. Allometric scaling is based on the anatomical power relationship among species. However, species differences in the PK properties of mAbs could include FcRn-binding affinity, target density, as well as the local physiology of target-expressing tissues. Relevant data and evidence is lacking to address these potential limitations in the scaling of PK parameters. Besides insufficient data, factors that might also affect the allometric extrapolation include low numbers of animals and varying bio-analytical methods among different studies. Having specific lymph volumes and flows, ISF volumes, body weights, and other information for each species and study will also improve fittings and predictions.
In conclusion, this study integrated allometric scaling within a basic mPBPK model to successfully analyze the PK of 12 mAbs in several species. In joint analysis, with an assumption of conserved σ1 and σ2 across species, CLp was scalable across species based on body weights. The biexponential plasma profiles were well predicted with this approach. Individual analysis for each species indicated possible inter-species variability of antibody distribution. Reasons for this discrepancy were assessed. This modeling approach, particularly with more extensive and specific data from animal studies, may be useful in species translation of PK and estimation of first-in human (FIH) doses.
Supplementary Material
ACKNOWLEDGMENTS
This research was supported by the National Institutes of Health Grant GM57980 and the UB Center for Protein Therapeutics.
Glossary
- mPBPK
minimal physiologically based pharmacokinetic modeling
- PBPK
physiologically based pharmacokinetic modeling
- mAb
monoclonal antibody
- PK
pharmacokinetic
- FIH
first-in-human
- BW
body weight
- ISF
interstitial fluid
- L
lymph flow
- AIC
Akaike Information Criterion
- SC
Schwarz Criterion
- CV
Coefficient of variation
- NCA
non-compartmental analysis
- AUC
area under the plasma concentration-time curve
Footnotes
Also provided are further references pertaining to the specific antibodies that were modeled and the Adapt computer code used for joint modeling of mAb profiles from two or more species.
REFERENCES
- 1.Deng R, Iyer S, Theil FP, Mortensen DL, Fielder PJ, Prabhu S. Projecting human pharmacokinetics of therapeutic antibodies from nonclinical data: What have we learned? MAbs. 2011;3(1):61–66. doi: 10.4161/mabs.3.1.13799. [DOI] [PMC free article] [PubMed] [Google Scholar]
- 2.Wang W, Wang EQ, Balthasar JP. Monoclonal antibody pharmacokinetics and pharmacodynamics. Clinical Pharmacology and Therapeutics. 2008;84(5):548–558. doi: 10.1038/clpt.2008.170. [DOI] [PubMed] [Google Scholar]
- 3.Mordenti J. Man versus beast: pharmacokinetic scaling in mammals. Journal of Pharmaceutical Sciences. 1986;75(11):1028–1040. doi: 10.1002/jps.2600751104. [DOI] [PubMed] [Google Scholar]
- 4.Wang W, Prueksaritanont T. Prediction of human clearance of therapeutic proteins: simple allometric scaling method revisited. Biopharmaceutics & Drug Disposition. 2010;31(4):253–263. doi: 10.1002/bdd.708. [DOI] [PubMed] [Google Scholar]
- 5.Ritschel WA, Vachharajani NN, Johnson RD, Hussain AS. The allometric approach for interspecies scaling of pharmacokinetic parameters. Comparative Biochemistry and Physiology C, Comparative Pharmacology and Toxicology. 1992;103(2):249–253. doi: 10.1016/0742-8413(92)90003-p. [DOI] [PubMed] [Google Scholar]
- 6.Duconge J, Fernandez-Sanchez E, Alvarez D. Interspecies scaling of the monoclonal anti-EGF receptor ior EGF/r3 antibody disposition using allometric paradigm: is it really suitable? Biopharmaceutics & Drug Disposition. 2004;25(4):177–186. doi: 10.1002/bdd.398. [DOI] [PubMed] [Google Scholar]
- 7.Boxenbaum H, Fertig JB. Scaling of antipyrine intrinsic clearance of unbound drug in 15 mammalian species. European Journal of Drug Metabolism and Pharmacokinetics. 1984;9(2):177–183. doi: 10.1007/BF03189622. [DOI] [PubMed] [Google Scholar]
- 8.Mahmood I, Balian JD. Interspecies scaling: predicting clearance of drugs in humans. Three different approaches. Xenobiotica; the fate of foreign compounds in biological systems. 1996;26(9):887–895. doi: 10.3109/00498259609052491. [DOI] [PubMed] [Google Scholar]
- 9.Lave T, Coassolo P, Reigner B. Prediction of hepatic metabolic clearance based on interspecies allometric scaling techniques and in vitro-in vivo correlations. Clinical Pharmacokinetics. 1999;36(3):211–231. doi: 10.2165/00003088-199936030-00003. [DOI] [PubMed] [Google Scholar]
- 10.Bischoff KB, Dedrick RL, Zaharko DS. Preliminary model for methotrexate pharmacokinetics. Journal of Pharmaceutical Sciences. 1970;59(2):149–154. doi: 10.1002/jps.2600590203. [DOI] [PubMed] [Google Scholar]
- 11.Baxter LT, Zhu H, Mackensen DG, Jain RK. Physiologically based pharmacokinetic model for specific and nonspecific monoclonal antibodies and fragments in normal tissues and human tumor xenografts in nude mice. Cancer Research. 1994;54(6):1517–1528. [PubMed] [Google Scholar]
- 12.Baxter LT, Zhu H, Mackensen DG, Butler WF, Jain RK. Biodistribution of monoclonal antibodies: scale-up from mouse to human using a physiologically based pharmacokinetic model. Cancer Research. 1995;55(20):4611–4622. [PubMed] [Google Scholar]
- 13.Davda JP, Jain M, Batra SK, Gwilt PR, Robinson DH. A physiologically based pharmacokinetic (PBPK) model to characterize and predict the disposition of monoclonal antibody CC49 and its single chain Fv constructs. International Immunopharmacology. 2008;8(3):401–413. doi: 10.1016/j.intimp.2007.10.023. [DOI] [PubMed] [Google Scholar]
- 14.Mann S, Droz PO, Vahter M. A physiologically based pharmacokinetic model for arsenic exposure. II. Validation and application in humans. Toxicology and Applied Pharmacology. 1996;140(2):471–486. doi: 10.1006/taap.1996.0244. [DOI] [PubMed] [Google Scholar]
- 15.Cao Y, Balthasar JP, Jusko WJ. Second-generation minimal physiologically-based pharmacokinetic model for monoclonal antibodies. Journal of Pharmacokinetics and Pharmacodynamics. 2013;40(5):597–607. doi: 10.1007/s10928-013-9332-2. [DOI] [PMC free article] [PubMed] [Google Scholar]
- 16.Cao Y, Jusko WJ. Survey of monoclonal antibody disposition in man utilizing a minimal physiologically-based pharmacokinetic model. Journal of Pharmacokinetics and Pharmacodynamics. 2014;41(6):571–580. doi: 10.1007/s10928-014-9374-0. [DOI] [PMC free article] [PubMed] [Google Scholar]
- 17.Cao Y, Jusko WJ. Incorporating target-mediated drug disposition in a minimal physiologically-based pharmacokinetic model for monoclonal antibodies. Journal of Pharmacokinetics and Pharmacodynamics. 2014;41(4):375–387. doi: 10.1007/s10928-014-9372-2. [DOI] [PMC free article] [PubMed] [Google Scholar]
- 18.Pang KS, Rowland M. Hepatic clearance of drugs. I. Theoretical considerations of a “well-stirred” model and a “parallel tube” model. Influence of hepatic blood flow, plasma and blood cell binding, and the hepatocellular enzymatic activity on hepatic drug clearance. Journal of Pharmacokinetics and Biopharmaceutics. 1977;5(6):625–653. doi: 10.1007/BF01059688. [DOI] [PubMed] [Google Scholar]
- 19.Shah DK, Betts AM. Towards a platform PBPK model to characterize the plasma and tissue disposition of monoclonal antibodies in preclinical species and human. Journal of Pharmacokinetics and Pharmacodynamics. 2012;39(1):67–86. doi: 10.1007/s10928-011-9232-2. [DOI] [PubMed] [Google Scholar]
- 20.Rossing N. Intra- and extravascular distribution of albumin and immunoglobulin in man. Lymphology. 1978;11(4):138–142. [PubMed] [Google Scholar]
- 21.Boxenbaum H. Interspecies pharmacokinetic scaling and the evolutionary-comparative paradigm. Drug Metabolism Reviews. 1984;15(5-6):1071–1121. doi: 10.3109/03602538409033558. [DOI] [PubMed] [Google Scholar]
- 22.Porter CJ, Edwards GA, Charman SA. Lymphatic transport of proteins after s.c. injection: implications of animal model selection. Advanced Drug Delivery Reviews. 2001;50(1-2):157–171. doi: 10.1016/s0169-409x(01)00153-3. [DOI] [PubMed] [Google Scholar]
- 23.Lindena J, Kupper W, Trautschold I. Catalytic enzyme activity concentration in thoracic duct, liver, and intestinal lymph of the dog, the rabbit, the rat and the mouse. Approach to a quantitative diagnostic enzymology, II. Communication. J Clin Chem Clin Biochem. 1986;24(1):19–33. doi: 10.1515/cclm.1986.24.1.19. [DOI] [PubMed] [Google Scholar]
- 24.Davies B, Morris T. Physiological parameters in laboratory animals and humans. Pharmaceutical Research. 1993;10(7):1093–1095. doi: 10.1023/a:1018943613122. [DOI] [PubMed] [Google Scholar]
- 25.Rodionov N. Graph digitizer version 1.9.2000. 2000 http://www.geocities.com/graphdigitizer.
- 26.D’Argenio DZ, Schumitzky A. ADAPT V user’s guide: pharmacokinetic/pharmacodynamic systerm analysis software, Biomedical Simulations Resorce. Los Angeles, CA: 2009. [Google Scholar]
- 27.Vugmeyster Y, Szklut P, Tchistiakova L, Abraham W, Kasaian M, Xu X. Preclinical pharmacokinetics, interspecies scaling, and tissue distribution of humanized monoclonal anti-IL-13 antibodies with different IL-13 neutralization mechanisms. International Immunopharmacology. 2008;8(3):477–483. doi: 10.1016/j.intimp.2007.12.004. [DOI] [PubMed] [Google Scholar]
- 28.Lin YS, Nguyen C, Mendoza JL, Escandon E, Fei D, Meng YG, Modi NB. Preclinical pharmacokinetics, interspecies scaling, and tissue distribution of a humanized monoclonal antibody against vascular endothelial growth factor. The Journal of Pharmacology and Experimental Therapeutics. 1999;288(1):371–378. [PubMed] [Google Scholar]
- 29.Garg A, Balthasar JP. Physiologically-based pharmacokinetic (PBPK) model to predict IgG tissue kinetics in wild-type and FcRn-knockout mice. Journal of Pharmacokinetics and Pharmacodynamics. 2007;34(5):687–709. doi: 10.1007/s10928-007-9065-1. [DOI] [PubMed] [Google Scholar]
- 30.Tang H, Mayersohn M. A novel model for prediction of human drug clearance by allometric scaling. Drug Metabolism and Disposition. 2005;33(9):1297–1303. doi: 10.1124/dmd.105.004143. [DOI] [PubMed] [Google Scholar]
- 31.Mordenti J, Chen SA, Moore JA, Ferraiolo BL, Green JD. Interspecies scaling of clearance and volume of distribution data for five therapeutic proteins. Pharmaceutical Research. 1991;8(11):1351–1359. doi: 10.1023/a:1015836720294. [DOI] [PubMed] [Google Scholar]
- 32.Ling J, Zhou H, Jiao Q, Davis HM. Interspecies scaling of therapeutic monoclonal antibodies: initial look. Journal of Clinical Pharmacology. 2009;49(12):1382–1402. doi: 10.1177/0091270009337134. [DOI] [PubMed] [Google Scholar]
- 33.Bumbaca D, Boswell CA, Fielder PJ, Khawli LA. Physiochemical and biochemical factors influencing the pharmacokinetics of antibody therapeutics. The AAPS Journal. 2012;14(3):554–558. doi: 10.1208/s12248-012-9369-y. [DOI] [PMC free article] [PubMed] [Google Scholar]
- 34.Boswell CA, Tesar DB, Mukhyala K, Theil FP, Fielder PJ, Khawli LA. Effects of charge on antibody tissue distribution and pharmacokinetics. Bioconjugate Chemistry. 2010;21(12):2153–2163. doi: 10.1021/bc100261d. [DOI] [PubMed] [Google Scholar]
- 35.Schmidt MM, Wittrup KD. A modeling analysis of the effects of molecular size and binding affinity on tumor targeting. Molecular Cancer Therapeutics. 2009;8(10):2861–2871. doi: 10.1158/1535-7163.MCT-09-0195. [DOI] [PMC free article] [PubMed] [Google Scholar]
Associated Data
This section collects any data citations, data availability statements, or supplementary materials included in this article.


