

Abstract
Background
Ovarian cancer is the fifth most common cause of cancer deaths in women in the United States. Numerous gene signatures of patient prognosis have been proposed, but diverse data and methods make these difficult to compare or use in a clinically meaningful way. We sought to identify successful published prognostic gene signatures through systematic validation using public data.
Methods
A systematic review identified 14 prognostic models for late-stage ovarian cancer. For each, we evaluated its 1) reimplementation as described by the original study, 2) performance for prognosis of overall survival in independent data, and 3) performance compared with random gene signatures. We compared and ranked models by validation in 10 published datasets comprising 1251 primarily high-grade, late-stage serous ovarian cancer patients. All tests of statistical significance were two-sided.
Results
Twelve published models had 95% confidence intervals of the C-index that did not include the null value of 0.5; eight outperformed 97.5% of signatures including the same number of randomly selected genes and trained on the same data. The four top-ranked models achieved overall validation C-indices of 0.56 to 0.60 and shared anticorrelation with expression of immune response pathways. Most models demonstrated lower accuracy in new datasets than in validation sets presented in their publication.
Conclusions
This analysis provides definitive support for a handful of prognostic models but also confirms that these require improvement to be of clinical value. This work addresses outstanding controversies in the ovarian cancer literature and provides a reproducible framework for meta-analytic evaluation of gene signatures.
Ovarian cancer is the most lethal gynecological cancer and a leading cause of cancer deaths among women, with more than 15000 deaths per year in the United States (1). A majority of patients present with late-stage, high-grade disease, and the ability to distinguish biologically or clinically within this group is limited (2). Numerous efforts to develop molecular signatures that better stratify survival within this group of patients have generated an enormous archive of genomic discovery data; however, it remains difficult to assess which, if any, of these efforts have generated reproducible and clinically relevant prognostic models.
Review papers have provided valuable summaries of proposed genomic prognostic models for ovarian cancer (3–7) but do not address the validity of published models when independently applied to new data. Independent validation can be addressed through meta-analysis by using archives of published data, but such efforts may be hindered by incomplete availability of original genomic and associated clinical data (8), diverse technologies and formats of published data (9), and lack of reproducibility of published models (10,11). However, sufficient archives of microarray data are now available to evaluate published prognostic models by meta-analysis.
We therefore undertook a systematic validation of gene expression–based prognostic models for late-stage, high-grade serous ovarian cancer published between 2007 and 2012 (12–24) in a database of 10 clinically annotated microarray datasets totaling 1251 patients (12,14–18,20,23,25,26). This assessment addresses several important issues for the translation of genomics to clinical application: 1) the accuracy of published prognostic models when applied to new, independent datasets; 2) the impact of choice of validation datasets on apparent prognostic accuracy; 3) similarities between independently developed prognostic models; 4) the influence of popular datasets on the literature; and 5) the recent observation that random gene signatures may have prognostic ability (27). This study additionally addresses published controversies in the ovarian cancer prognostic signature literature by quantitatively placing these studies within their broader context. These controversies include the quality of a highly cited and frequently reused dataset associated with a now-retracted article (26) and the clinical relevance of a DNA damage repair-based prognostic model (19,28). Finally, evaluation of these prognostic models uncovered common pathways enriched for correlation with the most accurate prognostic models.
Methods
Our evaluation combines four major phases: 1) systematic literature review for selection of both eligible genomic datasets and eligible prognostic models; 2) transparent reimplementation of risk prediction models identified by the literature review; 3) evaluation of the reproducibility of models in independent data; and 4) a multistudy validation of the published models using meta-analytic methods. We performed statistical analyses using R 3.0.1 (R foundation for Statistical Computing, Vienna, Austria) and Bioconductor 2.12 (Bioconductor Core Team, Seattle, USA). Specific libraries are discussed within this section.
Eligibility Criteria and Implementation of Prognostic Models
We considered prognostic models that: were claimed to have prognostic value for cohorts of late-stage serous ovarian cancer patients; generated a continuous risk score (specifically, this excluded discrete “subtyping”); were based on the expression of multiple mRNA transcripts; were developed from a training set of at least 40 patients; were either trained or tested using microarray data; were fully specified or could be reimplemented from original data and methods, and were published within the 5 years preceding June 30, 2012. Published models were reimplemented as described by the original publication. Some modifications to the original models were necessary for cross-platform validation, including translating probe set identifiers to standard gene symbols and removing platform-specific thresholds. Where possible, these reimplementations were verified by reproducing a result from the original publication of the model (Table 1; full code and details provided in the Supplementary Data, available online).
Table 1.
Reproducibility of the 14 published models for prognosis of late-stage epithelial ovarian cancer selected for meta-analysis*
| Model | Reproducibility† | |||
|---|---|---|---|---|
| Model provided | Training data available | Validation data available | Verified implementation | |
| TCGA11 (12) | Yes | Yes | Yes | Yes |
| Denkert09 (13) | Yes | Yes | Yes | Yes |
| Bonome08_263genes (14) | Yes | Yes | Yes | Yes |
| Bonome08_572genes (14) | Yes | Yes | Yes | Yes |
| Mok09 (15) | No | Yes | Yes | Partially |
| Yoshihara12 (16) | Yes | — | Yes | Yes |
| Yoshihara10 (17) | Yes | — | Yes | Yes |
| Bentink12 (18) | Yes | — | Yes | Yes |
| Kang12 (19) | Yes | Yes | Yes | Partially |
| Crijns09 (20) | No | Yes | No | No |
| Kernagis12 (21) | Partially | Yes | Yes | Partially |
| Sabatier11 (22) | Partially | No | No | No |
| Konstantinopoulos10 (23) | Yes | — | Yes | Partially |
| Hernandez10 (24) | Partially | — | Yes | Partially |
* The term “prognostic model” refers here to a list of genes along with a fully specified algorithm for producing a risk score for each patient. The term “prognostic signature” refers to the list of genes only. The reproducibility assessments shown here represent our ability to reimplement published models, rather than an assessment of reproducibility of findings of the publication.
† Aspects of model reproducibility: Model provided: We were able to implement a fully specified model using gene identifiers and coefficients provided in the published paper. Training data available: Primary data were available to permit development of this model using methods described by the authors. Validation data available: Data were available to validate our implementation by reproducing a result from the paper. Verified implementation: we were able to reproduce validation results from the published paper using our implementation of the model. “—“ indicates that this step was unnecessary and we did not attempt it. If we were able to use the fully specified model as provided in the article, then we considered developing the fully specified model from data and methods to be optional. The details of this process are provided as Supplementary Data (available online).
Eligibility Criteria for Datasets and Samples
We used microarray data in the public domain that provided: microarray expression data for collections of primary patient tumors consisting mostly or entirely of late-stage, high-grade, serous histology; continuous time to death with censoring information, and at least 40 samples and 15 deaths after removing early-stage, low-grade, or nonserous histology samples. Samples missing individual annotation for stage, grade, or histology were not excluded, so long as these could be assumed to be likely late-stage, high-grade, serous samples. The analysis was repeated excluding any samples not explicitly labeled as late-stage, high-grade, serous histology to assess the impact of incompletely annotated samples on summary results.
Information Sources
Prognostic models were identified through PubMed searches, review articles (3–7), and searches of publicly available data (29). The Dressman 2007 article (26) was retracted in 2012 (30) because incorrect chemotherapy response annotations, initially discovered by Baggerly and Coombes (31), compromised results of the initial paper. The survival data used for this analysis were unchallenged (32), and the curatedOvarianData database (29) used for this analysis provides data downloaded after the authors posted corrected data in 2008 (32). We also repeated the analysis excluding this dataset to assess its impact on prognostic model rankings.
Search
The following terms were used to search Pubmed: ({“ovary tumor” OR “ovary cancer” OR “ovary tumour” OR “ovary carcinoma” OR “ovarian tumor” OR “ovarian cancer” OR “ovarian tumour” OR “ovarian carcinoma”} AND {“genechip” OR “microarray” OR “expression profiling” OR “expression array” OR (“gene” AND “expression”)} AND {“outcome” OR “survival” OR “survivors” OR “prognosis” OR “prognostic” OR “resistance” OR “resistant”} AND {“signature” OR “score” OR “profile”} AND 2007/06/30:2012/06/30 [dp]) AND “English”[Filter] NOT “review”[PT].
Study Selection
Papers returned by the PubMed search were reviewed by L Waldron; rationale for each exclusion is provided in Supplementary Table 1 (available online).
Data Collection Process
Published microarray and clinical data were downloaded, curated, and processed as described by Ganzfried et al. and are available as the curatedOvarianData Bioconductor package (29) (version 1.0.1). Except where prohibited by a published model algorithm (13), expression of each gene was log2-transformed and scaled to zero mean and unit variance within each dataset.
Duplicate Removal.
We identified probable duplicate specimens within and between all datasets in the curatedOvarianData package using the doppelgangR package with default settings (https://github.com/lwaldron/doppelgangR, version 0.4.6). This method uses all pairs of samples within a dataset or between two datasets to estimate the distribution of correlations and identifies outliers in the upper tail of the distribution. To identify duplicates across datasets, we first used a ComBat batch correction (33), as per the sva Bioconductor package version 3.6.0, separately for each pair of datasets, using dataset as the batch variable. Next we identified outlier pairs by performing Fisher’s transformation (34) to all pairwise sample correlations and setting an upper threshold at a cumulative probability of 0.005 divided by the number of sample pairs in the upper tail of the normal distribution with mean and standard deviation estimated from the Fisher–transformed correlations. This approach identified, among others, 40 pairs of duplicate Affymetrix microarray profiles within The Cancer Genome Atlas (TCGA) ovarian cancer study, which, to the best of our knowledge, have not been identified by other investigations of this dataset. These duplicates had discordant clinical metadata, so we investigated them further by comparing these profiles to the corresponding Agilent microarray profiles and copy number profiles. The duplication apparently did not occur in these other platforms because each duplicated Affymetrix profile matched well to the Agilent and copy number profiles of one of the patient pair but not the other. This allowed us to select with confidence which of the patients had an incorrect Affymetrix profile and to remove these profiles from our study. We inspected all potential duplicates flagged by this process and removed probable false positives from the duplicates list. Results of the database-wide search for duplicates, showing which samples were removed from analysis, are provided in Supplementary Table 2 (available online).
Potential Bias in Individual Studies
The possibility of optimistic bias in individual studies was minimized by estimating summary measures for prognostic models using independent expression and survival data on an independent set of patients. In the assessment of each model, we did not use summary measures provided by original study authors or data used by original study authors to generate that prognostic model.
Summary Measures
We assessed each model for concordance of risk scores with overall patient survival, using Uno’s version of the concordance index (or C-index). The C-index is interpretable as the probability that a patient predicted to be at lower risk than another patient will survive longer than that patient: its expected value is 0.5 for random predictions and 1 for a perfect risk model. We calculated point estimates and 95% confidence intervals (CIs) using the survC1 R package version 1.0–2 (35), with tau equal to 4 years and iterations equal to 1000. We choose tau equal to 4 years because it is the combined median survival time of all study participants rounded to the nearest year. Uno’s C-index and confidence interval are robust to the choice of tau unless very few deaths or censoring events occur at times greater than tau (35).
Synthesis of Results
We synthesized point estimates and confidence intervals of the C-index across validation datasets using a weighted average of performance in each dataset, with weights equal to the inverse of the variance of each estimate. Our method corresponds to a fixed-effects meta-analysis; we also performed a random-effects meta-analysis that may account for heterogeneity of C-indices across studies. Synthesis was performed using the rmeta R package version 2.16. Models were ranked by the synthesized point estimate of the C-index, excluding the training datasets of each model.
Potential for Bias Across Studies
To assess whether the choice of validation datasets affects validation results, we calculated the synthesized C-index for each model using 1) only validation data presented by the model authors and 2) excluding validation data presented by the model authors. We tested the null hypothesis of no influence of validation dataset choice by Wilcoxon signed-rank test between these two vectors of synthesized C-indices.
Because of extensive overlap in specimens, the Yoshihara datasets were excluded as validation sets for both Yoshihara et al. (16,17) models as a safeguard against overfitting in case any duplicate samples were not identified.
Additional Analyses
Assessing Improvement Over Known Prognostic Factors.
We also assessed whether the classification ability of the models is independent of age and optimal cytoreductive surgery (debulking), by stratifying patients into old (aged >70 years at diagnosis) vs young and optimal vs suboptimal debulking. Within each dataset, the C-index was calculated within each of the four combinations of these subgroups (old–optimal, old–suboptimal, young–optimal, and young–suboptimal) and then synthesized as described above.
Analysis of Batch Effects.
Evidence of confounding between overall survival and batch was assessed within datasets by log-rank test. Known batches (batch number for TCGA, processing date for Affymetrix-based studies) were used as provided by the “batch” variable in the curatedOvarianData package. For sensitivity analysis of the effect of batch correction, batch correction was performed using ComBat (33) in datasets for which a batch variable was available.
Model Similarity.
The risk scores produced by each model were assessed for similarity by Spearman correlation, calculated within each dataset, and then averaged across datasets weighting by sample size. For visualization, predictions were quantile-normalized within each test dataset to a single common reference distribution. Models were clustered using the Spearman correlation distance metric. Similarity of gene membership between each model pair was assessed by Jaccard index (36).
Gene Set Enrichment Analysis.
For each prognostic model, we computed the absolute Spearman rank correlation between the corresponding risk scores and gene expression profiles of each patient. For each study, we generated a vector of correlations of the 6138 genes present on every microarray platform and computed a weighted average across studies, with weights given by the study sample size. We used the absolute value of the resulting vector to evaluate the enrichment of gene sets for each model’s score, using a preranked gene set enrichment analysis (37). We used the Java implementation (gsea2-2.08) with the parameter xtools.gseas.GseaPreranked against 375 KEGG and oncogenic gene signatures in mSigDB version 3.1, with 1000 permutations. We plotted negative logs of false discovery rate, focusing on sets with false discovery rate less than 0.01 in at least one prognostic model.
Gene Set Improvement Over Random Signatures.
We generated risk scores for each signature using coefficients sign (βj), where βj is the coefficient of gene j in a univariable Cox regression; sign (x) = 1 if x > 0 and –1 otherwise. For a given signature, this algorithm creates a score with a straightforward interpretation by defining each gene as a “good-prognosis gene” or a “bad-prognosis gene.” At the same time it provides independent validation performance comparable with the fitted coefficients for each gene (38). We repeated the analysis using the actual coefficients βj [ie, Tukey’s compound covariates predictor (39)] to assess the robustness of results to the equalization of gene weights. The C-index was estimated for each of the 90 (10×9 = 90) combinations of training and independent validation sets. This “leave-one-in” independent validation process was repeated for 10 random gene sets of the same size as the gene set of interest, and the improvement over random signatures (IOR) score was defined as the fraction of training/validation combinations in which the C-index based on signature genes was greater than the C-index based on random genes. Ten random gene sets provided 900 (10×90 = 900) comparisons, sufficient to provide a stable estimate of the IOR score. For plotting, we calculated the mean C-index across all combinations of training and allowable validation datasets. Similarly, we calculated a mean C-index for 100 random gene signatures of size evenly distributed across the range of the published gene signature sizes.
Statistical Analysis and Reproducible Research
All tests of statistical significance were two-sided. Published models were implemented by Sweave literate programming (40). We developed the curatedOvarianData Bioconductor package version 1.0.1 (29) to organize all curated expression and clinical data, the survHD Bioconductor package (https://bitbucket.org/lwaldron/survhd, version 0.99.1) to define and evaluate published survival models, the HGNChelper R package version 0.2.2 to identify and correct invalid human gene symbols in published models, and the doppelgangR Bioconductor package (https://github.com/lwaldron/doppelgangR, v0.4.6) to identify potentially duplicated tumor specimens in the database. The accuracy of the data and each model implementation were confirmed, whenever possible, by reproducing results from relevant publications (Table 1; Supplementary Data, available online). Computation was defined as a pipeline in the Scientific Workflow Environment (http:// huttenhower.sph.harvard.edu/sfle), so it can be fully regenerated by a single command. All analyses were performed in R/Bioconductor (41). Issue tracking, code, and instructions to reproduce all results are available at https://bitbucket.org/lwaldron/ovrc4_sigvalidation.
Results
We performed a systematic review and evaluation of prognostic gene expression signatures for late-stage, high-grade, serous ovarian cancer using overall survival as the endpoint. A search for prognostic signatures yielded 101 results (Supplementary Table 1, available online), including 14 prognostic models that passed our study inclusion criteria and could be implemented (Table 1). We evaluated both prognostic signatures, the term we use to refer to a simple list of genes, and prognostic models, which we use to refer to the list of genes in combination with a fully specified algorithm for calculating a risk score for each patient. We validated each model in a database of 1251 microarray profiles from 10 studies selected for predominance of late-stage, high-grade, serous ovarian tumors (Table 2). Model performance was synthesized across studies by fixed-effects meta-analysis, which produced results indistinguishable from random-effects meta-analysis (Supplementary Figure 1, available online). The genes used in each model were further assessed for prognostic value independently of the authors’ choices of training data and methods. Finally, we identified a tendency for published models to perform better in validation sets used by the authors of each model than in other available validation sets. The complete analysis process is summarized in Figure 1.
Table 2.
Ten public microarray datasets used for validation of published risk scores*
| Dataset | Accession | No. of samples | No. with incomplete annotation | Microarray platform | Median survival, mo. | Median follow-up, mo. | Censored, % |
|---|---|---|---|---|---|---|---|
| TCGA (12) | TCGA | 413 | 12 | Affymetrix HT U133a | 41 | 54 | 44 |
| Bonome (14) | GSE26712 | 185 | 0 | Affymetrix U133a | 46 | 90 | 30 |
| Mok (15) | GSE18520 | 53 | 0 | Affymetrix U133 Plus 2.0 | 25 | 140 | 23 |
| Yoshihara 2012A (16) | GSE32062 | 91 | 0 | Agilent G4112a | 104 | 56 | 56 |
| Yoshihara 2010 (17) | GSE17260 | 43 | 0 | Agilent G4112a | 46 | 45 | 49 |
| Bentink (18) | E.MTAB.386 | 127 | 0 | Illumina HumanRef-8 v2 | 42 | 53 | 43 |
| Crijns (20) | GSE13876 | 98 | 13 | Operon Human v3 | 25 | 64 | 27 |
| Konstantinopoulos† (23) | GSE19829 | 42 | 42* | Affymetrix U95 v2 | 45 | 50 | 45 |
| Tothill (25) | GSE9891 | 140 | 2 | Affymetrix U133 Plus 2.0 | 40 | 40 | 49 |
| Dressman (26) | PMID17290060 | 59 | 4 | Affymetrix U133a | 42 | 94 | 39 |
| Total | 1251 | 73 | 42 | 57 | 41 |
* The number of samples indicates those remaining after removing samples annotated as early-stage (I–II), low-grade or grade 1–2, or nonserous histology. Median survival and follow-up times refer to Kaplan–Meier and reverse Kaplan–Meier estimates, respectively, and “% censored” is the percentage of patients alive at the date of last follow-up after excluding patients annotated as having low-grade, early-stage, or nonserous histology.
† These samples are not individually annotated for grade, stage, or histology, but the publication (23) states that only 10 of 70 tumors are grade 1–2, five are clear cell or endometroid, and three are stage II; here only the 42 samples assayed by Affymetrix U95 v2 microarray are used. Other incompletely annotated samples were of unknown stage (n = 4) or grade (n = 28). We chose not to exclude these cases because the large majority of cases in these studies were late-stage, high-grade tumors.
Figure 1.
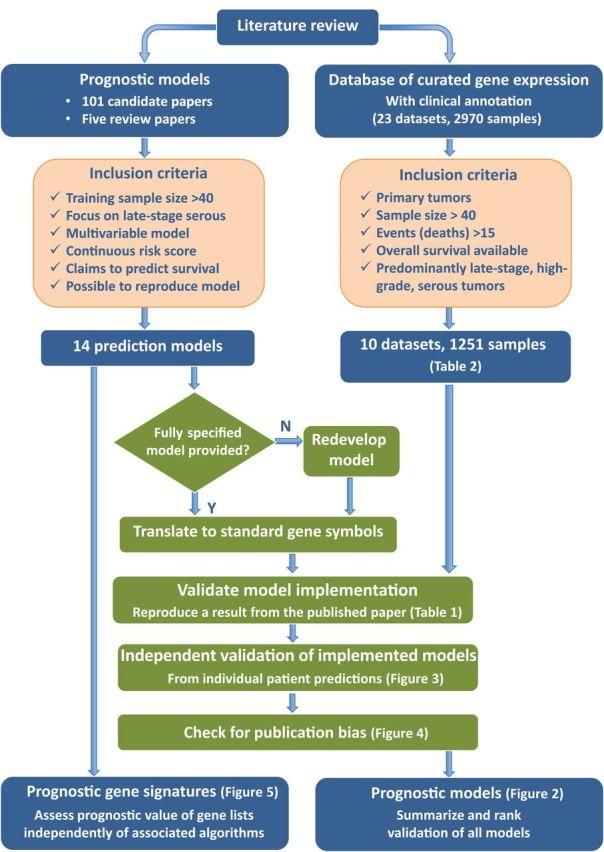
Methodology for the systematic meta-analysis of ovarian cancer prognosis models. This outlines methodology for comparative evaluation of published genomic risk scores using a database of publicly available expression data.
Reproducibility and Implementation of Published Models
We implemented the 14 risk prediction models in a standardized framework that enabled risk prediction and validation in independent patient cohorts. Nine of these models could be implemented from provided specifications (eg, parameter values; see Methods); the remaining five were reimplemented from published descriptions and data. These implementations could be verified by reproducing a published result (eg, a figure or numeric value) precisely for seven models and approximately for an additional five of the 14 models (Table 1). These five models could be only partially verified for two reasons: 1) one study (21) did not provide platform-specific thresholds that were used in the implementation of the model (although our implementation resulted in an improvement in model performance compared with the original validation); and 2) four studies (15,19,23,24) provided sufficient information for generating models, but the prediction accuracy of the model we implemented was lower than that reported in the original publication. In addition, two implementations could not be verified because validation data were not available (20,22).
We believe we closely implemented the 14 published models, including those for which test data were unavailable or some model parameters were unreported. These efforts are summarized in Table 1, and full details are provided as a comprehensive Sweave-generated (40) document (Supplementary Data, available online).
Sensitivity Analysis
We assessed the sensitivity of synthesized performance results to the choice of random-effects or fixed-effects meta-analysis, the inclusion of 59 samples from the retracted Dressman (26,30) dataset, the inclusion of 73 samples missing annotation for stage, grade, or histology, and batch correction of microarray data using the ComBat (33) method. These alternative analyses had no important impact on the summary performances and rankings of prognostic models (Supplementary Figure 1, available online).
Evaluation of Published Models on Independent Data
We assessed the prognostic accuracy of each model in each dataset by C-index and excluded training datasets from the synthesis of validation statistics for each model (Figure 2). The top-ranked four models are those of the TCGA consortium (12), Bonome et al. (optimally debulked patients) (14), and two scores proposed in separate publications by Yoshihara et al. (16,17). These achieved summary C-indices between 0.56 and 0.60. Twelve of 14 models predicted better than chance, with summary C-indices varying between 0.54 and 0.60. Direct comparison of the TCGA and Yoshihara et al. (16) models by Cox regression, excluding the TCGA and both Yoshihara datasets, with risk scores dichotomized at the median within each validation set, showed hazard ratios of 0.58 (95% CI = 0.48 to 0.72) and 0.56 (95% CI = 0.46 to 0.68), respectively (Supplementary Figure 2, available online).
Figure 2.
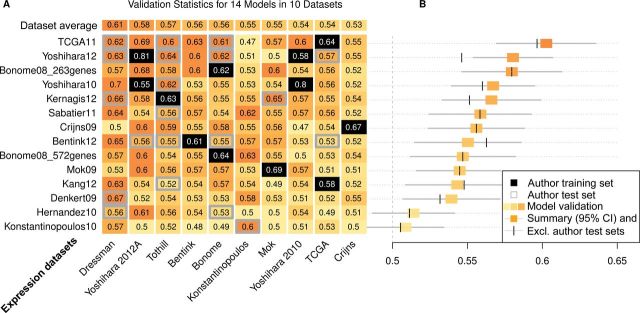
Performance assessment of published risk scores. Citations for models and expression datasets are provided in Tables 1 and 2, respectively. A) Concordance statistic (C-index) for prediction of overall survival by each of the 14 models in each of the 10 microarray datasets. Datasets used for training a model are shown in black; datasets used by the authors of a model for testing are bordered in gray. Darker shades of orange correspond to better predictions. C-index is expected to be 0.5 for a random risk score, and 1.0 corresponds to a model that predicts the exact order of deaths correctly. Models are ordered from top to bottom by best to worst summary C-index, and datasets are ordered from left to right by average C-index for all models not trained on that dataset. That means prediction models in general validated well in Dressman et al. dataset (26) and models that validated in multiple other datasets did not validate in The Cancer Genome Atlas (TCGA, (12)) or Crijns dataset (20). B) Summary C-index for each model with training datasets excluded (orange boxes) and with test sets presented by the authors also excluded (vertical bars). 95% confidence intervals (CI; gray lines) were obtained from resampling of cases. The top-ranked model is that proposed by the TCGA Consortium, and this dataset is conversely one of the most difficult for prediction by other models not using it for training.
Stratification by Known Prognostic Factors
The C-index was also estimated while stratifying for age (dichotomized at 70 years) and optimal cytoreductive surgery (debulking) in the four datasets (12,14,18,25) where these factors were available. For these datasets, most models had very similar synthesized C-index with or without stratification by these known prognostic factors. Overall, our results suggest that prognostic models have the ability to classify patients independent of age and debulking status. The largest changes from stratification were actually improvements for several models (12,17,23,24). Synthesized C-indices of the 14 prognostic models in these four datasets, with and without stratification, are provided in Supplementary Table 3 (available online).
Systematic Differences Between Validation Datasets
The 10 datasets varied in how well prognostic models were seen to validate in each. The dataset of Dressman et al. (26,30) generated the highest validation statistics (average C-index = 0.61) (Figure 2). This dataset showed substantial confounding between run batch and overall survival (P < .001, log-rank test) (Supplementary Figure 3, available online), providing a likely explanation for its high validation statistics. Excluding this dataset had negligible effect on the meta-analysis summaries (Supplementary Figure 1, available online). Weak evidence of such confounding was also present in the dataset of Tothill et al. (25), which showed the second-highest average validation statistic (P = .07, log-rank test). No evidence of confounding was seen in the other four datasets for which a batch variable was available. Conversely, no dataset stood out as producing exceptionally low validation statistics, although the only dataset generated by a two-color custom microarray produced the lowest mean C-index (C = 0.53) (20).
Functional Interpretation of Prognostic Models
We clustered the 14 models by correlation of risk scores across all 1251 patients and compared this with the overlap of genes used by the models (Figure 3). Gene overlap was no more than approximately 2% for any two models (Jaccard index). However, the correlation between risk predictions was greater than 0.6 between the models of Denkert et al. (13), Bentink et al. (18), and Kernagis et al. (21) and greater than 0.55 for the top-ranked TCGA (12) and fourth-ranked 263-gene Bonome et al. (14) models. Gene set enrichment analysis of genes ranked by correlation to risk scores identified distinct KEGG pathways (Supplementary Figures 4 and 5, available online). As expected, extracellular matrix pathways are enriched for genes with high correlations to the Bentink et al. (18) angiogenesis score, and DNA replication and base excision repair gene sets are enriched for genes with high correlation to the Kang et al. (19) DNA damage repair pathways score. Several immune response pathways are enriched for genes correlated to all four top-ranked risk scores (Supplementary Figure 4, available online). These immune response pathways contained large numbers of highly coexpressed human leukocyte antigen genes, meaning that high expression of these genes corresponded with good prognosis according to these models. The allograft rejection pathway is shown as a representative example in Supplementary Figure 5 (available online).
Figure 3.
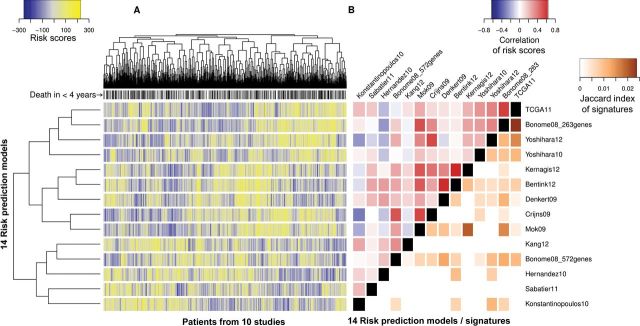
Similarity of risk predictions, models, and gene signatures. Citations for models are provided in Table 1. A) Quantile normalized risk predictions from each model for all 1251 patients in the database. Yellow indicates high predicted risk, and blue indicates low predicted risk. Models and patients are clustered by Spearman correlation of predicted risk. Patients who died within 4 years are labeled in black along the top. B) Spearman correlation heatmap of the risk scores produced by the 14 models, along with similarity of genes represented in each model, as calculated by Jaccard index (intersection divided by union of genes). Although the highest overlap between gene signatures is just greater than 2%, some of these models produce highly correlated risk predictions (ρ > 0.5). Gene overlap and correlation between risk scores are associated (ρ = 0.40; 95% confidence interval = 0.21 to 0.56).
Influence of Validation Datasets
To assess whether the choice of validation datasets affects validation results, we compared the performance of models in validation datasets presented in their publication to performance in new datasets. Under the null hypothesis of no influence, validation sets presented by authors are expected to be no better or worse than other validation datasets. The summary performance of eight of 10 models was better in author-selected validation datasets (Figure 4) than other datasets, providing marginal evidence of such influence in the literature (P = .06, Wilcoxon signed-rank test).
Figure 4.

Publication bias toward prognostic models with favorable independent validation. Citations for models are provided in Table 1. We calculated the meta-analysis concordance statistic (C-index) for each model whose publication presented independent validation using 1) only test datasets presented in the original publication of the model and 2) all available data not used in the original publication. Error bars indicate 95% confidence intervals for the C-index. Of 10 models that presented validation in test data, eight performed better in these test datasets than in datasets not used in the original publications (P = .06, two-sided Wilcoxon signed-rank test).
Prognostic Performance of Gene Signatures Relative to Random Gene Signatures
We draw a distinction between a prognostic tool, as an algorithm that produces a risk score given an expression profile (and in most cases requires coefficients), and a prognostic signature, as a list of genes associated with patient outcome or with other related biological features (such as angiogenesis or DNA damage repair). We assessed prognostic performance of the gene signatures used in each published model independently of the original training dataset or proposed algorithm. Each gene signature was used to train and evaluate models on all combinations of training and independent validation datasets using a prediction algorithm that weights all genes equally and bases risk scores only on whether genes are associated with good or bad prognosis. This method meets two methodological requirements: 1) that it should be as simple as possible and 2) that it perform comparably to established statistical learning approaches. We documented the statistical properties of this method previously (38). An IOR score was assigned to represent performance of the gene signature relative to random gene signatures of equal size subjected to the same procedure. Average C-index over all training/validation dataset combinations for the published models and 100 random signatures is shown in Figure 5. To assess the robustness of these findings to the choice of scoring system, we added a parallel analysis using Tukey’s compound covariates predictor (39) instead of the proposed equal weight method (Supplementary Table 4, available online). Correlation of the two IOR scores was 0.95, and the conclusions are essentially unchanged.
Figure 5.
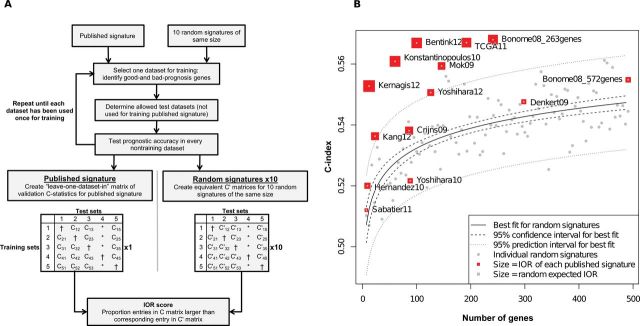
Prognostic (improvement over random signatures (IOR) score of gene signatures relative to random gene signatures, equalizing the influences of authors’ algorithms for generating risk scores, quality of the original training data, and gene signature size. A) Methodology for comparing prognostic quality of gene sets to random gene sets. A simple risk score, defined as the sum of expressions of bad-prognosis genes minus the sum of expressions of good-prognosis genes, was trained and evaluated using all allowable combinations of training and independent validation sets. The IOR score is the fraction of training/test set combinations in which the gene signature achieves a higher concordance index (C-index) than random gene signatures of the same size. It is expected to be 0.5 for a random gene signature and 1 for a gene signature that is better than random signatures in all available training/test set combinations. *Author training sets are excluded. †Cross-validation statistics are not used. B) Gene set improvement over random signatures. Citations for gene signatures are provided in Table 1. Average C-index for all training/test set combinations is plotted against the number of genes in the signature. For visualization, these averages are compared with the equivalent procedure repeated for 100 random gene sets (gray dots). Solid line is the quadratic best-fit line to C-index vs number of genes for random signatures; dashed line is the 95% confidence interval for the best-fit line; and dotted lines are the 95% prediction interval for expected average C-index of individual random gene signatures.
An increase in ranking of the gene signature in Figure 5 relative to the published model in Figure 2 indicates good gene selection but a suboptimal model for using these genes to generate risk scores. Eight of 12 gene signatures showed better prognostic utility than 97.5% of random gene signatures, and the gene signatures of top-performing models (12,14,16) also ranked highly. Two signatures showed substantially improved ranking compared with their fully specified models: Bentink (18) and Konstantinopoulos (23). These were developed based on hypotheses other than association with survival, indicating that these hypotheses may be directly or indirectly related to patient outcome but that survival prediction using these genes benefitted from using survival outcome directly for model development. Most other gene signatures showed prognostic improvement over random signatures (evidenced by being above the best-fit line for random signatures and by having IOR scores better than the random expected value of 0.5) but not above the expected upper bound for 97.5% of random gene signatures.
Discussion
Genomic research on ovarian cancer has produced numerous published microarray studies with the common objective of stratifying patients by probable clinical outcome [reviewed, for example, by (4)]. The value of generating prognostic signatures is twofold: 1) to provide accurate information for patients and to help physicians tailor therapies and 2) to help identify pathways of importance, which then can be targeted for effective therapies. To date these efforts in ovarian cancer have not accomplished either goal.
There are multiple reasons for this lack of progress. Some of the more important ones include heterogeneous and difficult to reproduce methodology, inconsistently shared data, and a lack of directly comparable evaluations. These issues are common in high-throughput experiments and have been recently addressed (42–44). This study attempts to validate every current major prognostic model for advanced-stage, serous ovarian cancer and to provide an easily implemented bioinformatic algorithm that can be used to assess future prognostic signatures for ovarian or other cancers. This systematic evaluation required substantial initial effort to curate the relevant published data and to reimplement published prognostic models.
Our analysis reveals a wide range of accuracy of published prognostic models and signatures. Four of the models considered were intended to predict some biological function thought to be related to patient survival; these were all in the bottom half of the rankings (18,19,23,24). Conversely, the top-performing models were developed by “agnostic” approaches using standard Cox-based statistical methods: simple weighted averages of good- and bad-prognosis genes (12,14) and penalized regression (16,17). These top-ranked models benefitted from the largest training cohorts. Two hypothesis-based signatures (18,23) performed substantially better when these genes were used to train survival models by Cox regression, further indicating the importance of survival analysis when attempting to predict survival by multiple-gene signatures.
How high of a C-index is needed for a useful prognostic tool depends on the clinical context. For example, the C-index of the Gleason score for prostate cancer has been estimated at 0.74 to 0.76 (45) and that of the American Joint Committee on Cancer colorectal cancer staging system at 0.62 (46). The utility of these tools lies in the provision of prognostic information to patients, as well as in the clear delineation of subgroups that can benefit from different treatment. For the former, even the best model identified in this study would require at least a doubling of the C-index to become equally accurate to the Gleason score. However, it is important to note that this may be reachable. In a parallel study undertaken by our group, we observed such an improvement for a predictive model for suboptimal debulking when converting the microarray tool to quantitative reverse-transcription polymerase chain reaction (47). A greater challenge is the expectation of subgroup identification. In this respect, treatment options for late-stage, high-grade, serous ovarian cancer are lacking, with all patients being treated with carboplatin and paclitaxel. Thus, a prognostic signature would need to accurately identify those women with refractory disease (persistent or progressive disease after initial therapy) from the majority of women with advanced-stage, high-grade ovarian cancer. Identification of these patients would provide the possibility of creating phase II trials testing novel agents that might be effective for these poor-prognosis patients and should be a focus of future development of ovarian cancer prognostic tools.
Functional analysis of all genes, ranked by correlation to a risk score, was more informative than functional analysis of genes comprising the signature. The four top-ranked risk scores were negatively correlated with immune response pathways containing human leukocyte antigen genes (ie, high expression of these genes was associated with good prognosis), whereas lower-ranked models were uncorrelated or positively correlated to these pathways. Notably, this association was apparent from the predicted risks rather than the individual genes used to generate the risk score, and none of these publications identified these proposed signatures as immune associated. Further work is needed to establish how these pathways influence survival and whether it is tumor or stromal expression that impacts survival.
This work helps to clarify two controversies in the ovarian cancer genomic literature. The first relates to the quality of the Dressman et al. (26) dataset, which underwent a correction (32) and was criticized by Baggerly and Coombes (31) because of confounding between batches and outcomes. We repeated our analysis of signatures as lists of genes shown in Figure 5 using only the Dressman dataset as training, and we observed that top-ranking published signatures still performed better than random signatures, suggesting that gene expression profiles and survival data in the Dressman study are consistent with those of other studies. We also confirmed the importance of the run batches. To establish how much this batch effect might impact validation in this dataset, a comparable independent dataset is required. In our study, when used in validation, the Dressman dataset produced consistently higher C-indices, indicating that validation results based on this dataset alone are likely to be optimistic. This tendency and the frequent reuse of the Dressman dataset in the literature highlight the importance of both rigorous study design and of direct comparative evaluation of newly proposed gene signatures against existing signatures or random signatures. Without such comparative evaluation, a confounded validation dataset may introduce systematic biases in the literature and could potentially lead to preferential publication of the models that best predict a technical artifact. Such bias can occur without knowledge or intent by authors or publishers. The same potential for batch effects to introduce bias exists for other high-throughput data types (48); however, unlike in this example, batches may be unknown to the analyst. If unknown batches are confounded with the outcome of interest, publication of data is the only way for independent meta-analysis such as this to detect the resulting bias.
The second controversy relates to one of the first studies to independently make use of the ovarian TCGA gene expression dataset to train a prognostic model. Kang et al. (19) proposed a risk score based on expression of DNA repair pathway genes. Their study was criticized by Swisher et al. (28) for apparent contradictions in the risk score with the initial hypothesis and for the small sample size and marginal statistical significance of the independent validation. We confirmed that this score was statistically significantly prognostic of overall survival in independent datasets (Figure 2). However, it was poorly ranked (ranked 11 of 14), and the 23-gene signature was only slightly better than equally sized random gene sets (Figure 5). These analyses suggest it is unlikely that the expression of these 23 DNA repair genes, as measured by high-throughput microarrays, has direct utility in the prognosis of late-stage, serous ovarian cancer.
This meta-analysis is limited by some unavoidable aspects of the publicly available data. The number of usable gene expression profiles in the database was limited by incomplete or inconsistent clinical annotations, although this problem was mitigated by the predominance of late-stage, high-grade, serous disease and widespread adoption of Federation of Gynecology and Obstetrics staging and grading (29). Additionally, the database contains the training datasets of some of the published models being assessed. Excluding these training sets results in models being compared in nonidentical subsets of the database. This limitation was mitigated by doing pairwise comparisons on the same data for top-performing models (Supplementary Figure 2, available online) and by comparison with random signatures in the same data (Figure 5), but a complete and direct comparison of all models will require additional data. In future work, we plan to assess the most promising models identified here in a new dataset of clinical trial specimens.
This work provides a practical and transparent framework, as well as computational tools, for comparative validation and meta-analysis of predictive and prognostic models from high-throughput screens. To be applied in other areas, the framework requires a database of publicly available and clinically annotated data and a collection of fully specified prediction models. Together, these create a “level playing field” on which to assess alternative prognostic models. The implemented models and curated data provided here will enable straightforward additional efforts to move ovarian cancer signatures closer to clinical relevance, including identification of very-poor-prognosis patients who could be diverted to phase II clinical trials instead of current standard therapy, analysis of gene expression subtypes, rare histologies, and different endpoints of clinical interest.
Funding
This work was supported by grants from the National Cancer Institute at the National Institutes of Health (1RC4CA156551-01 and 5P30 CA006516-46 to GP and MB) and the National Science Foundation (CAREER DBI-1053486 to CH).
Supplementary Material
We are grateful to Shaina Andelman for contributions to graphic design.
References
- 1. Siegel R, Naishadham D, Jemal A. Cancer statistics, 2012. CA Cancer J Clin. 2012;62(1):10–29. [DOI] [PubMed] [Google Scholar]
- 2. Cannistra SA, Bast RC, Jr, Berek JS, et al. Progress in the management of gynecologic cancer: consensus summary statement. J Clin Oncol. 2003;21(10 Suppl):129s–132s. [DOI] [PubMed] [Google Scholar]
- 3. Na YJ, Farley J, Zeh A, et al. Ovarian cancer: markers of response. Int J Gynecol Cancer. 2009;19(Suppl 2):S21–S29. [DOI] [PubMed] [Google Scholar]
- 4. Chon HS, Lancaster JM. Microarray-based gene expression studies in ovarian cancer. Cancer Control. 2011;18(1):8–15. [DOI] [PubMed] [Google Scholar]
- 5. Sabatier R, Finetti P, Cervera N, et al. Gene expression profiling and prediction of clinical outcome in ovarian cancer. Crit Rev Oncol Hematol. 2009;72(2):98–109. [DOI] [PubMed] [Google Scholar]
- 6. Gomez-Raposo C, Mendiola M, Barriuso J, et al. Molecular characterization of ovarian cancer by gene-expression profiling. Gynecol Oncol. 2010;118(1):88–92. [DOI] [PubMed] [Google Scholar]
- 7. Farley J, Ozbun LL, Birrer MJ. Genomic analysis of epithelial ovarian cancer. Cell Res. 2008;18(5):538–548. [DOI] [PMC free article] [PubMed] [Google Scholar]
- 8. Alsheikh-Ali AA, Qureshi W, Al-Mallah MH, et al. Public availability of published research data in high-impact journals. PloS One. 2011;6(9):e24357. [DOI] [PMC free article] [PubMed] [Google Scholar]
- 9. Taminau J, Steenhoff D, Coletta A, et al. inSilicoDb: an R/Bioconductor package for accessing human Affymetrix expert-curated datasets from GEO. Bioinformatics. 2011;27(22):3204–3205. [DOI] [PubMed] [Google Scholar]
- 10. Ioannidis JP, Allison DB, Ball CA, et al. Repeatability of published microarray gene expression analyses. Nat Genet. 2009;41(2):149–155. [DOI] [PubMed] [Google Scholar]
- 11. Baggerly KA, Coombes KR. Deriving chemosensitivity from cell lines: Forensic bioinformatics and reproducible research in high-throughput biology. Ann Appl Stat. 2009;3(4):1309–1334. [Google Scholar]
- 12. Cancer Genome Atlas Research Network. Integrated genomic analyses of ovarian carcinoma. Nature. 2011;474(7353):609–615. [DOI] [PMC free article] [PubMed] [Google Scholar]
- 13. Denkert C, Budczies J, Darb-Esfahani S, et al. A prognostic gene expression index in ovarian cancer—validation across different independent data sets. J Pathol. 2009;218(2):273–280. [DOI] [PubMed] [Google Scholar]
- 14. Bonome T, Levine DA, Shih J, et al. A gene signature predicting for survival in suboptimally debulked patients with ovarian cancer. Cancer Res. 2008;68(13):5478–5486. [DOI] [PMC free article] [PubMed] [Google Scholar]
- 15. Mok SC, Bonome T, Vathipadiekal V, et al. A gene signature predictive for outcome in advanced ovarian cancer identifies a survival factor: microfibril-associated glycoprotein 2. Cancer Cell. 2009;16(6):521–532. [DOI] [PMC free article] [PubMed] [Google Scholar]
- 16. Yoshihara K, Tsunoda T, Shigemizu D, et al. High-risk ovarian cancer based on 126-gene expression signature is uniquely characterized by downregulation of antigen presentation pathway. Clin Cancer Res. 2012;18(5):1374–1585. [DOI] [PubMed] [Google Scholar]
- 17. Yoshihara K, Tajima A, Yahata T, et al. Gene expression profile for predicting survival in advanced-stage serous ovarian cancer across two independent datasets. PloS One. 2010;5(3):e9615. [DOI] [PMC free article] [PubMed] [Google Scholar]
- 18. Bentink S, Haibe-Kains B, Risch T, et al. Angiogenic mRNA and microRNA gene expression signature predicts a novel subtype of serous ovarian cancer. PloS One. 2012;7(2):e30269. [DOI] [PMC free article] [PubMed] [Google Scholar]
- 19. Kang J, D’Andrea AD, Kozono D. A DNA repair pathway-focused score for prediction of outcomes in ovarian cancer treated with platinum-based chemotherapy. J Natl Cancer Inst. 2012;104(9):670–681. [DOI] [PMC free article] [PubMed] [Google Scholar]
- 20. Crijns AP, Fehrmann RS, de Jong S, et al. Survival-related profile, pathways, and transcription factors in ovarian cancer. PLoS Med. 2009;6(2):e24. [DOI] [PMC free article] [PubMed] [Google Scholar]
- 21. Kernagis DN, Hall AH, Datto MB. Genes with bimodal expression are robust diagnostic targets that define distinct subtypes of epithelial ovarian cancer with different overall survival. J Mol Diagnos. 2012;14(3):214–222. [DOI] [PubMed] [Google Scholar]
- 22. Sabatier R, Finetti P, Bonensea J, et al. A seven-gene prognostic model for platinum-treated ovarian carcinomas. Br J Cancer. 2011;105(2):304–311. [DOI] [PMC free article] [PubMed] [Google Scholar]
- 23. Konstantinopoulos PA, Spentzos D, Karlan BY, et al. Gene expression profile of BRCAness that correlates with responsiveness to chemotherapy and with outcome in patients with epithelial ovarian cancer. J Clin Oncol. 2010;28(22):3555–3561. [DOI] [PMC free article] [PubMed] [Google Scholar]
- 24. Hernandez L, Hsu SC, Davidson B, et al. Activation of NF-kappaB signaling by inhibitor of NF-kappaB kinase beta increases aggressiveness of ovarian cancer. Cancer Res. 2010;70(10):4005–4014. [DOI] [PMC free article] [PubMed] [Google Scholar]
- 25. Tothill RW, Tinker AV, George J, et al. Novel molecular subtypes of serous and endometrioid ovarian cancer linked to clinical outcome. Clin Cancer Res. 2008;14(16):5198–5208. [DOI] [PubMed] [Google Scholar]
- 26. Dressman HK, Berchuck A, Chan G, et al. An integrated genomic-based approach to individualized treatment of patients with advanced-stage ovarian cancer. J Clin Oncol. 2007;25(5):517–525. [DOI] [PubMed] [Google Scholar]
- 27. Venet D, Dumont JE, Detours V. Most random gene expression signatures are significantly associated with breast cancer outcome. PLoS Comp Biol. 2011;7(10):e1002240. [DOI] [PMC free article] [PubMed] [Google Scholar]
- 28. Swisher EM, Taniguchi T, Karlan BY. Molecular scores to predict ovarian cancer outcomes: a worthy goal, but not ready for prime time. J Natl Cancer Inst. 2012;104(9):642–645. [DOI] [PMC free article] [PubMed] [Google Scholar]
- 29. Ganzfried BF, Riester M, Haibe-Kains B, et al. curatedOvarianData: clinically annotated data for the ovarian cancer transcriptome. Database: The Journal of Biological Databases and Curation 2013; 2013:bat013. :10.1093/database/bat013 [DOI] [PMC free article] [PubMed] [Google Scholar]
- 30. Andrew B, Gina C, Janiel C, et al. Retraction: an integrated genomic-based approach to individualized treatment of patients with advanced-stage ovarian cancer. J Clin Oncol. 2012;30(6):678. [DOI] [PubMed] [Google Scholar]
- 31. Baggerly KA, Coombes KR, Neeley ES. Run batch effects potentially compromise the usefulness of genomic signatures for ovarian cancer. J Clin Oncol. 2008;26(7):1186–1187. [DOI] [PubMed] [Google Scholar]
- 32. Dressman HK, Potti A, Nevins JR, et al. In Reply. J Clin Oncol. 2008;26(7):1187–1188. [Google Scholar]
- 33. Johnson WE, Li C, Rabinovic A. Adjusting batch effects in microarray expression data using empirical Bayes methods. Biostatistics. 2006;8(1):118–127. [DOI] [PubMed] [Google Scholar]
- 34. Fisher RA. Frequency distribution of the values of the correlation coefficient in samples from an indefinitely large population. Biometrika. 1915;10(4):507–521. [Google Scholar]
- 35. Uno H, Cai T, Pencina MJ, et al. On the C-statistics for evaluating overall adequacy of risk prediction procedures with censored survival data. Stat Med. 2011;30(10):1105–1117. [DOI] [PMC free article] [PubMed] [Google Scholar]
- 36. Sneath PH, Sokal RR. Numerical Taxonomy. The Principles and Practice of Numerical Classification. San Francisco: H. Freeman and Co; 1973. [Google Scholar]
- 37. Subramanian A, Tamayo P, Mootha VK, et al. Gene set enrichment analysis: a knowledge-based approach for interpreting genome-wide expression profiles. Proc Natl Acad Sci U S A. 2005;102(43):15545–15550. [DOI] [PMC free article] [PubMed] [Google Scholar]
- 38. Zhao SD, Parmigiani G, Huttenhower C, et al. Más-o-menos: A simple sign averaging method for discrimnation in genomic data analysis. Harvard University Biostatistics Working Paper Series, 2013. http://biostats.bepress.com/harvardbiostat/paper158/ Accessed March 4, 2014. [DOI] [PMC free article] [PubMed]
- 39. Tukey JW. Tightening the clinical trial. Controlled Clinical Trials. 1993;14(4):266–285. [DOI] [PubMed] [Google Scholar]
- 40. Leisch F. Sweave: dynamic generation of statistical reports using literate data analysis. In: Härdle W, Rönz B, eds. Compstat, 2002. —Proceedings in Computational Statistics Heidelberg, Germany: Physika Verlag; 2002:575–580. [Google Scholar]
- 41. Gentleman RC, Carey VJ, Bates DM, et al. Bioconductor: open software development for computational biology and bioinformatics. Genome Biol. 2004;5(10):R80. [DOI] [PMC free article] [PubMed] [Google Scholar]
- 42. Micheel CM, Nass SJ, Omenn GS. Evolution of Translational Omics: Lessons Learned and the Path Forward. Washington, DC: National Academies Press; 2012. [PubMed] [Google Scholar]
- 43. Witten DM, Tibshirani R. Scientific research in the age of omics: the good, the bad, and the sloppy. J Am Med Inform Assoc. 2013;20(1):125–127. [DOI] [PMC free article] [PubMed] [Google Scholar]
- 44. Kern SE. Why your new cancer biomarker may never work: recurrent patterns and remarkable diversity in biomarker failures. Cancer Res. 2012;72(23):6097–6101. [DOI] [PMC free article] [PubMed] [Google Scholar]
- 45. Townsend NC, Ruth K, Al-Saleem T, et al. Gleason scoring at a comprehensive cancer center: what’s the difference? J Natl Comp Cancer Net. 2013;11(7):812–819. [DOI] [PMC free article] [PubMed] [Google Scholar]
- 46. Lin Y, Chappell R, Gonen M. A systematic selection method for the development of cancer staging systems. [published online ahead of print May 22, 2013]. Stat Meth Med Res. 2013; 10.1177/0962280213486853. [DOI] [PMC free article] [PubMed] [Google Scholar]
- 47. Riester M, Wei W, Waldron L, et al. Risk prediction for late-stage ovarian cancer by meta-analysis of 1,525 patient samples. J Natl Cancer Inst. 2014;106(5) dju048 10.1093/jnci/dju048. [DOI] [PMC free article] [PubMed] [Google Scholar]
- 48. Leek JT, Scharpf RB, Bravo HC, et al. Tackling the widespread and critical impact of batch effects in high-throughput data. Nat Rev Genet. 2010;11(10):733–739. [DOI] [PMC free article] [PubMed] [Google Scholar]
Associated Data
This section collects any data citations, data availability statements, or supplementary materials included in this article.