

Abstract
Introduction
Known prediction models for breast cancer can potentially by improved by the addition of mammographic density and common genetic variants identified in genome-wide associations studies known to be associated with risk of the disease. We evaluated the benefit of including mammographic density and the cumulative effect of genetic variants in breast cancer risk prediction among women in a Singapore population.
Methods
We estimated the risk of breast cancer using a prospective cohort of 24,161 women aged 50 to 64 from Singapore with available mammograms and known risk factors for breast cancer who were recruited between 1994 and 1997. We measured mammographic density using the medio-lateral oblique views of both breasts. Each woman’s genotype for 75 SNPs was simulated based on the genotype frequency obtained from the Breast Cancer Association Consortium data and the cumulative effect was summarized by a genetic risk score (GRS). Any improvement in the performance of our proposed prediction model versus one containing only variables from the Gail model was assessed by changes in receiver-operating characteristic and predictive values.
Results
During 17 years of follow-up, 680 breast cancer cases were diagnosed. The multivariate-adjusted hazard ratios (95% confidence intervals) were 1.60 (1.22–2.10), 2.20 (1.65–2.92), 2.33 (1.71–3.20), 2.12 (1.43–3.14), and 3.27 (2.24–4.76) for the corresponding mammographic density categories: 11-20cm2, 21-30cm2, 31-40cm2, 41-50cm2, 51-60cm2, and 1.10 (1.03–1.16) for GRS. At the predicted absolute 10-year risk thresholds of 2.5% and 3.0%, a model with mammographic density and GRS could correctly identify 0.9% and 0.5% more women who would develop the disease compared to a model using only the Gail variables, respectively.
Conclusion
Mammographic density and common genetic variants can improve the discriminatory power of an established breast cancer risk prediction model among females in Singapore.
Introduction
The primary goal of breast cancer screening is to enable early detection of disease so that prognosis can be improved by more timely intervention. Although screening offers the benefit of reduced mortality for potential patients, the level of over-diagnosis and subsequent treatment of healthy individuals is worthy of concern: for every breast cancer death prevented, three women would be unnecessarily treated for the disease [1]. More importantly, a large majority of women who go for screening are never diagnosed with breast cancer. This suggests a need for re-allocation of resources so that women at higher risk of developing breast cancer are accorded more frequent supervision as a preventive measure.
To facilitate the decision-making process, a woman’s risk is often assessed using her demographic and reproductive information, as well as the presence of a positive family history [2]. One of the most established prediction models used is the Gail model, which considers a woman’s family history, age, age at menarche, age at first live birth, and number of breast biopsies to provide an individualized estimate of breast cancer risk [3]. Subsequently, the model has been modified for use in other ethnic populations [4–9]. Although these models were well-calibrated, their discriminatory power was relatively poor with areas under the curve (AUCs) of the receiver-operating characteristic (ROC) ranging from 0.53 to 0.66 [2,10].
In a recent study, Chay et al evaluated the applicability of the Gail model in Singapore. They found that the Gail model over-estimated the population’s 10-year breast cancer risk by 85% overall, with women aged 60–64 having a predicted incidence that was thrice as high as observed [11]. This report highlights the need for an alternative model that is generalizable to Asian communities where the uptake of mammography screening and incidence of breast cancer is substantially lower [12,13].
Apart from the established reproductive factors, other variables have also been reported to be associated with breast cancer. Mammographic density has consistently been shown to be an independent and strong modifiable risk factor, increasing one’s risk of breast cancer by 3 to 6 times [14–20] for at least a decade [18]. Several groups have evaluated the impact of including mammographic density in breast cancer risk assessment, but have yielded modest results [4,7].
Also, findings from genome-wide association studies (GWAS) have identified several common genetic variants that are associated with breast cancer risk [21–27]. Approximately 70 single nucleotide polymorphisms (SNPs) have been identified to date [28,29] and some of these variants have been used cumulatively to estimate an individual’s probability of disease in an Asian context [30–34]. Despite the increase in the number of predictive SNPs, the performance of the risk prediction models are still suboptimal to be clinically useful in individualized prevention [34].
In this study, we aim to refine the Gail model by using effect sizes specific to our population, incorporating mammographic density and common genetic risk variants and evaluate the performance of the model in a prospective Singapore female cohort with large-scale mammography screening data available. In order to evaluate the potential improvement from genetics data, we simulated genotypes based on genotype frequency data relevant to the local population and averaged the results over the virtual genotype datasets. With the existing use of mammography and the decreasing costs of genotyping, we hope to utilize these readily accessible resources to build an individualized risk prediction model relevant to a developed Asian setting.
Methods
Study population
The subjects included in this study are women enrolled in the Singapore Breast Cancer Screening Programme (SBCSP), for which the study design has been described in detail previously [35]. The SBCSP was a prospective nationwide mammography screening project conducted between October 1994 and February 1997 among Singaporean women aged 50 to 64 years old. Eligible women were asked to complete a questionnaire regarding their demographic and anthropometric measures, family as well as reproductive history before being invited for a one-time mammogram examination. Out of 28,234 women, 3,974 did not have information on breast density because their mammograms were either unavailable, or the image quality of the scanned mammogram was too poor for the accurate assessment of mammographic density. Among those with measurements for density, 99 were detected with breast cancer at time of screening, hence, they were excluded from further analyses. Therefore, a total of 24,161 participants were used in this study. The Institutional Review Board at the National University of Singapore has approved this study. No informed consent was required as the data were analyzed anonymously.
Density measurement
Medio-lateral oblique (MLO) views of both breasts were used in this study. Original film mammograms collected during the SBCSP, and jointly owned by the Saw Swee Hock School of Public Health and National Cancer Centre, were digitized between February 2012 through February 2013 using the 2905 Laser Film Digitizer (Array Corporation, Model 2905, Tokyo, Japan), with a sampling pitch of 50 micrometers and a gray-scale contrast resolution of 12 bits. Mammographic density was determined using a fully-automated thresholding method described previously in [36]. After images have been pre-processed such that only the breast area remains on the image, 15 global thresholding approaches available in ImageJ were applied to each image to separate the areas of “dense” breast tissue (“regions of interest”) from the remaining area of the breast. The Analyze command in ImageJ was then used to count and measure objects in the thresholded images (for groups of objects divided into four size categories: 5+ in the case of the former preprocessed images; 1 to 100, 101 to 1,000, and 1,001+ pixels, in the case of the latter images that underwent background subtraction and watershedding). A variety of measurements were obtained for the breast as a whole, as well as for the "objects" of dense tissue, under each thresholding method (see ref ImageJ paper). We also used the Analyze command in ImageJ, after applying the "find edges" filter in ImageJ to identify sharp changes in intensity, and binary thinning to find the centerlines of objects in the image (in place of thresholding). For each image, 1,008 measurements were obtained as output from ImageJ. Principal component analysis was applied on the 1,008 measurements.
Mammographic density measurements (percent density and absolute dense area) obtained by one trained observer using the semi-automated Cumulus software, currently the gold standard, were available for 2,035 images digitized using the same parameters in an independent Swedish study [36]. These measurements were used as a training set for model building with the principal components based on penalized estimation using the lasso (l1) penalty [16,17] for percent density and absolute dense area in two separate models. Estimates obtained from the respective models were then applied to estimate percent density and absolute dense area for all mammograms in the SBCSP dataset. The mean density of both breasts was calculated.
Genotype simulation
Since biological samples had not been collected from the participants during the original study, genotypes for the 75 loci were simulated for each woman using her breast cancer status and genotype frequencies from the Asian populations in the Breast Cancer Association Consortium (BCAC) [28,29], while assuming that there is no interaction between SNPs, mammographic density and other established risk factors. S1 Table presents the list of SNPs that were used in the simulation, and their respective allele frequencies. Approximately 30 of the loci had been established in earlier GWAS, while the remaining were novel SNPs that have only been identified in the most recent BCAC findings [29]. A corresponding genetic risk score (GRS) was derived to represent the cumulative effect of all risk variants for a woman carrying a particular set of simulated genotypes. This is equivalent to the sum of (log Odds Ratio of SNP) x (Number of risk alleles that the individual carries for SNP) across all 75 SNPs. A total of 1,000 virtual genotype datasets were generated and GRS were calculated for each dataset and saved for the analysis with prediction models.
Case ascertainment
Incident breast cancer and vital status of all participants as of 31 December 2011 was obtained via electronic linkage with the population-based Singapore Cancer Registry [37]. Both invasive and in-situ cases were included.
Statistical analysis
The SBCSP questionnaire contained demographic data, reproductive risk factors as well as information on family history and past breast biopsy. We followed the risk factor categories from the original Gail model [3], where possible: age (50–54, 55–59, 60–64 years), age at menarche (≥14, 12–13, <12 years), age at first live birth (<20, 20–24, 25–29 or nulliparous, ≥30 years), number of first degree relatives (None, ≥1), and past breast biopsy (No, Yes), but used the corresponding coefficients from our study. Ethnicity (Chinese, Indian, Malay, Others) and body mass index (BMI) (<20, 20–23.9, 24–27.9, ≥28 kg/m2) were also considered in the model as they were relevant to our study population. Mammographic density was grouped into six dense area categories: ≤10, 11–20, 21–30, 31–40, 41–50, 51–60 cm2, while GRS was treated as a continuous variable.
Cox proportional hazards (PH) models were used to build the predictive models including breast density and common genetic variants and compute (approximately) 10-year risk for each individual. The validity of proportional hazards assumption was assessed by Schoenfeld residuals and all variables were not subject to time-varying effects across all the models. Three models (Gail variables + BMI, Gail variables + BMI + Density, Gail variables + BMI + Density + GRS) were constructed and compared in terms of their ability to accurately assess each woman’s 10-year absolute risk. We note that Cox PH models leave the baseline hazard un-estimated and therefore we approximated 10-year cumulative baseline hazard to compute the absolute risk (explained below). The first model consisted of variables from the Gail model, ethnicity and BMI; the second included breast density; the third had breast density and GRS. In Cox PH models, the probability that a woman will survive beyond a certain time point given a set of covariates x is calculated as , where β’ was the corresponding effect size for each variable, and was the cumulative baseline hazard for t years. In order to approximate the latter, we used the basehaz command in the survival R package, which implements the Nelson-Aalen estimator of the cumulative hazard for a person with specific covariate value x and reports the resulting survival probability estimate SNA(t | x). We computed this value for a person with , average values for all covariates in the model (the reference group was taken in the case of categorical variables), and approximated 10-year cumulative hazard as –log [SNA(t|)/(eβ’)]. Since each subject’s 10-year absolute risk is the desired score, an individual’s 10-year risk (with covariate X) of being diagnosed within ten years is 1- S (10|x).
Improvement in the prediction performance was assessed by the changes in the AUC of the ROC for each model, as well as positive and negative predictive values at fixed 10-year absolute risk thresholds. We also computed the concordance probabilities using the Cox proportional hazard model fits as additional performance metric [38]. To account for overly-optimistic improvements in model performance when simulated genotypes are included, we used a 10-fold cross-validation in each of the 1,000 virtual datasets and averaged the ROCs over the 1,000 sets.
All statistical analyses were performed using R version 2.13.0. Statistical tests were two-sided and P<0.05 was considered statistically significant.
Results
As of 31 December 2011, 680 women were diagnosed with either in-situ (n = 106) or invasive (n = 574) breast cancer. Table 1 shows the distribution of the study population by demographic, reproductive and other risk factors. The majority of the cases were 55 to 59 years old, more educated, have younger age at menarche, nulliparous or have their first child at a later age. They are also more likely to be current users of hormone replacement therapy, have a positive family history, previous breast biopsy, higher BMI and higher breast density. Based on the simulated genotypes, the corresponding GRS ranged from 2.75 to 7.01, with more cases being categorized in higher quintiles. The median follow-up time for cases and controls was 3131 and 6175 days respectively.
Table 1. Distribution of baseline characteristics in breast cancer patients (cases) and healthy individuals (non-cases).
| Demographics | Cases (n = 680) | Non-cases (n = 23 481) | P value |
|---|---|---|---|
| Age, n (%) | |||
| 50–54 | 227 (33.4) | 7111 (30.3) | <0.001 |
| 55–59 | 279 (41.0) | 8651 (36.8) | |
| >60 | 174 (25.6) | 7719 (32.9) | |
| Education level, n (%) | |||
| No formal education | 314 (46.2) | 14 288 (60.8) | <0.001 |
| Primary | 157 (23.1) | 4390 (18.7) | |
| Secondary or higher | 255 (37.5) | 4803 (20.5) | |
| Ethnicity, n (%) | |||
| Chinese | 583 (85.7) | 19 962 (85.0) | 0.07 |
| Malay | 36 (5.3) | 1146 (4.9) | |
| Indian | 38 (5.6) | 1085 (4.6) | |
| Others | 23 (3.4) | 1288 (5.5) | |
| Reproductive risk factors | |||
| Age at menarche, n (%) | |||
| ≥ 14 | 400 (58.8) | 15 317 (65.2) | <0.001 |
| 12–13 | 241 (35.4) | 7429 (31.6) | |
| <12 | 39 (5.7) | 735 (3.1) | |
| Age at first live birth, n (%) | |||
| < 20 | 80 (11.8) | 4045 (17.2) | <0.001 |
| 20–24 | 202 (29.7) | 8862 (37.7) | |
| 25–29 or nulliparous | 286 (42.1) | 7984 (34.0) | |
| ≥ 30 | 112 (16.5) | 2590 (11.0) | |
| Age at menopause, n (%) | |||
| < 50 | 308 (45.3) | 11 064 (47.1) | <0.001 |
| 50–54 | 313 (46.0) | 10 405 (44.3) | |
| ≥ 55 | 59 (8.7) | 2012 (8.6) | |
| Number of deliveries, n (%) | |||
| 0 | 88 (12.9) | 1823 (7.8) | <0.001 |
| 1 or 2 | 192 (28.2) | 5109 (21.8) | |
| 3 or 4 | 264 (38.8) | 9036 (38.5) | |
| ≥ 5 | 136 (20.0) | 7513 (32.0) | |
| Hormone Replacement Therapy (HRT) use, n (%) | |||
| Non-user | 539 (79.3) | 20 349 (86.7) | <0.001 |
| Ex-user | 54 (7.9) | 1378 (5.9) | |
| Current user | 87 (12.8) | 1754 (7.5) | |
| Other risk factors | |||
| Number of affected 1st degree relatives with breast cancer, n (%) | |||
| 0 | 644 (94.7) | 22 906 (97.6) | <0.001 |
| 1 | 34 (5.0) | 566 (2.4) | |
| >1 | 2 (0.3) | 9 (0.04) | |
| Past breast biopsy, n (%) | |||
| No | 615 (90.4) | 22 266 (94.8) | <0.001 |
| Yes | 65 (9.6) | 1215 (5.2) | |
| Body mass index, n (%) | |||
| < 20 | 37 (5.4) | 2567 (10.9) | <0.001 |
| 20 - < 24 | 241 (35.4) | 8503 (36.2) | |
| 24 - < 28 | 259 (38.1) | 8273 (35.2) | |
| ≥ 28 | 143 (21.0) | 4138 (17.6) | |
| Mean breast percent density, n (%) | |||
| < 10% | 57 (8.4) | 3751(16.0) | <0.001 |
| 10%—< 25% | 365 (53.7) | 13 243 (56.4) | |
| 25%—< 50% | 246 (36.2) | 6232 (26.5) | |
| ≥ 50% | 12 (1.8) | 255 (1.1) | |
| Mean breast dense area, n (%) | |||
| <10 cm2 | 70 (10.3) | 4723 (20.1) | <0.001 |
| 10–20 | 221 (32.5) | 8646 (36.8) | |
| 20–30 | 189 (27.8) | 5299 (22.6) | |
| 30–40 | 108 (15.9) | 2755 (11.7) | |
| 40–50 | 43 (6.3) | 1225 (5.2) | |
| 50–60 | 49 (7.2) | 833 (3.5) | |
| Genetic Risk Score in quintiles, n (%) | |||
| First (2.75–4.22) | 73 (10.7) | 4759 (20.3) | <0.001 |
| Second (4.23–4.43) | 98 (14.4) | 4734 (20.2) | |
| Third (4.44–4.62) | 144 (21.2) | 4688 (20.0) | |
| Fourth (4.63–4.84) | 152 (22.4) | 4680 (19.9) | |
| Fifth (4.85–7.01) | 213 (31.3) | 4620 (19.7) |
We evaluated the associations of the Gail model predictors, ethnicity, BMI, mammographic density and GRS with breast cancer risk. From Table 2, women who are 60 to 64 years old seemed to be at lower risk of breast cancer compared to those aged 50 to 54. This protective effect is no longer present after adjustment for breast density. The Malays reported about a 30% lower risk of disease in all three models compared to the Chinese, but this did not reach statistical significance. The established Gail model risk factors remained statistically significant even after accounting for BMI, density and GRS. Every increase of 0.1 in GRS corresponds to a 10% higher risk of breast cancer on average. BMI, mean dense area, and percent density (S2 Table) also significantly increased one’s risk of disease by approximately 2 to 4 fold across all categories regardless of the prediction model.
Table 2. Association of conventional risk factors, BMI, mean breast dense area and GRS with breast cancer.
| Variable | vGail + BMI (95% CI) | P value | vGail + BMI + Density (95% CI) | P value | vGail + BMI + Density + GRS (95% CI) | P value |
|---|---|---|---|---|---|---|
| Age, years | ||||||
| 50–54 | 1.00 (ref) | 1.00 (ref) | 1.00 (ref) | |||
| 55–59 | 1.07 (0.90, 1.28) | 0.439 | 1.17 (0.98, 1.40) | 0.078 | 1.17 (0.98, 1.40) | 0.081 |
| >60 | 0.81 (0.66, 0.99) | 0.044 | 0.98 (0.80, 1.21) | 0.886 | 0.98 (0.80, 1.20) | 0.839 |
| Ethnicity | ||||||
| Chinese | 1.00 (ref) | 1.00 (ref) | 1.00 (ref) | |||
| Indian | 1.16 (0.82, 1.62) | 0.401 | 1.14 (0.81, 1.60) | 0.453 | 1.10 (0.78, 1.54) | 0.58 |
| Malay | 0.66 (0.43, 1.01) | 0.055 | 0.70 (0.46, 1.08) | 0.11 | 0.71 (0.46, 1.08) | 0.112 |
| Others | 1.05 (0.75, 1.49) | 0.767 | 1.06 (0.75, 1.50) | 0.735 | 1.05 (0.74, 1.48) | 0.797 |
| Age at menarche, years | ||||||
| ≥14 | 1.00 (ref) | 1.00 (ref) | 1.00 (ref) | |||
| 12–13 | 1.14 (0.97,1.34) | 0.118 | 1.13 (0.96, 1.33) | 0.149 | 1.14 (0.97, 1.34) | 0.119 |
| <12 | 1.78 (1.28, 2.49) | <0.001 | 1.72 (1.23, 2.40) | 0.001 | 1.72 (1.23, 2.41) | 0.001 |
| Age at first live birth, years | ||||||
| <20 | 1.00 (ref) | 1.00 (ref) | 1.00 (ref) | |||
| 20–24 | 1.21 (0.93, 1.57) | 0.166 | 1.16 (0.89, 1.51) | 0.279 | 1.14 (0.88, 1.49) | 0.324 |
| 25–29 or nulliparous | 1.85 (1.43, 2.40) | <0.001 | 1.66 (1.28, 2.15) | <0.001 | 1.63 (1.26, 2.12) | <0.001 |
| ≥30 | 2.24 (1.67, 3.02) | <0.001 | 1.98 (1.47, 2.68) | <0.001 | 1.97 (1.46, 2.66) | <0.001 |
| Number of 1st degree relatives with breast cancer | ||||||
| None | 1.00 (ref) | 1.00 (ref) | 1.00 (ref) | |||
| At least 1 | 1.96 (1.40, 2.74) | <0.001 | 1.86 (1.32, 2.60) | <0.001 | 1.78 (1.27, 2.50) | <0.001 |
| Past breast biopsy | ||||||
| No | 1.00 (ref) | 1.00 (ref) | 1.00 (ref) | |||
| Yes | 1.80 (1.39, 2.32) | <0.001 | 1.65 (1.27, 2.13) | <0.001 | 1.66 (1.28, 2.14) | <0.001 |
| Body mass index, kg/m 2 | ||||||
| <20 | 1.00 (ref) | 1.00 (ref) | 1.00 (ref) | |||
| 20 to <24 | 2.03 (1.44, 2.87) | <0.001 | 2.16 (1.53, 3.06) | <0.001 | 2.19 (1.55, 3.10) | <0.001 |
| 24 to <28 | 2.40 (1.70, 3.39) | <0.001 | 2.64 (1.86, 3.74) | <0.001 | 2.66 (1.88, 3.77) | <0.001 |
| 28 or higher | 2.88 (2.00, 4.17) | <0.001 | 3.32 (2.30, 4.81) | <0.001 | 3.37 (2.33, 4.88) | <0.001 |
| Mean breast dense area, cm 2 | NA | NA | ||||
| ≤10 | 1.00 (ref) | 1.00 (ref) | ||||
| 11–20 | 1.62 (1.23, 2.12) | <0.001 | 1.60 (1.22, 2.10) | <0.001 | ||
| 21–30 | 2.21 (1.67, 2.94) | <0.001 | 2.20 (1.65, 2.92) | <0.001 | ||
| 31–40 | 2.38 (1.74, 3.25) | <0.001 | 2.33 (1.71, 3.20) | <0.001 | ||
| 41–50 | 2.11 (1.43, 3.13) | <0.001 | 2.12 (1.43, 3.14) | <0.001 | ||
| 51–60 | 3.30 (2.26, 4.82) | <0.001 | 3.27 (2.24, 4.76) | <0.001 | ||
| Genetic risk score | NA | NA | NA | NA | 1.10 (1.03, 1.16) | <0.001 |
| (2.8–7.0) |
Note: vGail—Variables from the Gail model
Performance in the three risk prediction models was examined by plotting ROC curves and comparing their areas under the curve. As genotypes were simulated, the average of 1,000 ROC curves for the model with GRS is reported in Fig 1. The model including Gail predictors, BMI, and mean dense area reported an area under the curve of 0.66 (0.64–0.68), while an inclusion of GRS reported 0.68 (0.66–0.69). A similar observation in model performance was observed for the same model using percent density instead (S1 Fig). Table 3 and S3 Table show the concordance probabilities for the respective models, which did not differ greatly regardless of whether mean dense area or percent density was used.
Fig 1. Three receiver operating characteristic (ROC) curves for predicting breast cancer: vGail + BMI (black), vGail + BMI + mean breast dense area (red), vGail + BMI + mean breast dense area + GRS (green).
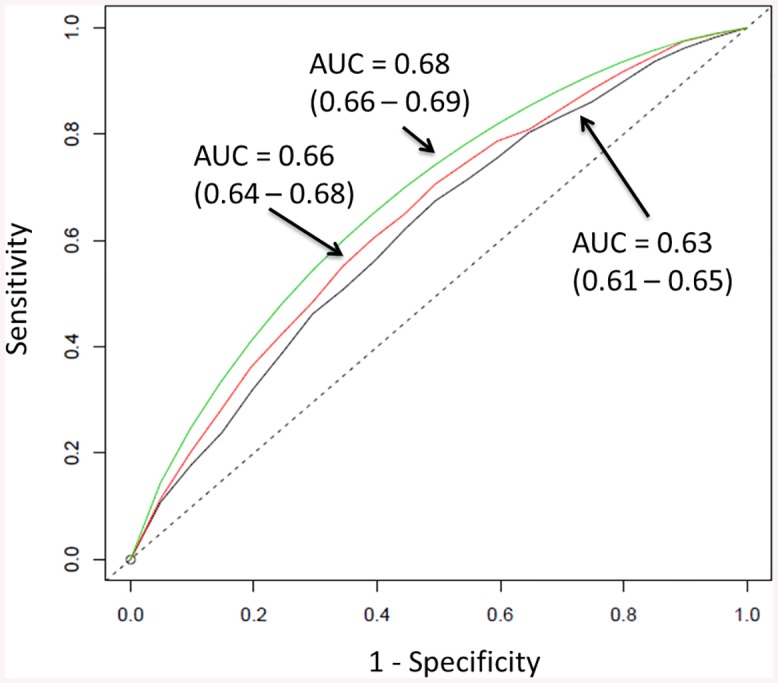
For the model with GRS, the average of 1000 ROC curves is drawn. Areas under the curves (AUCs) are 0.63, 0.66 and 0.68 respectively. The straight dashed line represents the ROC curve expected by chance only.
Table 3. Concordance probabilities of the three risk prediction models (absolute dense area).
| Prediction Model | Concordance Probability | 95% CI |
|---|---|---|
| vGail+BMI | 0.62 | 0.60–0.64 |
| vGail+BMI+Density | 0.65 | 0.63–0.66 |
| vGail+BMI+Density+GRS | 0.66 | 0.65–0.68 |
From Fig 2 and S2 Fig, we note a greater discrimination between cases and controls in terms of 10-year predicted absolute risk after the addition of mammographic density and GRS. As the risk thresholds (selected a priori) become more stringent from 1% to 3%, the difference in the proportion of patients that are correctly identified between the modified models and the Gail model, increases in general (Table 4, S4 Table). In terms of accurately classifying healthy individuals, all models fared equally well at the first five absolute risk cut-offs, but not at 5.0% and 10.0%.
Fig 2. Distribution of predicted 10-year absolute risk for patients (red) and healthy individuals (black) using the three prediction models.
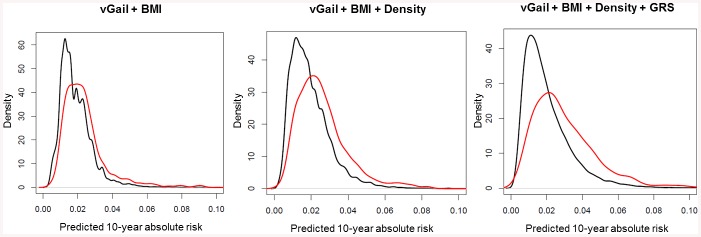
As mean breast dense area and GRS are added to the model, the discrimination between cases and non-cases increases. Y-axis is the density which reflects the number of subjects.
Table 4. Positive and negative predictive values of the three risk prediction models at five predicted 10-year absolute risk thresholds that were selected a priori.
| Predicted 10-year absolute risk | Proportion of patients identified correctly | Proportion of healthy individuals identified correctly | Prediction model |
|---|---|---|---|
| 1.0% | 3.2% | 98.8% | vGail+BMI |
| 3.3% | 98.7% | vGail+BMI+Density | |
| 3.6% | 98.9% | vGail+BMI+Density+GRS | |
| 1.5% | 3.9% | 98.2% | vGail+BMI |
| 4.1% | 98.4% | vGail+BMI+Density | |
| 4.2% | 98.4% | vGail+BMI+Density+GRS | |
| 2.0% | 4.3% | 97.9% | vGail+BMI |
| 4.8% | 98.1% | vGail+BMI+Density | |
| 5.0% | 98.1% | vGail+BMI+Density+GRS | |
| 2.5% | 4.9% | 97.5% | vGail+BMI |
| 5.5% | 97.7% | vGail+BMI+Density | |
| 5.8% | 97.9% | vGail+BMI+Density+GRS | |
| 3.0% | 5.8% | 97.4% | vGail+BMI |
| 6.1% | 97.5% | vGail+BMI+Density | |
| 6.3% | 97.7% | vGail+BMI+Density+GRS | |
| 5.0% | 13.3% | 97.3% | vGail+BMI |
| 9.1% | 97.3% | vGail+BMI+Density | |
| 10.4% | 97.4% | vGail+BMI+Density+GRS | |
| 10.0% | 14.3% | 97.2% | vGail+BMI |
| 20.0% | 97.2% | vGail+BMI+Density | |
| 13.6% | 97.2% | vGail+BMI+Density+GRS |
Discussion
Using a prospective cohort with baseline information on risk factors, mammographic density and simulated SNPs, we have observed better prediction of 10-year cumulative risk in a low incidence environment. Models incorporating these additional predictors improved the area under the curve by 2% and 6% respectively, encouraging mammography screening and identification of more SNPs related to breast cancer risk.
The Gail model has previously been shown to be poorly calibrated to the Singapore population, over-estimating an individual’s 10-year absolute risk by close to two-fold [11]. A recent study in 2012 reported that using a revised model which was country-specific improved model performance [39]. Here, we tested the use of mammographic density in improving the performance of the established risk prediction model. Similar to past studies in other populations [4,7,40], we report a modest increase in model performance from 0.63 to 0.66, and 0.63 to 0.65 for absolute dense area and percent density, respectively (Fig 1, S1 Fig). This is slightly better than the 1% that was observed by Tice et al, who had assessed mammographic density with the more subjective Breast Imaging-Reporting and Data System (BI-RADS) tool, unlike the others who focused on percent density instead. Such errors in qualitative measurement tend to attenuate the association between mammographic density and risk of disease [41]. Although the best measure of mammographic density for risk assessment is still undetermined [19,42–45], the current study found no difference in AUC between the models that included either measure unless GRS was added too (Fig 1, S1 Fig). Wider discrimination between cases and controls at various 10-year absolute risk thresholds (Fig 2, S2 Fig) highlights the potential application of our modified models in a clinical setting. These thresholds were set based on the 1.7% cumulative risk of women in Singapore at age 50 [34], such that women at 3% were deemed to be at high risk. However, some of this effect could be due to the genotype data being generated independently of mammographic density and the other Gail model risk factors. The availability of a sufficient number of orthogonal predictors, each having limited predictive power, has the potential to improve the ROC curve. Given the low prevalence of breast cancer, our modified model could not enhance the existing performance of the Gail model substantially (Table 4). The proportions obtained at 5.0% and 10.0% risk thresholds may not be reliable due to the small number of individuals at these cut-offs. Given the 1.7% cumulative risk, these thresholds may not be relevant in an Asian context.
Breast cancer patients and healthy individuals were significantly different in all variables except ethnicity (Table 1). Due to the large size of the study population, the relevance of p values governing statistical significance is limited. Since the Chinese form approximately 75% of the local population, they may be over-represented in this study. Unexpectedly, ethnicity was not a statistically significant predictor in all three models as reported in earlier literature on the local population [46]. Malay women seemed to have a lower risk of breast cancer (Table 2, S2 Table) which could be explained by an overall poor response rate among those who have the disease. Alternatively, an over-diagnosis of breast cancer among the Chinese, arising from a higher utilization of mammography among this ethnic group, could have led to an ascertainment bias. The change in association of BMI with breast cancer risk, after adjustment by mammographic density, is in agreement with our understanding on its negative confounding effect [44].
To our knowledge, we are the first to consider the cumulative effect of the largest number of SNPs in breast cancer risk prediction for an Asian setting, using data from the only prospective trial conducted outside Europe and North America. Darabi et al have carried out a similar study recently, investigating the impact of BMI, percent mammographic density and 18 common genetic variants on Swedish post-menopausal women [40]. Their results suggest an added value in using a larger pool of genetic markers, and a more obvious shift of controls to a lower predicted risk category. Contrary to their findings, we saw a greater effect among our cases.
Most groups have initially used estimation and subsequently computer-assisted methods to measure breast density. We have applied a fully-automated, high-throughput method of measuring mammographic density, which can minimize any visual irreproducibility related to more subjective assessments. Also, this measure has been shown to be highly correlated with Cumulus, an established semi-automated tool [36].
We have made a few assumptions in our study. Firstly, since cancer notification is mandatory in Singapore and all Singaporeans have a unique identification number, we expect the completeness of reporting to be close to 100% [47]. Secondly, we assume no correlation between mammographic density and SNPs, as well as between the various SNPs. Numerous groups have found common variants that contribute to the heritability of mammographic density [48–55], but the findings have either not been replicated or been countered [56,57]. We have also adjusted for both SNPs and family history in our risk models even though their effects were likely to overlap. While the latter would also account for genetic factors that were not SNP-related, and Do et.al. had recommended the integration of both methods for enhanced accuracy [58], unnecessary or over-adjustments could lead to imprecise estimates. Thirdly, we have ignored the possible difference in screening behavior between the women in our study and those in the general population. Fourthly, when we simulated the genotypes of our subjects, we have neglected the discrepancy in genotype frequencies among the various ethnicities, as well as the linkage between certain loci that are relatively close together in the genome. Lastly, SNP ORs from published GWAS were used as HRs in our study. Even if this may not be appropriate, it was the only measure that was available.
Although we had intended to compare our modified model with the Gail model, some of our study’s categories differed from the original model. Previous breast biopsy was recorded as “Yes/No” instead of the number and presence of atypical hyperplasia; family history was coded as “None/At least 1” instead of the actual number of affected first-degree relatives. However, we believe these minor coding differences will not affect our conclusion drastically [11].
The use of SNPs is dependent on the cost of genotyping, ease of collection of genetic material through blood samples or buccal swabs, as well as the identification of additional SNPs in future. As the women from the SBCSP were recruited in the 1990s, the results from this study may not be very relevant to a cohort of individuals two decades later where lifestyle patterns are more westernized. Further studies are required to gauge the applicability of the modified models on women younger than 50 years. The modified model we propose will also not be very feasible in developing nations where resources for large-scale implementation of mammography screening and genotyping are scarce [59], or the receptivity of such procedures is low [13].
In conclusion, we have demonstrated the potential benefit of mammographic density and common genetic variants in improving the performance of an established risk prediction model in a developed Asian context. The better discriminatory power observed here may encourage future efforts to identify a large panel of novel polymorphisms and thus improve the cost-effectiveness of the current nation-wide screening program in Singapore.
Supporting Information
For the model with GRS, the average of 1000 ROC curves is drawn. Areas under the curves (AUCs) are 0.63, 0.65 and 0.67 respectively. The straight dashed line represents the ROC curve expected by chance only.
(TIF)
As mean percent breast density and GRS are added to the model, the discrimination between cases and non-cases increases. Y-axis is the density which reflects the number of subjects.
(TIF)
(DOCX)
(DOCX)
(DOCX)
Mean percent breast density is used in the prediction models.
(DOCX)
Acknowledgments
We thank all the individuals who took part in the BCAC studies and all the researchers, clinicians, technicians and administrative staff who have enabled this work to be carried out.
BCAC is funded by Cancer Research UK [C1287/A10118, C1287/A12014] and by the European Community’s Seventh Framework Programme under grant agreement number 223175 (grant number HEALTH-F2-2009-223175) (COGS).
We thank Julie Yeo Chok Keyau and Carolyn Balakrishnan of the National University of Singapore, Azra Anwar Gaffoor, Lim Yan Ling Rachel, Nur Khaliesah Binte Mohamed Riza, Nurhaishireen Binte Mohamad Rahim and Piragathesh s/o Subramanian of Republic Polytechnic, for digitizing the film mammograms collected during the Singapore Breast Cancer Screening Project. We also thank the Singapore Cancer Registry in Singapore for assistance with the identification of cancer cases via database linkages. Finally, we acknowledge the work of Dr Ng Eng Hen, who initiated the SBCSP in 1993.
Data Availability
Third-party data are available from the National Registry of Diseases Office (NRDO) upon request. For access to confidential information, interested researchers must submit requests for data to Ms. Patricia Tan (Patricia_TAN@hpb.gov.sg) or Ms. Sandra Lim (Sandra_LIM@hpb.gov.sg).
Funding Statement
The authors have no support or funding to report.
References
- 1. The benefits and harms of breast cancer screening: an independent review. Lancet. 2012;380(9855):1778–86. Epub 2012/11/03. 10.1016/s0140-6736(12)61611-0 . [DOI] [PubMed] [Google Scholar]
- 2. Anothaisintawee T, Teerawattananon Y, Wiratkapun C, Kasamesup V, Thakkinstian A. Risk prediction models of breast cancer: a systematic review of model performances. Breast cancer research and treatment. 2012;133(1):1–10. Epub 2011/11/15. 10.1007/s10549-011-1853-z . [DOI] [PubMed] [Google Scholar]
- 3. Gail MH, Brinton LA, Byar DP, Corle DK, Green SB, Schairer C, et al. Projecting individualized probabilities of developing breast cancer for white females who are being examined annually. Journal of the National Cancer Institute. 1989;81(24):1879–86. Epub 1989/12/20. . [DOI] [PubMed] [Google Scholar]
- 4. Chen J, Pee D, Ayyagari R, Graubard B, Schairer C, Byrne C, et al. Projecting absolute invasive breast cancer risk in white women with a model that includes mammographic density. Journal of the National Cancer Institute. 2006;98(17):1215–26. Epub 2006/09/07. 10.1093/jnci/djj332 . [DOI] [PubMed] [Google Scholar]
- 5. Novotny J, Pecen L, Petruzelka L, Svobodnik A, Dusek L, Danes J, et al. Breast cancer risk assessment in the Czech female population—an adjustment of the original Gail model. Breast cancer research and treatment. 2006;95(1):29–35. Epub 2005/12/02. 10.1007/s10549-005-9027-5 . [DOI] [PubMed] [Google Scholar]
- 6. Gail MH, Costantino JP, Pee D, Bondy M, Newman L, Selvan M, et al. Projecting individualized absolute invasive breast cancer risk in African American women. Journal of the National Cancer Institute. 2007;99(23):1782–92. Epub 2007/11/29. 10.1093/jnci/djm223 . [DOI] [PubMed] [Google Scholar]
- 7. Tice JA, Cummings SR, Ziv E, Kerlikowske K. Mammographic breast density and the Gail model for breast cancer risk prediction in a screening population. Breast cancer research and treatment. 2005;94(2):115–22. Epub 2005/11/02. 10.1007/s10549-005-5152-4 . [DOI] [PubMed] [Google Scholar]
- 8. Tice JA, Miike R, Adduci K, Petrakis NL, King E, Wrensch MR. Nipple aspirate fluid cytology and the Gail model for breast cancer risk assessment in a screening population. Cancer epidemiology, biomarkers & prevention: a publication of the American Association for Cancer Research, cosponsored by the American Society of Preventive Oncology. 2005;14(2):324–8. Epub 2005/03/01. 10.1158/1055-9965.epi-04-0289 . [DOI] [PubMed] [Google Scholar]
- 9. Tice JA, Cummings SR, Smith-Bindman R, Ichikawa L, Barlow WE, Kerlikowske K. Using clinical factors and mammographic breast density to estimate breast cancer risk: development and validation of a new predictive model. Annals of internal medicine. 2008;148(5):337–47. Epub 2008/03/05. [DOI] [PMC free article] [PubMed] [Google Scholar]
- 10. Meads C, Ahmed I, Riley RD. A systematic review of breast cancer incidence risk prediction models with meta-analysis of their performance. Breast cancer research and treatment. 2012;132(2):365–77. Epub 2011/11/01. 10.1007/s10549-011-1818-2 . [DOI] [PubMed] [Google Scholar]
- 11. Chay WY, Ong WS, Tan PH, Jie Leo NQ, Ho GH, Wong CS, et al. Validation of the Gail model for predicting individual breast cancer risk in a prospective nationwide study of 28,104 Singapore women. Breast cancer research: BCR. 2012;14(1):R19 Epub 2012/02/01. 10.1186/bcr3104 [DOI] [PMC free article] [PubMed] [Google Scholar]
- 12. Jemal A, Bray F, Center MM, Ferlay J, Ward E, Forman D. Global cancer statistics. CA: a cancer journal for clinicians. 2011;61(2):69–90. Epub 2011/02/08. 10.3322/caac.20107 . [DOI] [PubMed] [Google Scholar]
- 13. Parsa P, Kandiah M, Abdul Rahman H, Zulkefli NM. Barriers for breast cancer screening among Asian women: a mini literature review. Asian Pacific journal of cancer prevention: APJCP. 2006;7(4):509–14. Epub 2007/01/26. . [PubMed] [Google Scholar]
- 14. Boyd NF, Byng JW, Jong RA, Fishell EK, Little LE, Miller AB, et al. Quantitative classification of mammographic densities and breast cancer risk: results from the Canadian National Breast Screening Study. Journal of the National Cancer Institute. 1995;87(9):670–5. Epub 1995/05/03. . [DOI] [PubMed] [Google Scholar]
- 15. Boyd NF, Guo H, Martin LJ, Sun L, Stone J, Fishell E, et al. Mammographic density and the risk and detection of breast cancer. The New England journal of medicine. 2007;356(3):227–36. Epub 2007/01/19. 10.1056/NEJMoa062790 . [DOI] [PubMed] [Google Scholar]
- 16. Kato I, Beinart C, Bleich A, Su S, Kim M, Toniolo PG. A nested case-control study of mammographic patterns, breast volume, and breast cancer (New York City, NY, United States). Cancer causes & control: CCC. 1995;6(5):431–8. Epub 1995/09/01. . [DOI] [PubMed] [Google Scholar]
- 17. Saftlas AF, Hoover RN, Brinton LA, Szklo M, Olson DR, Salane M, et al. Mammographic densities and risk of breast cancer. Cancer. 1991;67(11):2833–8. Epub 1991/06/01. . [DOI] [PubMed] [Google Scholar]
- 18. Byrne C, Schairer C, Wolfe J, Parekh N, Salane M, Brinton LA, et al. Mammographic features and breast cancer risk: effects with time, age, and menopause status. Journal of the National Cancer Institute. 1995;87(21):1622–9. Epub 1995/11/01. . [DOI] [PubMed] [Google Scholar]
- 19. Torres-Mejia G, De Stavola B, Allen DS, Perez-Gavilan JJ, Ferreira JM, Fentiman IS, et al. Mammographic features and subsequent risk of breast cancer: a comparison of qualitative and quantitative evaluations in the Guernsey prospective studies. Cancer epidemiology, biomarkers & prevention: a publication of the American Association for Cancer Research, cosponsored by the American Society of Preventive Oncology. 2005;14(5):1052–9. Epub 2005/05/17. 10.1158/1055-9965.epi-04-0717 . [DOI] [PubMed] [Google Scholar]
- 20. Thomas DB, Carter RA, Bush WH Jr, Ray RM, Stanford JL, Lehman CD, et al. Risk of subsequent breast cancer in relation to characteristics of screening mammograms from women less than 50 years of age. Cancer epidemiology, biomarkers & prevention: a publication of the American Association for Cancer Research, cosponsored by the American Society of Preventive Oncology. 2002;11(6):565–71. Epub 2002/06/07. . [PubMed] [Google Scholar]
- 21. Stacey SN, Manolescu A, Sulem P, Rafnar T, Gudmundsson J, Gudjonsson SA, et al. Common variants on chromosomes 2q35 and 16q12 confer susceptibility to estrogen receptor-positive breast cancer. Nature genetics. 2007;39(7):865–9. Epub 2007/05/29. 10.1038/ng2064 . [DOI] [PubMed] [Google Scholar]
- 22. Gold B, Kirchhoff T, Stefanov S, Lautenberger J, Viale A, Garber J, et al. Genome-wide association study provides evidence for a breast cancer risk locus at 6q22.33. Proceedings of the National Academy of Sciences of the United States of America. 2008;105(11):4340–5. Epub 2008/03/11. 10.1073/pnas.0800441105 [DOI] [PMC free article] [PubMed] [Google Scholar]
- 23. Zheng W, Long J, Gao YT, Li C, Zheng Y, Xiang YB, et al. Genome-wide association study identifies a new breast cancer susceptibility locus at 6q25.1. Nature genetics. 2009;41(3):324–8. Epub 2009/02/17. 10.1038/ng.318 [DOI] [PMC free article] [PubMed] [Google Scholar]
- 24. Easton DF, Pooley KA, Dunning AM, Pharoah PD, Thompson D, Ballinger DG, et al. Genome-wide association study identifies novel breast cancer susceptibility loci. Nature. 2007;447(7148):1087–93. Epub 2007/05/29. 10.1038/nature05887 [DOI] [PMC free article] [PubMed] [Google Scholar]
- 25. Long J, Shu XO, Cai Q, Gao YT, Zheng Y, Li G, et al. Evaluation of breast cancer susceptibility loci in Chinese women. Cancer epidemiology, biomarkers & prevention: a publication of the American Association for Cancer Research, cosponsored by the American Society of Preventive Oncology. 2010;19(9):2357–65. Epub 2010/08/12. 10.1158/1055-9965.epi-10-0054 [DOI] [PMC free article] [PubMed] [Google Scholar]
- 26. Zhang B, Beeghly-Fadiel A, Long J, Zheng W. Genetic variants associated with breast-cancer risk: comprehensive research synopsis, meta-analysis, and epidemiological evidence. The lancet oncology. 2011;12(5):477–88. Epub 2011/04/26. 10.1016/s1470-2045(11)70076-6 [DOI] [PMC free article] [PubMed] [Google Scholar]
- 27. Peng S, Lu B, Ruan W, Zhu Y, Sheng H, Lai M. Genetic polymorphisms and breast cancer risk: evidence from meta-analyses, pooled analyses, and genome-wide association studies. Breast cancer research and treatment. 2011;127(2):309–24. Epub 2011/03/30. 10.1007/s10549-011-1459-5 . [DOI] [PubMed] [Google Scholar]
- 28. Zheng W, Zhang B, Cai Q, Sung H, Michailidou K, Shi J, et al. Common genetic determinants of breast-cancer risk in East Asian women: a collaborative study of 23 637 breast cancer cases and 25 579 controls. Human molecular genetics. 2013;22(12):2539–50. Epub 2013/03/29. 10.1093/hmg/ddt089 [DOI] [PMC free article] [PubMed] [Google Scholar]
- 29. Michailidou K, Hall P, Gonzalez-Neira A, Ghoussaini M, Dennis J, Milne RL, et al. Large-scale genotyping identifies 41 new loci associated with breast cancer risk. Nature genetics. 2013;45(4):353–61. http://www.nature.com/ng/journal/v45/n4/abs/ng.2563.html#supplementary-information. 10.1038/ng.2563 [DOI] [PMC free article] [PubMed] [Google Scholar]
- 30. Dai J, Hu Z, Jiang Y, Shen H, Dong J, Ma H, et al. Breast cancer risk assessment with five independent genetic variants and two risk factors in Chinese women. Breast cancer research: BCR. 2012;14(1):R17 Epub 2012/01/25. 10.1186/bcr3101 [DOI] [PMC free article] [PubMed] [Google Scholar]
- 31. Chan M, Ji SM, Liaw CS, Yap YS, Law HY, Yoon CS, et al. Association of common genetic variants with breast cancer risk and clinicopathological characteristics in a Chinese population. Breast cancer research and treatment. 2012;136(1):209–20. Epub 2012/09/12. 10.1007/s10549-012-2234-y . [DOI] [PubMed] [Google Scholar]
- 32. Sueta A, Ito H, Kawase T, Hirose K, Hosono S, Yatabe Y, et al. A genetic risk predictor for breast cancer using a combination of low-penetrance polymorphisms in a Japanese population. Breast cancer research and treatment. 2012;132(2):711–21. Epub 2011/12/14. 10.1007/s10549-011-1904-5 . [DOI] [PubMed] [Google Scholar]
- 33. Zheng W, Wen W, Gao YT, Shyr Y, Zheng Y, Long J, et al. Genetic and clinical predictors for breast cancer risk assessment and stratification among Chinese women. Journal of the National Cancer Institute. 2010;102(13):972–81. Epub 2010/05/21. 10.1093/jnci/djq170 [DOI] [PMC free article] [PubMed] [Google Scholar]
- 34. Hartman M, Suo C, Lim WY, Miao H, Teo YY, Chia KS. Ability to predict breast cancer in Asian women using a polygenic susceptibility model. Breast cancer research and treatment. 2011;127(3):805–12. Epub 2010/12/15. 10.1007/s10549-010-1279-z . [DOI] [PubMed] [Google Scholar]
- 35. Ng EH, Ng FC, Tan PH, Low SC, Chiang G, Tan KP, et al. Results of intermediate measures from a population-based, randomized trial of mammographic screening prevalence and detection of breast carcinoma among Asian women: the Singapore Breast Screening Project. Cancer. 1998;82(8):1521–8. Epub 1998/04/29. . [PubMed] [Google Scholar]
- 36. Li J, Szekely L, Eriksson L, Heddson B, Sundbom A, Czene K, et al. High-throughput mammographic-density measurement: a tool for risk prediction of breast cancer. Breast cancer research: BCR. 2012;14(4):R114 Epub 2012/08/01. 10.1186/bcr3238 [DOI] [PMC free article] [PubMed] [Google Scholar]
- 37.Singapore Cancer Registry Interim Annual Registry Report Trends in Cancer Incidence in Singapore 2009–2013. In: (NRDO) NRoDO, editor. Singapore2014.
- 38. Gönen M, Heller G. Concordance probability and discriminatory power in proportional hazards regression. Biometrika. 2005;92(4):965–70. 10.1093/biomet/92.4.965 [DOI] [Google Scholar]
- 39. Gao F, Machin D, Chow KY, Sim YF, Duffy SW, Matchar DB, et al. Assessing risk of breast cancer in an ethnically South-East Asia population (results of a multiple ethnic groups study). BMC cancer. 2012;12:529 Epub 2012/11/21. 10.1186/1471-2407-12-529 [DOI] [PMC free article] [PubMed] [Google Scholar]
- 40. Darabi H, Czene K, Zhao W, Liu J, Hall P, Humphreys K. Breast cancer risk prediction and individualised screening based on common genetic variation and breast density measurement. Breast cancer research: BCR. 2012;14(1):R25 Epub 2012/02/09. 10.1186/bcr3110 [DOI] [PMC free article] [PubMed] [Google Scholar]
- 41. Boyd NF, Martin LJ, Yaffe MJ, Minkin S. Mammographic density and breast cancer risk: current understanding and future prospects. Breast cancer research: BCR. 2011;13(6):223 Epub 2011/11/26. 10.1186/bcr2942 [DOI] [PMC free article] [PubMed] [Google Scholar]
- 42. Stone J, Ding J, Warren RM, Duffy SW, Hopper JL. Using mammographic density to predict breast cancer risk: dense area or percentage dense area. Breast cancer research: BCR. 2010;12(6):R97 Epub 2010/11/23. 10.1186/bcr2778 [DOI] [PMC free article] [PubMed] [Google Scholar]
- 43. Vachon CM, Brandt KR, Ghosh K, Scott CG, Maloney SD, Carston MJ, et al. Mammographic breast density as a general marker of breast cancer risk. Cancer epidemiology, biomarkers & prevention: a publication of the American Association for Cancer Research, cosponsored by the American Society of Preventive Oncology. 2007;16(1):43–9. Epub 2007/01/16. 10.1158/1055-9965.epi-06-0738 . [DOI] [PubMed] [Google Scholar]
- 44. Wong CS, Lim GH, Gao F, Jakes RW, Offman J, Chia KS, et al. Mammographic density and its interaction with other breast cancer risk factors in an Asian population. British journal of cancer. 2011;104(5):871–4. Epub 2011/01/20. 10.1038/sj.bjc.6606085 [DOI] [PMC free article] [PubMed] [Google Scholar]
- 45. Chen Z, Wu AH, Gauderman WJ, Bernstein L, Ma H, Pike MC, et al. Does mammographic density reflect ethnic differences in breast cancer incidence rates? American journal of epidemiology. 2004;159(2):140–7. Epub 2004/01/14. . [DOI] [PubMed] [Google Scholar]
- 46. Sim X, Ali RA, Wedren S, Goh D, Tan C-S, Reilly M, et al. Ethnic differences in the time trend of female breast cancer incidence: Singapore, 1968–2002. BMC cancer. 2006;6(1):261. [DOI] [PMC free article] [PubMed] [Google Scholar]
- 47.Seow A KW, Chia KS, Shi L, Lee HP, Shanmugaratnam K. Trends in cancer incidence in Singapore 1968–2002. In: Office NRoD, editor. Singapore Cancer Registry2004.
- 48. Vachon CM, King RA, Atwood LD, Kuni CC, Sellers TA. Preliminary sibpair linkage analysis of percent mammographic density. Journal of the National Cancer Institute. 1999;91(20):1778–9. Epub 1999/10/21. . [DOI] [PubMed] [Google Scholar]
- 49. Vachon CM, Sellers TA, Carlson EE, Cunningham JM, Hilker CA, Smalley RL, et al. Strong evidence of a genetic determinant for mammographic density, a major risk factor for breast cancer. Cancer research. 2007;67(17):8412–8. Epub 2007/09/07. 10.1158/0008-5472.can-07-1076 . [DOI] [PubMed] [Google Scholar]
- 50. van Duijnhoven FJ, Bezemer ID, Peeters PH, Roest M, Uitterlinden AG, Grobbee DE, et al. Polymorphisms in the estrogen receptor alpha gene and mammographic density. Cancer epidemiology, biomarkers & prevention: a publication of the American Association for Cancer Research, cosponsored by the American Society of Preventive Oncology. 2005;14(11 Pt 1):2655–60. Epub 2005/11/15. 10.1158/1055-9965.epi-05-0398 . [DOI] [PubMed] [Google Scholar]
- 51. Lai JH, Vesprini D, Zhang W, Yaffe MJ, Pollak M, Narod SA. A polymorphic locus in the promoter region of the IGFBP3 gene is related to mammographic breast density. Cancer epidemiology, biomarkers & prevention: a publication of the American Association for Cancer Research, cosponsored by the American Society of Preventive Oncology. 2004;13(4):573–82. Epub 2004/04/07. . [PubMed] [Google Scholar]
- 52. Tamimi RM, Cox DG, Kraft P, Pollak MN, Haiman CA, Cheng I, et al. Common genetic variation in IGF1, IGFBP-1, and IGFBP-3 in relation to mammographic density: a cross-sectional study. Breast cancer research: BCR. 2007;9(1):R18 Epub 2007/02/16. 10.1186/bcr1655 [DOI] [PMC free article] [PubMed] [Google Scholar]
- 53. Mulhall C, Hegele RA, Cao H, Tritchler D, Yaffe M, Boyd NF. Pituitary growth hormone and growth hormone-releasing hormone receptor genes and associations with mammographic measures and serum growth hormone. Cancer epidemiology, biomarkers & prevention: a publication of the American Association for Cancer Research, cosponsored by the American Society of Preventive Oncology. 2005;14(11 Pt 1):2648–54. Epub 2005/11/15. 10.1158/1055-9965.epi-04-0374 . [DOI] [PubMed] [Google Scholar]
- 54. Vachon CM, Scott CG, Fasching PA, Hall P, Tamimi RM, Li J, et al. Common breast cancer susceptibility variants in LSP1 and RAD51L1 are associated with mammographic density measures that predict breast cancer risk. Cancer epidemiology, biomarkers & prevention: a publication of the American Association for Cancer Research, cosponsored by the American Society of Preventive Oncology. 2012;21(7):1156–66. Epub 2012/03/29. 10.1158/1055-9965.epi-12-0066 [DOI] [PMC free article] [PubMed] [Google Scholar]
- 55. Odefrey F, Stone J, Gurrin LC, Byrnes GB, Apicella C, Dite GS, et al. Common genetic variants associated with breast cancer and mammographic density measures that predict disease. Cancer research. 2010;70(4):1449–58. Epub 2010/02/11. 10.1158/0008-5472.can-09-3495 . [DOI] [PubMed] [Google Scholar]
- 56. Haiman CA, Bernstein L, Berg D, Ingles SA, Salane M, Ursin G. Genetic determinants of mammographic density. Breast cancer research: BCR. 2002;4(3):R5 Epub 2002/06/08. [DOI] [PMC free article] [PubMed] [Google Scholar]
- 57. Haiman CA, Hankinson SE, De Vivo I, Guillemette C, Ishibe N, Hunter DJ, et al. Polymorphisms in steroid hormone pathway genes and mammographic density. Breast cancer research and treatment. 2003;77(1):27–36. Epub 2003/02/27. . [DOI] [PubMed] [Google Scholar]
- 58. Do CB, Hinds DA, Francke U, Eriksson N. Comparison of Family History and SNPs for Predicting Risk of Complex Disease. PLoS genetics. 2012;8(10):e1002973 10.1371/journal.pgen.1002973 [DOI] [PMC free article] [PubMed] [Google Scholar]
- 59. Anderson BO, Yip CH, Ramsey SD, Bengoa R, Braun S, Fitch M, et al. Breast cancer in limited-resource countries: health care systems and public policy. The breast journal. 2006;12 Suppl 1:S54–69. Epub 2006/01/25. 10.1111/j.1075-122X.2006.00203.x . [DOI] [PubMed] [Google Scholar]
Associated Data
This section collects any data citations, data availability statements, or supplementary materials included in this article.
Supplementary Materials
For the model with GRS, the average of 1000 ROC curves is drawn. Areas under the curves (AUCs) are 0.63, 0.65 and 0.67 respectively. The straight dashed line represents the ROC curve expected by chance only.
(TIF)
As mean percent breast density and GRS are added to the model, the discrimination between cases and non-cases increases. Y-axis is the density which reflects the number of subjects.
(TIF)
(DOCX)
(DOCX)
(DOCX)
Mean percent breast density is used in the prediction models.
(DOCX)
Data Availability Statement
Third-party data are available from the National Registry of Diseases Office (NRDO) upon request. For access to confidential information, interested researchers must submit requests for data to Ms. Patricia Tan (Patricia_TAN@hpb.gov.sg) or Ms. Sandra Lim (Sandra_LIM@hpb.gov.sg).