

Abstract
Aims
Preference for risky activities is an important developmentally-graded predictor of substance use. Population-level trends in adolescent risk preference, as well as the way in which risk preference may be a conduit to risk behavior, have never been documented. The present study examines population-level trends in risk preference among U.S. high school seniors for the 36 years from 1976–2011, as well as trends in the association between risk preference and substance use and other problem behaviors.
Methods
Data were drawn from yearly nationally-representative cross-sectional surveys of US high school seniors (N=91,860). Risk preference was measured consistently with two items. Marijuana and cocaine use, binge drinking, and conduct problems were assessed. Trends were tested using JoinPoint software.
Results
The mean level of reported risk preference among US 12th graders has increased over time, especially in the 1980s. For example, the proportion of high school females who reported enjoying activities that were “a little dangerous” more than doubled, from 4.9% in 1976 to 10.8% in 1988. While risk preference reports among adolescent males leveled off in 1992, risk preference reports among females shows a continued positive overall slope through 2011. The magnitude of the association between risk preference and marijuana use has increased over time.
Conclusions
Reported preference for risky activities has increased among adolescents in the US, especially among young women. Reported risk preference is increasingly associated with a higher use of marijuana. Our findings argue for the importance of placing risk preference within a multi-level framework that attends to historical variation.
Keywords: risk preference, sensation seeking, adolescence, time trends, marijuana, alcohol, cocaine, conduct disorder
1. INTRODUCTION
Preference for risky activities, defined by the need for varied, novel and complex sensations and experiences (Steinberg, 2004; Zuckerman, 2007), tends to increase during adolescence, peak in mid-adolescence and decline during the transition to adulthood (Casey et al., 2011; Luna, 2009); it also varies considerably across individuals (Hansen and Breivik, 2001b; Zuckerman, 2007). Sensation seeking personality traits are strongly linked to risk taking and preference for risky or dangerous activities, which also tends to increase during adolescence and then drop off during the transition to adulthood (Spear, 2000; Steinberg, 2007). Adolescents higher on the continuum of risk preference are more likely to experience conduct problems and engage in substance use (Arnett, 1996; Blaszczynski et al., 1986; Miles et al., 2001; Pilgrim et al., 2006; Quinn and Harden, 2013), gambling, vandalism and truancy, and experience unintended pregnancy (Hansen and Breivik, 2001a; Kong et al., 2013; Miles et al., 2001). Higher risk preference is also associated with greater risk of injury morbidity and mortality (Minino, 2010; Mirman et al., 2012). Substantial animal and human neurobiology indicates sensation seeking and risk preferences have a strong neurobiological component, through demonstrations of ventral striatal activity in response to rewards (Casey et al., 2011; Weiland et al., 2013), the observation of sensation seeking and risk taking during adolescence in non-human primates (Stansfield and Kirstein, 2006) and the genetic underpinnings of individual variation (Harden et al., 2012); however, the ways in which these biologically-influenced processes of risk taking unfold through historical time under varying social contexts remains unexplored.
While it is well understood that risk preferences are associated with increased risk of substance use, much remains to be understood about these associations across different contexts. Specifically, given that substance use among adolescents varies across historical birth cohorts (Johnston et al., 2012), the extent to which risk behavior covaries with such trends is necessary to evaluate and interpret within a historical context. But to what extent is adolescent risk preference also a history-graded construct, one that varies across cohorts? By examining historical trends it is possible to observe how the broader social and cultural context shapes the experience of risk preference for adolescents. Specifically, two types of variation in historical trends are potentially informative for understanding social and cultural influences on risk preference: (a) mean level and (b) association with other problem behaviors. With respect to mean levels of risk preference, research to date typically examines individual and developmental differences in single or a few tightly grouped cohorts of adolescents; given that broader contextual influences may be ubiquitous at any given time period, they are likely to go unrecognized in such studies (Rose, 1985). Yet the cultural and social context in which adolescents develop clearly has implications for risk preferences (Resnick et al., 1997), as it is influenced by the immediate social context including peers, family, schools, and neighborhoods (Crone and Dahl, 2012; Schulenberg and Maggs, 2002), which themselves are conditioned upon the broader context (Jager et al., in press).
Quite separate from historical variation in mean level, the association with, or connection to, other problem behaviors given a high preference for risk could also vary across historical time. Based on existing research we know with a good deal of confidence that risk preference is an important precursor or even conduit for adolescent problem behavior. But is this equally true across historical time? Moreover, does the answer to this question vary depending upon the problem behavior? For example, more than 60% of high school seniors in the US had used marijuana by 12th grade in 1979; in 2011, less than half (46%) of seniors had used by 12th grade (Johnston et al., 2012); if marijuana users in time periods of relatively low use are more likely to be adolescents with stronger preferences for risk, we might expect the association between risk preference and marijuana use to be stronger during periods of relative low use, even if mean levels of adolescent risk preference are historically stable. Documenting the extent to which the associations between risk preference and adolescent problem behaviors varies across historical time will offer unique insights into the health and behavioral consequences of preferences for risky behavior. Moreover, understanding variation in the association between risk preference and these outcomes across historical time periods, when such outcomes are more or less available and socially sanctioned, can provide an un-paralleled opportunity to understand the specificity through which risk preferences influence these outcomes.
Importantly, by documenting both types of historical trends (i.e., trends in mean level and trends in association), we are able to provide a more complete account of historical variation in preferences for risk. This is the case because the implications of historical changes in mean levels of risk preferences are altered depending upon historical trends in the association between risk preferences and problem behaviors. For example, if mean levels of risk preferences increase historically but the associations with other problem behaviors decrease historically (i.e., risk preferences are higher today than in the past, but connection to problems behaviors is weaker), then an increase in mean levels of risk preferences is less likely to be a cause for concern. However, if mean levels of risk preferences increase historically and the association with other problem behaviors is stable or even increases historically (i.e., risk preferences are higher today than in the past and connection to problem behaviors remain strong or have strengthened), then increases in mean levels of risk preferences are likely to be a cause for concern as those adolescents who engage in high risk activities may be increasingly comprised of substance users. While examination of mean levels of substance use across the same time period can offer ecological correlations, conjoint examination of the individual-association between risk preference and substance use across historical time is necessary to understand how the potential for a changing population mean of risk preference may portend other consequences.
We examine historical trends in risk preferences among US high school seniors across 36 years (1976–2011) using data from the Monitoring the Future study (Johnston et al., 2012), testing differences by sex. We also examine 36-year trends in the association of risk preferences with substance use and externalizing behaviors such as conduct problems.
2. METHODS
2.1. Sample
Since 1976, the Monitoring the Future (MTF) study has conducted each spring a cross-sectional survey of high school seniors in ~130 U.S. public and private high schools. High schools are selected under a multi-stage random sampling design with replacement. Schools are invited to participate for two years. Schools that decline participation are replaced with schools that are similar on geographic location, size, and urbanicity. The overall participation rates (including replacements) range from 95% to 99% for all study years. Student response rates have averaged 83%, with no systematic trend; they ranged from 77% (1976) to 91% (1996, 2001, 2006). Almost all non-response is due to absenteeism; less than 1% of students refuse to participate. Self-administered questionnaires were given to students. Detailed description of design and procedures are provided elsewhere (Bachman et al., 2006; Johnston et al., 2012). Approximately 15,000 12th graders are sampled in total annually. The present study focuses on 12th graders who were randomized to a questionnaire that included the same wording and question placement of risk preference items in all 36 years. The total sample size for analysis was 91,860 12th grade students (mean sample size by year, 2,552).
2.2. Measures
The MTF questionnaire covers drug use and related behaviors and attitudes. Respondents are randomized within classroom to one of five or six (depending on year) questionnaire forms in which different sets of questions are included. Importantly, data collection procedures were the same and all constructs used in these analyses were measured in the same way across the 36 years on one of the forms.
2.2.1. Risk preferences
Two items assessing risk preferences were included: “I get a real kick out of doing things that are a little dangerous” and “I like to test myself now and then by doing things that are a little risky”. Respondents rated each question on a five-point scale from “Disagree” to “Agree”. Consistent with past research (Dever et al., 2012; Pilgrim et al., 2006), responses were summed to create a scale that ranged from 2 (Disagree on both items) to 10 (Agree on both items) (α=0.71). The summed score, as well as each item alone, correlated with measured covariates for which risk preference is consistently associated, including substance use and conduct problems (0.11 < r < 0.34), suggested some evidence for concurrent validity. In supplementary analyses we also analyzed each item separately as a dichotomous indicator, comparing those who “agree” to all others (see Supplemental Figures 1 and 21). We note that the substantial strength of these measures is that item wording and placement was invariant across all 36 years of the study.
2.2.2. Substance use
Three substance use correlates were analyzed: any consumption of 5 or more drinks “in a row” in the past two weeks (binge drinking), any marijuana use in the past 12 months, and any cocaine use in the past 12 months. The survey assessed the frequency of use of these substances (0 occasions, 1–2, 3–4, etc.) in past 12-months or past 2-weeks. The use of dichotomies reflects our interest in the association of risk preference with any engagement in substance use, and also facilitates interpretation. Auxiliary analyses using ordinal outcome assessments achieved similar results.
2.2.3. Conduct problems
Conduct problems were assessed using a seven-question scale, with students rating how often in the past 12 months they engaged in activities such as fights, hurting others, using a knife or gun, and stealing (α=0.82). The scale was also dichotomized, with those in the highest 25th percentile considered to have high conduct problems (those >9, compared with all others, with the minimum score being 7). This cutpoint was chosen to provide an intuitive interpretation of the results for those with high versus low scores on the conduct problems scale. Given that there may be heterogeneity among those in the lower 75th percentile, we also conducted a sensitivity analysis in which we compared those in the highest 25th percentile to those who scored a 7 on the conduct problems scale (41% of the sample) which would indicate no conduct problems.
2.2.4. Socio-demographics
We included the following demographic variables as control variables, all reported by the student: sex (48.1% male), race/ethnicity (White [72.9%], Black [11.6%], Hispanic [7.7%], Asian [3.1%], other [4.8%]), highest level of parental education received (more than high school [64.2%], high school [26.4%], or less than high school [9.3%]), most recent grade point average (‘A’ average [37.0%], ‘B’ average [37.7%], or ‘less than B’ average [25.2%]), and adolescent not living with the father (23.3%).
2.2.5. Statistical analysis
Firstly, we examined mean risk preference by year and sex, including survey-provided sampling weights. We compared trends over time using the National Cancer Institute’s Joinpoint software (Kim et al., 2001). We estimated “points of inflection”, that is, specific years in which the slope of the linear trend significantly changes. We did this examination for the mean risk preference (summation of the two risk preference items) as well as a dichotomous indicator of each risk preference variable separately. The Joinpoint software estimates a series of permutations with increasing number of inflection points, and indicates the minimum number necessary such that additional inflection points do not significantly improve model fit.
Next, we tested for significant differences in the magnitude of the slope changes by sex using Mplus software (Muthen and Muthen, 2010). To model effects separately by sex, we used a multiple-group approach (Duncan et al., 1999) using sex as the grouping variable. Then, using model comparisons (Kline, 1998), the magnitude of the coefficient for each four-year group K compared to the four-year group K-1 was compared between males and females. Thus, in summary, we estimate the slope of the linear association of risk preference on year, comparing each four year period to the previous four year period, by sex using a multiple group approach, and then determined through model comparisons whether the magnitude of the slope for men in year group K compared to year group K-1 was the same for men as it is for women. Missing data was low across all covariates (the maximum was 6.5% for parent education), and was adjusted for using full-information maximum likelihood, based on all covariates in the analytic dataset.
We then examined the association between substance use and conduct disorder with risk preference using regression models in Mplus. To ensure that the scale was standardized across all analyses, the continuous risk preference variable was the outcome in all models, and standardized betas were extracted to estimate mean differences. To test whether differences in the magnitude of associations across years was significant, we used JoinPoint software using methods described above to determine if there is evidence for any time trend in the association.
3. RESULTS
3.1. Mean risk preference across 36 years and differences by sex
The mean level of reported risk preference among US 12th graders increased over time, especially in the 1980s (Figure 1). For both males and females, permutation analyses indicated that the trend in risk preference over time best fit a model with three slopes with two inflection points.
Figure 1.
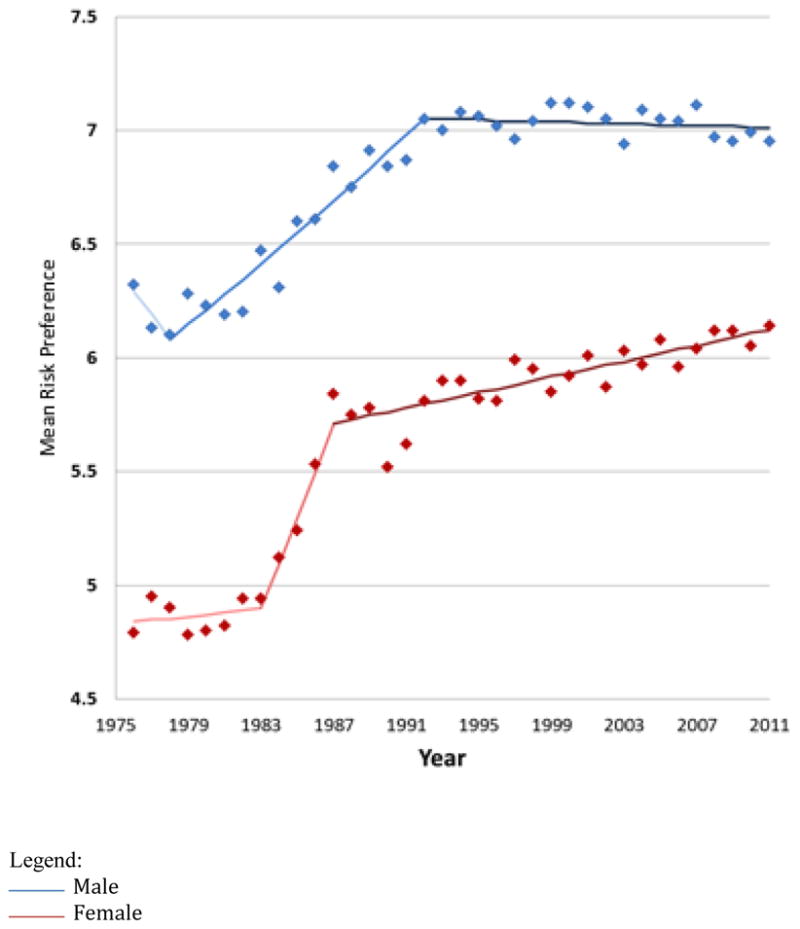
Mean risk preference (scale of 2 to 10) among high school 12th grade females (red) and males (blue) in the US from 1976 through 2011
*Best fitting model for mean risk preference across years included three slopes with two points of permutation. For males, points of permutation were 1978 (95% C.I. 1978–1984) and 1992 (95% C.I. 1988–1995). Slope 1: B=−0.02, Se=0.02, p=0.35; Slope 2: B=0.01, Se=0.0009, p<0.01; Slope 3: B=−0.0003, SE=0.0005 p=0.51. For females, points of permutation were 1983 (95% C.I. 1980–1985), and 1987 (95% C.I. 1985–1988). Slope 1: B=0.002, SE=0.003 p=0.57; Slope 2: B=0.04, SE=0.01, p=0.001; Slope 3: B=0.003, SE=0.0004, p<0.001.
3.1.1. Males
From 1976 to 1978, the slope was negative (indicating decreases in risk preferences) but not significantly different from zero (β=−0.02, SE=0.02, p=0.35). There is a point of inflection at 1978 (95% confidence interval [C.I.] from 1978 to 1984), and from 1984 to 1992, the slope rises sharply each year (β=0.01, SE=0.009, p<0.001. There is another point of inflection in 1992 (95% C.I. 1988–1995), and the slope then slightly decreases thereafter but the decrease is not statistically significant (β=−0.0003, SE=0.0005, p=0.51).
3.1.2. Females
Risk preference generally increased across time for females, though to different degrees at different time points. From 1976 to 1982, the slope is positive but not significantly different from zero (β=0.001, SE=0.003, p=0.57). There is a point of inflection at 1983 (95% C.I. from 1980 to 1985), and from 1983 to 1986, the slope rises sharply (β=0.04, SE=0.01, p=0.001). There is another point of inflection in 1987 (95% C.I. 1985–1988), and the slope then continues to increase, at a slower rate than previously (β=0.003, SE=0.0004, p=<0.001). The percentage of adolescent females who reported preferring danger continued to increase, with a maximum of 12.97% in 2010.
Comparing risk preference between 1984–1987 to 1980–1983, the slope of increase was higher for females (β=0.43, SE=0.04, p<0.01) than for males (β=0.24, SE=0.04, p<0.01) (test for difference: Δχ2(1)=11.4, p<0.01), as was the slope comparing 2008–2011 to 2004–2007 (females: β=0.13, SE=0.05, p<0.05); males (β=−0.09, SE=0.05, p=0.05) (test for difference: Δχ2(1)=13.2, p<0.01). Thus, overall these data indicate that there was more of an increase in risk preference among females across the 1980s compared with males, and that risk preference continued to increase among females through 2011, whereas there is no evidence of continued increases among males.
3.1.3. Sensitivity analysis: trends for each item
To better understand the magnitude of the change over time, we also estimated trends for each risk preference item separately using a dichotomous indicator of those who “agree” with each risk preference statement versus all others (Supplementary Figures 1 and 22). There was no evidence that results differed from the combined main analysis, and the magnitude of the association indicated that there are substantial meaningful increases in the proportion of adolescents who report risk preferences over time. The percentage of adolescent males who reported preference for danger more than doubled from 11.85% to 26.50% from 1978 to 1993, and the percentage who reported testing themselves by doing things that are risky increased from 16.56% to 25.82% across the same time period. The percentage of adolescent females who reported preference for danger more than doubled from 4.70% to 10.84% from 1981 to 1987, and the percentage who reported liking to test themselves by doing things that are risky nearly doubled from 6.84% to 13.12% across the same time period.
3.2. Associations between risk preference and high-risk behaviors
Yearly associations between risk preference and conduct problems, binge drinking, marijuana use, cocaine use are shown in Figure 2.
Figure 2.

The relation* between substance use, conduct problems** and risk preference from 1976 through 2011 among high school seniors in the US by sex
* Based on linear regression with the continuous risk preference variable as the outcome, and controlled for all substance use simultaneously, conduct problems, age, sex, race/ethnicity, presence of father in the home, and grade point average. Parental education?
** Conduct problems based on a 7-question scale with total possible score ranging from 7 to 35. The scale was also dichotomized to those >9 versus 9 or less.
3.2.1. Conduct problems
Associations with conduct problems were positive and significant in all 36 years. Joinpoint analyses indicated that the slope of the association between risk preference and conduct problems was significantly negative for males (β = −0.006, SE=0.003, p=0.031), thus, among males, the magnitude of the association between risk preference and conduct problems decreased across the last 36 years. The slope was not significantly different from zero among females (β = −0.003, SE=0.003, p=0.306), indicating that there is no evidence of a trend over time in the magnitude of the association among females.
Further, we re-categorized the conduct problems variable comparing those in the top 25th percentile to those reporting no conduct problems (Online Figure 4); results were consistent with results from Figure 2; associations were positive and significant every year, with some evidence of a decrease over time for males.
3.2.2. Binge drinking
Associations with binge drinking were positive and significant in all 36 years for females, and 35 out of 36 years for males. Joinpoint analyses indicated that the slope of the association between risk preference and binge drinking was not significantly different from zero among females (β = 0.003, SE=0.003, p=0.338) or males (β = −0.004, SE=0.003, p=0.136), indicating that there is no evidence of a trend over time in the magnitude of the association.
3.2.3. Marijuana use
Associations with marijuana use were positive and significant in 35 of 36 years for females and 34 of 36 years for males. Joinpoint analyses indicated that the association between risk preference and marijuana was positive with a single slope, for both males (β=0.009, SE=0.003, p=0.001) and females (β=0.009, SE=0.002, p=0.001). We graph the regression line and each association in Online Figure 3. Thus, the magnitude of the association between risk preference and marijuana use increased across the past four decades.
3.2.4. Cocaine use
Associations with cocaine use were generally positive, though with substantial variation. Joinpoint analyses indicated that the slope of the association between risk preference and cocaine use was not significantly different from zero among females (β = 0.002, SE=0.005, p=0.693) or males (β = −0.005, SE=0.004, p=0.271), indicating that there is no evidence of a trend over time in the magnitude of the association. The best fitting model had a single slope, which was not significantly different than zero. Thus, while there is substantial variation in the magnitude of the association between risk preference and cocaine use across time, there is no evidence for a systematic linear trend.
4. DISCUSSION
The present study provides population-level estimates of risk preference among US high school seniors for the 36-year interval from 1976–2011. Three novel findings emerged. First, the strongest increases in endorsement of preferences for risk among adolescents occurred in the 1980s. Second, these increases were significantly greater for females than for males, and the slope of risk preference continued to be positive for females through 2011 whereas there have been no further increases among males. Among males, the prevalence of risk preferences more than doubled from 1978 to 1989, and remained stable thereafter; among females, the prevalence more than doubled across the same time period, and continued to increase. Finally, the relation between risk preference and marijuana use steadily increased from 1976–2011 for both males and females, and for males only the relation between risk preference and conduct problems decreased across the same time period.
We first consider the changes demonstrated in the overall mean of risk preference, and then the changes in association with marijuana use. Changes in the overall mean have implications for prediction; if the slope of the increase in risk preference continues to be positive for adolescent females, we may predict even greater increases in risk preference for young women in the years to come. It is possible that adolescent females of the 1980s were experiencing the rewards of the feminist revolution of the 1960s and 1970s, able in some ways to shed conventions of prior norms of propriety. Cross-national evidence indicating that substance use disorders are increasingly common among women in younger birth cohorts with more education and access to pregnancy prevention methods (Seedat et al., 2009). Indeed, in the US, young adult women during this time were increasingly using birth control to avoid pregnancy, allowing for more sexual freedom (Mosher and Jones, 2010), for delays in childbearing and marriage, and for increases in rates of entering college and the workforce. The present study conforms to and extends existing literature suggesting that adolescent women are increasingly engaging in under-constrained behavior.
These findings suggest that social and cultural factors greatly influence risk preference, as indicated by the substantial increases in the 1980s. Adolescents in the 1980s are often labeled as Generation X (those born from the mid 1960s to early 1980s), and have been described with characteristics such as disrespect of authority, and disenfranchisement with traditional gender roles and other stereotypes (Rosen, 2001; Shugart, 2001). Generation X came of age in a time of relative prosperity: census trends indicate that the proportion of adolescents moving from high school to attend college increased from 49% to 60% in the 1980s, compared to a decrease from 52% to 49% across the 1970s (Bureau, 2012). Thus, adolescents in the 1980s delayed the assumption of adult roles, perhaps along with responsibilities and decision-making during the teen years, making pursuit of activities purely for risk taking a more attainable goal. For males, risk preferences stabilized twenty years ago at a “new normal”, which was substantially higher than the level of risk preference in the population just a decade earlier. In the search for the cultural mechanisms that keep this higher “new normal” adolescent population level of risk preference in place, it is worth noting that they may not be the same mechanisms that underlie the increases seen in the 1980s. The 1990s, for example, saw a rise in popularity of activities such as “extreme sports” which may create a positive feedback loop, as adolescents seek out these activities and thus become less averse to risk, although such speculation has not been tested in data. Although mean levels of risk preference increased historically, the associations with problem behaviors were generally stable (the one important exception being the association between risk preference and marijuana use, which we discuss below). Thus, while adolescent levels of risk preference have increased, the connection with most adolescent problem behaviors has proven to be durable and robust.
However, we note that an increase in mean levels of reported risk preference could indicate that actual preference for risky activities is increasing, or that it is becoming more socially acceptable to report risk preferences. Because these data are based on self-reports, we cannot distinguish between these two possibilities. However, we note that responsdents are instructed that their responses are confidential and data collection is monitored so that they can feel secure as they respond to the questionnaire; thus they are not reporting in any group setting or context in which they would be primed to give socially acceptable answers.
Further, as the social context changes and the types of activities that would qualify as “risky” changes, so too may an adolescent’s interpretation of these questions. For example, driving after drinking became increasingly socially unacceptable as public health and media campaigns highlighted the dangers of such activities (Lerner, 2012; O’Malley and Johnston, 1999), and policies and laws were passed to sanction intoxicated drivers.
An adolescent may consider driving after drinking to be a risky activity more so in the last twenty years than in the 1970s and 1980s. Thus, these data are suggestive that risk preferences may be shifting at a population level, though they may also indicate, at least to some degree, that the meaning and context of risk preferences for adolescents are also changing over time.
In terms of implications for insights into the health and behavioral consequences of risk preferences, strong preferences for risk are increasingly more strongly associated with marijuana use. This may suggest that the motivation for engaging in marijuana use has changed over time, and is more bound in risk preference and sensation seeking than in previous decades. These results in general suggest that those students who engage in high-risk behavior are increasingly more likely to include marijuana use in their repertoire. Evidence indicates that marijuana has been becoming a potentially a more socially deviant behavior from the norm (Keyes et al., 2011b; Little et al., 2008). Social deviance may underlie, at least to some extent, the increasing relation between risk preference and marijuana use. However, the relation between risk preference and other substances is more consistent. Moreover, as marijuana policies in the US are under rapid changes, including legalization of medical use in more than one-third of US states as well as legalization of recreational use for adults in four states, continued monitoring of the relation between marijuana use and risk taking preferences will be needed to monitor shifts.
Concomitantly, we find that the associations between risk preference and conduct problems are decreasing across time, but only among males. This may indicate that just as marijuana use is increasingly viewed as a deviant activity, behaviors in our conduct problems scale such as fighting, stealing, or using a weapon may be less deviant, or less of an indicator of a risk preference. However, there remains a positive association between risk preference and conduct problems, suggesting that while the association may be declining in magnitude to some degree, the potential consequences of risk preference for violent behavior should not be overlooked.
Of note, the ecological cohort-level trends in risk preference and marijuana use trends are in opposing directions. Data from the MTF indicate that marijuana use declined throughout the 1980s, the time period in which we saw substantial increases in mean risk preference. Specifically, from 1980 to 1989, the prevalence of any marijuana use in the past year fell from 48.8% to 27.0% among high school seniors (Johnston et al., 2012). At the same time, perceptions that using marijuana posed a great risk to health increased. However, the association between risk preferences and marijuana use at the individual level remained significant and positive throughout that time, and even increased in magnitude. Thus, as risk preference increased, those who have higher risk preference were increasingly those who also engaged in marijuana use. Further, as marijuana use was increasingly perceived to be a risky activity, those with higher risk preferences were more likely to engage in use, as the perception of this as an activity that falls into the ‘risk’ category increased. This indicates that while cohort level associations may tell one story (that risk preference increased during a time in which marijuana use decreased), the individual-level association tell a different story (that higher risk preference is increasingly associated with more marijuana use, and that those with high risk preference are more likely to engage in marijuana as marijuana becomes increasingly perceived of as a risky activity). Thus, adolescents with high risk preference are increasingly, in more recent cohorts, a group with a higher propensity to engage in risky behaviors such as marijuana use.
Limitations of the study are noted. Risk preference was measured in the survey with two items only; internal reliability would be increased with a longer item set. Further, we do not have information on the social contexts in which risk preferences may vary (e.g., with peers, when facing conflict, at school, etc.). However, the strength of these items is that they have been measured in exactly the same way for 36 years, thus reducing methodological artifact as an alternative explanation for the findings. An additional limitation is that high school drop-outs, who tend to have higher levels of externalizing behavior and risk preferences (Bachman et al., 2008), are not included in the sample. However, we note that trends in high school dropout rates do not mirror trends in risk preference seen here; in fact drop-out has generally been declining in the US (Chapman et al., 2011). Thus, trends in high school non-completion are not plausible to explain our findings, though we note that our results generalize to high-school attending adolescents only rather than non-school attending adolescents. We note that the demographics of the United States have changed substantially over the 36 years in which the MTF has been collecting data; we control for demographic factors including those for which there have been shifts at the population level, including race/ethnicity, parental education level, and having a father in the home; thus demographic shifts by race/ethnicity, parental education, and household composition are unlikely to explain the results observed here. Further, while we have substantial demographic information on the adolescents in MTF, we do not have data on family income or other socio-economic indicators that might in part explain the relation between risk preference and substance use. However, we do include demographic controls for the adolescent reported highest level of parental education as well as whether the father lives as home, which no doubt impacts household income.
These results indicate that individual differences and developmental trends in risk preference are, at least in some part, open to macro/societal influence and change over time. Negative consequences of high-risk behavior depend on the context in which adolescents mature (Steinberg, 2007). Limited access to substances and strong parental other authority monitoring (Dever et al., 2012) may limit the opportunity for high sensation seekers to evidence harmful and potentially fatal consequences. The desire to seek stimulating or risky experiences is not necessarily problematic; it is a positive adaptation for normal human development (Dever et al., 2012; Spear, 2007), and relates to healthy outcomes such as sports involvement (Hansen and Breivik, 2001b; Schroth, 1995) low anxiety sensitivity (Comeau et al., 2001), and transitioning out of the home without distress (Steinberg and Morris, 2001; Thakker and Durrant, 2003). High risk preference is also associated with participation in sports, especially extreme sports such as rock climbing (Brymer, 2010; Fave et al., 2003); encouraging adolescents with high risk preference to channel energy into positive outlets such as sports participation may mitigate negative sequelae of a high risk preference tendencies. More broadly, our findings argue for the importance of placing what often is viewed as an individual-level risk factor for health risk behaviors within a multi-level framework that attends to historical and cultural variation.
Supplementary Material
Table 1.
Sex differences in the time trend of risk preference from 1976–2011
| Year | Slope among males (β), standard error, p-value | Slope among females (β), standard error, p-value | Constraint test* |
|---|---|---|---|
| 1980–1983 vs. 1976–1979 | −0.01, 0.04, 0.86 | −0.09, 0.04, 0.04 | Δχ2(1) = .1.9, p = .17 |
| 1984–1987 vs. 1980–1983 | 0.24, 0.04, <0.01 | 0.43, 0.04, <0.01 | Δχ2(1) = 11.4, p < .01 |
| 1988–1991 vs. 1984–1987 | 0.11, 0.04, <0.01 | 0.07, 0.04, 0.08 | Δχ2(1) = .51, p = .47 |
| 1992–1995 vs. 1988–1991 | 0.20, 0.04, <0.01 | 0.17, 0.05, <0.01 | Δχ2(1) = .27, p = .60 |
| 1996–1999 vs. 1992–1995 | −0.07 (0.05), 0.16 | −0.02, 0.05, 0.74 | Δχ2(1) = .71, p = .40 |
| 2000–2003 vs. 1996–1999 | 0.03 (0.05), 0.59 | 0.08 (0.05), 0.11 | Δχ2(1) = .58, p = .48 |
| 2004–2007 vs. 2000–2003 | 0.05 (0.05), 0.25 | 0.05 (0.05), 0.34 | Δχ2(1) = .00, p = .95 |
| 2008–2011 vs. 2004–2007 | −0.09 (0.05), 0.05 | 0.13 (0.05), <0.01 | Δχ2(1) = 13.2, p < .01 |
Constraint test is a chi-square difference test comparing a model in which slopes are free to vary to a model in which the slopes are constrained to be equal. A significant test indicates that the model in which the slopes are constrained to be equal provides a worse fit to the data than a model in which the slopes are free to vary.
Footnotes
Supplementary material can be found by accessing the online version of this paper at http://dx.doi.org and by entering doi:...
Supplementary material can be found by accessing the online version of this paper at http://dx.doi.org and by entering doi:...
Supplementary material can be found by accessing the online version of this paper at http://dx.doi.org and by entering doi:...
Publisher's Disclaimer: This is a PDF file of an unedited manuscript that has been accepted for publication. As a service to our customers we are providing this early version of the manuscript. The manuscript will undergo copyediting, typesetting, and review of the resulting proof before it is published in its final citable form. Please note that during the production process errors may be discovered which could affect the content, and all legal disclaimers that apply to the journal pertain.
References
- Arnett JJ. Sensation seeking, aggressiveness, and adolescent reckless behavior. Person Individ Diff. 1996;20:693–702. [Google Scholar]
- Bachman JG, Johnston LD, O’Malley P, Schulenberg JE. The Monitoring The Future Project After Thirty-Two Years: Design And Procedures. Institute for Social Research; Ann Arbor, MI: 2006. Monitoring the Future Occasional Paper No. 64. [Google Scholar]
- Bachman JG, O’Malley P, Schulenberg JE, Johnston LD, Freedman-Doan P, Messersmith EE. The Education–Drug Use Connection: How Successes And Failures In School Relate To Adolescent Smoking, Drinking, Drug Use, And Delinquency. Lawrence Erlbaum Associates/Taylor & Francis; New York: 2008. [Google Scholar]
- Blaszczynski AP, Wilson AC, McConaghy N. Sensation seeking and pathological gambling. Br J Addict. 1986;81:113–117. doi: 10.1111/j.1360-0443.1986.tb00301.x. [DOI] [PubMed] [Google Scholar]
- Brymer E. Risk taking in Extreme Sports: a phenomenological perspective. Annals of Leisure Research. 2010;13:218–238. [Google Scholar]
- Bureau C. Higher Education: Institutions and Enrollment. 2012 http://www.census.gov/compendia/statab/2012/tables/12s0276.pdfaccessed on.
- Casey B, Jones RM, Somerville LH. Braking and accelerating of the adolescent brain. J Res Adolesc. 2011;21:21–33. doi: 10.1111/j.1532-7795.2010.00712.x. [DOI] [PMC free article] [PubMed] [Google Scholar]
- Chapman C, Laird J, Ifill N, KewalRamani A. NCES 2012–006. U.S Department of Education; Washington, DC: National Center for Education Statistics; 2011. Trends In High School Dropout And Completion Rates In The United States, 1972–2009. Retrieved November 12, 2014 from http://nces.ed.gov/pubs2012/2012006.pdf. [Google Scholar]
- Comeau N, Stewart SH, Loba P. The relations of trait anxiety, anxiety sensitivity, and sensation seeking to adolescents’ motivations for alcohol, cigarette, and marijuana use. Addict Behav. 2001;26:803–825. doi: 10.1016/s0306-4603(01)00238-6. [DOI] [PubMed] [Google Scholar]
- Crone EA, Dahl RE. Understanding adolescence as a period of social-affective engagement and goal flexibility. Nat Rev Neurosci. 2012;13:636–650. doi: 10.1038/nrn3313. [DOI] [PubMed] [Google Scholar]
- Dever BV, Schulenberg JE, Dworkin JB, O’Malley PM, Kloska DD, Bachman JG. Predicting risk-taking with and without substance use: the effects of parental monitoring, school bonding, and sports participation. Prev Sci. 2012;13:605–615. doi: 10.1007/s11121-012-0288-z. [DOI] [PMC free article] [PubMed] [Google Scholar]
- Duncan T, Duncan S, Strycker L, Li F, Alpert A. An Introduction To Latent Variable Growth Curve Modeling: Concepts, Issues, And Applications. Erlbaum; Mahwah, NJ: 1999. [Google Scholar]
- Fave AD, Bassi M, Massimini F. Quality of experience and risk perception in high-altitude rock climbing. J Appl Sport Psychol. 2003;15:82–98. [Google Scholar]
- Hansen EB, Breivik G. Sensation seeking as a predictor of positive and negative risk behaviour among adolescents. Person Individ Diff. 2001a;30:627–640. [Google Scholar]
- Hansen EB, Breivik G. Sensation seeking as a predictor of positive and negative risk behaviour among adolescents. Person Individ Diff. 2001b;6:121–122. [Google Scholar]
- Harden KP, Quinn PD, Tucker-Drob EM. Genetically influenced change in sensation seeking drives the rise of delinquent behavior during adolescence. Dev Sci. 2012;15:150–163. doi: 10.1111/j.1467-7687.2011.01115.x. [DOI] [PMC free article] [PubMed] [Google Scholar]
- Jager J, Keyes KM, Schulenberg JE. Historical variation in young adult binge drinking trajectories and its link to historical variation in social roles and minimum legal drinking age. Dev Psychol. doi: 10.1037/dev0000022. in press. [DOI] [PMC free article] [PubMed] [Google Scholar]
- Johnston LD, O’Malley P, Bachman JG, Schulenberg JE. Monitoring The Future National Survey Results On Drug Use, 1975–2011: Volume 1, Secondary School Students. Institute For Social Research, The University Of Michigan; Ann Arbor: 2012. [Google Scholar]
- Keyes KM, Li G, Hasin DS. Birth cohort effects and gender differences in alcohol epidemiology: a review and synthesis. Alcohol Clin Exp Res. 2011a;35:2101–2112. doi: 10.1111/j.1530-0277.2011.01562.x. [DOI] [PMC free article] [PubMed] [Google Scholar]
- Keyes KM, Schulenberg JE, O’Malley PM, Johnston LD, Bachman JG, Li G, Hasin D. The social norms of birth cohorts and adolescent marijuana use in the United States, 1976–2007. Addiction. 2011b;106:1790–1800. doi: 10.1111/j.1360-0443.2011.03485.x. [DOI] [PMC free article] [PubMed] [Google Scholar]
- Kim HJ, Fay MP, Feuer Ej, Midthune DN. Permutation tests for Joinpoint regression with appli¬cations to cancer rates. Stat Med. 2001;19:335–351. doi: 10.1002/(sici)1097-0258(20000215)19:3<335::aid-sim336>3.0.co;2-z. [DOI] [PubMed] [Google Scholar]
- Kline R. Principles And Practice Of Structural Equation Modeling. Guilford Press; New York, NY: 1998. [Google Scholar]
- Kong G, Smith AE, McMahon TJ, Cavallo DA, Schepis TS, Desai RA, Potenza MN, Krishnan-Sarin S. Pubertal status, sensation-seeking, impulsivity, and substance use in high school-aged boys and girls. J Addict Med. 2013;7:116–121. doi: 10.1097/ADM.0b013e31828230ca. [DOI] [PMC free article] [PubMed] [Google Scholar]
- Lerner BH. One For The Road: Drunk Driving Since 1990. Johns Hopkins University Press; Baltimore, MD: 2012. [Google Scholar]
- Little M, Weaver SR, King KM, Liu F, Chassin L. Historical change in the link between adolescent deviance proneness and marijuana use, 1979–2004. Prev Sci. 2008;9:4–16. doi: 10.1007/s11121-008-0084-y. [DOI] [PMC free article] [PubMed] [Google Scholar]
- Luna B. Developmental changes in cognitive control through adolescence. Adv Child Dev Behav. 2009;37:233–278. doi: 10.1016/s0065-2407(09)03706-9. [DOI] [PMC free article] [PubMed] [Google Scholar]
- Miles DR, van den Bree MB, Gupman AE, Newlin DB, Glantz MD, Pickens RW. A twin study on sensation seeking, risk taking behavior and marijuana use. Drug Alcohol Depend. 2001;62:57–68. doi: 10.1016/s0376-8716(00)00165-4. [DOI] [PubMed] [Google Scholar]
- Minino A. Mortality among teenagers aged 12–19 years: United States, 1999–2006. NCHS Data Brief. 2010:1–8. [PubMed] [Google Scholar]
- Mirman JH, Albert D, Jacobsohn LS, Winston FK. Factors associated with adolescents’ propensity to drive with multiple passengers and to engage in risky driving behaviors. J Adolesc Health. 2012;50:634–640. doi: 10.1016/j.jadohealth.2011.10.256. [DOI] [PubMed] [Google Scholar]
- Mosher WD, Jones J. Use Of Contraception In The United States: 1982–2008. National Center for Health Statistics. Vital Health Stat. 2010;23:29. [PubMed] [Google Scholar]
- Muthen B, Muthen L. Mplus User’s Guide. 5. Los Angeles: 2010. http://www.statmodel.com/ugexcerpts.shtml. [Google Scholar]
- Pilgrim CC, Schulenberg JE, O’Malley PM, Bachman JG, Johnston LD. Mediators and moderators of parental involvement on substance use: a national study of adolescents. Prev Sci. 2006;7:75–89. doi: 10.1007/s11121-005-0019-9. [DOI] [PubMed] [Google Scholar]
- O’Malley PM, Johnston LD. Drinking and driving among US high school seniors, 1984–1997. Am J Public Health. 1999;89:678–684. doi: 10.2105/ajph.89.5.678. [DOI] [PMC free article] [PubMed] [Google Scholar]
- Quinn PD, Harden KP. Differential changes in impulsivity and sensation seeking and the escalation of substance use from adolescence to early adulthood. Dev Psychopathol. 2013;25:223–239. doi: 10.1017/S0954579412000284. [DOI] [PMC free article] [PubMed] [Google Scholar]
- Resnick MD, Bearman PS, Blum RW, Bauman KE, Harris KM, Jones J, Tabor J, Beuhring T, Sieving RE, Shew M, Ireland M, Bearinger LH, Udry JR. Protecting adolescents from harm. Findings from the National Longitudinal Study on Adolescent Health. JAMA. 1997;278:823–832. doi: 10.1001/jama.278.10.823. [DOI] [PubMed] [Google Scholar]
- Rose G. Sick individuals and sick populations. Int J Epidemiol. 1985;14:32–38. doi: 10.1093/ije/14.1.32. [DOI] [PubMed] [Google Scholar]
- Rosen BC. Masks and Mirrors: Generation X and the Chamelon Personality. Praeger; Westport, CT: 2001. [Google Scholar]
- Schroth ML. A comparison of sensation-seeking among different groups of athletes and non-athletes. Person Individ Diff. 1995;18:219–222. [Google Scholar]
- Schulenberg JE, Maggs JL. A developmental perspective on alcohol use and heavy drinking during adolescence and the transition to young adulthood. J Stud Alcohol Suppl. 2002:54–70. doi: 10.15288/jsas.2002.s14.54. [DOI] [PubMed] [Google Scholar]
- Seedat S, Scott KM, Angermeyer MC, Berglund P, Bromet EJ, Brugha TS, Demyttenaere K, de Girolamo G, Haro JM, Jin R, Karam EG, Kovess-Masfety V, Levinson D, Medina Mora ME, Ono Y, Ormel J, Pennell BE, Posada-Villa J, Sampson NA, Williams D, Kessler RC. Cross-national associations between gender and mental disorders in the World Health Organization World Mental Health Surveys. Arch Gen Psychiatry. 2009;66:785–795. doi: 10.1001/archgenpsychiatry.2009.36. [DOI] [PMC free article] [PubMed] [Google Scholar]
- Shugart HA. Isn’t it ironic? the intersction of third-wave feminism and Generation X. Women’s Studies in Communication. 2001;24:131–168. [Google Scholar]
- Spear L. The developing brain and adolescent-typical behavior patterns: an evolutionary approach. In: Romer D, Walker EF, editors. Adolescent Psychopathology And The Developing Brain: Integrating Brain And Prevention Science. Oxford; New York: 2007. pp. 9–30. [Google Scholar]
- Spear P. The adolescent brain and age-related behavioral manifestations. Neurosci Biobehav. 2000;24:417–463. doi: 10.1016/s0149-7634(00)00014-2. [DOI] [PubMed] [Google Scholar]
- Stansfield KH, Kirstein CL. Effects of novelty on behavior in the adolescent and adult rat. Dev Psychobiol. 2006;48:10–15. doi: 10.1002/dev.20127. [DOI] [PubMed] [Google Scholar]
- Steinberg L. Risk taking in adolescence: what changes, and why? Ann N Y Acad Sci. 2004;1021:51–58. doi: 10.1196/annals.1308.005. [DOI] [PubMed] [Google Scholar]
- Steinberg L. Risk taking in adolescence: new perspectives from brain and behavioral science. Curr Dir Psychol Sci. 2007;16:55–59. [Google Scholar]
- Steinberg L, Morris AS. Adolescent development. Annu Rev Psychol. 2001;52:83–110. doi: 10.1146/annurev.psych.52.1.83. [DOI] [PubMed] [Google Scholar]
- Thakker J, Durrant R. An Evolutionary Perspective. Substance Use And Abuse: Cultural And Historical Perspectives. Sage Publications; 2003. pp. 34–57. [Google Scholar]
- Weiland BJ, Welsh RC, Yau WY, Zucker RA, Zubieta JK, Heitzeg MM. Accumbens functional connectivity during reward mediates sensation-seeking and alcohol use in high-risk youth. Drug Alcohol Depend. 2013;128:130–139. doi: 10.1016/j.drugalcdep.2012.08.019. [DOI] [PMC free article] [PubMed] [Google Scholar]
- Zuckerman M. Sensation Seeking And Risky Behavior. APA; Washington DC: 2007. [Google Scholar]
Associated Data
This section collects any data citations, data availability statements, or supplementary materials included in this article.