

Abstract
Early childhood is a critical period of auditory learning, during which children are constantly mapping sounds to meaning. But learning rarely occurs under ideal listening conditions—children are forced to listen against a relentless din. This background noise degrades the neural coding of these critical sounds, in turn interfering with auditory learning. Despite the importance of robust and reliable auditory processing during early childhood, little is known about the neurophysiology underlying speech processing in children so young. To better understand the physiological constraints these adverse listening scenarios impose on speech sound coding during early childhood, auditory-neurophysiological responses were elicited to a consonant-vowel syllable in quiet and background noise in a cohort of typically-developing preschoolers (ages 3–5 yr). Overall, responses were degraded in noise: they were smaller, less stable across trials, slower, and there was poorer coding of spectral content and the temporal envelope. These effects were exacerbated in response to the consonant transition relative to the vowel, suggesting that the neural coding of spectrotemporally-dynamic speech features is more tenuous in noise than the coding of static features—even in children this young. Neural coding of speech temporal fine structure, however, was more resilient to the addition of background noise than coding of temporal envelope information. Taken together, these results demonstrate that noise places a neurophysiological constraint on speech processing during early childhood by causing a breakdown in neural processing of speech acoustics. These results may explain why some listeners have inordinate difficulties understanding speech in noise. Speech-elicited auditory-neurophysiological responses offer objective insight into listening skills during early childhood by reflecting the integrity of neural coding in quiet and noise; this paper documents typical response properties in this age group. These normative metrics may be useful clinically to evaluate auditory processing difficulties during early childhood.
Keywords: speech recognition in noise, auditory development, electrophysiology, FFR, auditory processing, cABR
1. Introduction
The world is inherently noisy, forcing talkers and listeners to compete with a constant bedlam of environmental and industrial sounds, additional voices, and more. This acoustic turbulence presents a challenge during early childhood, when children are attempting to make sense of the soundscape by forming precise representations of speech sounds to develop a rich and diverse lexicon. Due to the confluence of auditory and cognitive factors contributing to speech recognition in adverse listening conditions, and the heterogeneous development of central auditory processing, younger children are especially susceptible to the effects of background noise on speech understanding (Hall III et al., 2002; Leibold and Buss, 2013; Wightman and Kistler, 2005). Although this susceptibility abates as children mature, a consequence of this protracted development is that most critical auditory mapping experiences occur before children have achieved adult-like speech recognition in these listening conditions. Success during this early childhood learning process has lifelong implications for auditory perception and cognition, and communication skills more broadly. Poor auditory processing under adverse listening conditions, in turn, has been linked to childhood learning problems (Bradlow et al., 2003; Cunningham et al., 2001; Ziegler et al., 2009; but see Messaoud-Galusi et al., 2011).
The auditory frequency-following response (FFR) is the product of synchronous firing of midbrain nuclei and reflects neural activity necessary for auditory perception in noise (Kraus et al., 2000; Zeng et al., 1999)1. Even subtle dyssynchronies are linked to poor auditory processing in noisy and reverberant listening environments (Anderson et al., 2013b; Fujihira and Shiraishi, 2014; Ruggles et al., 2012) whereas enhancements in subcortical neural synchrony are associated with superior perception in challenging listening scenarios (Anderson et al., 2013c; Bidelman and Krishnan, 2010; Song et al., 2012). We believe, therefore, that the FFR provides a means to explore the neurophysiology contributing to auditory processing in noise.
1.1 The speech-evoked FFR: A snapshot of auditory processing
Auditory-neurophysiological responses reflect neural coding of multiple complex sound features, including the transient and periodic acoustic events found in speech. These response properties are collectively the product of an integrative auditory-cognitive system that is shaped through life experience (Kraus and Nicol, 2014). In fact, the FFR’s neural generators are extensively connected to, and modified by, sensory, limbic, and cognitive circuits. Therefore, our view is that the response reflects experience with sound (for better or worse) and that a thorough evaluation of the response within an individual provides a unique window into auditory processing.
In particular, the FFR to speech can simultaneously quantify the midbrain coding of multiple acoustic properties of speech sounds. Depending on the stimulus and recording paradigm, this may include cues that contribute information about the talker (such as pitch-related information), cues that provide information about what was said (such as formant cues that convey phonemic identity), and temporal cues (such as the envelope and temporal fine structure). This biological mosaic reflects minute aspects of auditory processing with extreme granularity. Interestingly, these elements of neural coding are not necessarily strongly inter-correlated within an individual. Consequently, different populations of listeners have distinct “signature” patterns of response properties that may include relative strengths and weaknesses in the neural processes important for everyday communication (Kraus and Nicol, 2014). Therefore, analyzing multiple aspects of the response within an individual, or group of individuals, can offer converging information about the quality of speech sound coding and, potentially, auditory processing at large. Importantly, a signal response can provide divergent information about the neural processing of orthogonal acoustic cues (White-Schwoch et al., in press).
1.2 Consonants and vowels in quiet and noise
Perceptual evidence from children and adults has shown that consonants are more difficult than vowels to recognize in adverse listening environments (Johnson, 2000). Compared to vowels, consonants comprise acoustic transients (the onset burst) and fast-changing spectral content with relatively low amplitude (the transition to or from the adjacent phoneme); these acoustic properties make consonants more susceptible to masking. Vowels, on the other hand, typically are of longer duration, are higher in intensity, and have relatively stable spectral content.
Speech recognition in noise is more challenging for preschoolers than for older children (Hall III et al., 2002; Leibold and Buss, 2013). Moreover, there is evidence from school-aged children that the neural coding of transient and dynamic speech cues is tenuous in noise relative to quiet, placing a neurophysiological constraint on consonant processing (Cunningham et al., 2001). This consonant liability in noise has been observed in auditory midbrain, thalamus, and cortex using near-field multiunit recordings in an animal model (Cunningham et al., 2002). It is unclear, however, whether and how this susceptibility to masking manifests during early childhood. It is important to understand the course of typical development to lay the groundwork to explore and identify deviations. Children with listening difficulties can exhibit poor auditory-temporal processing that may be characterized as a developmental delay (Wright and Zecker, 2004), and that these children exhibit multimodal deficits parsing signals in noise (Sperling et al., 2005; Ziegler et al., 2009; but see Messaoud-Galusi et al., 2011). Here, our strategy is to examine neural coding of consonants in noise in typically developingchildren, with the aim of providing a neurophysiological framework to explore development, deviations, and individual differences.
At the same time, there is some evidence that listening in noise may carry benefits. For one, there is the phenomenon of “stochastic resonance,” which demonstrates that background noise can improve perceptual thresholds (Douglass et al., 1993), including in the auditory system (Morse and Evans, 1996; Zeng et al., 2000). However, it is important to point out that there is a difference between perceptual acuity and extracting meaning from a signal (e.g., Anderson et al., 2013b; Souza et al., 2007). With regards to learning, Moucha and colleagues (2005) reported that exposing rats to background sounds during a learning task induced spectrotemporal plasticity across the tonotopic map in primary auditory cortex. This may be due to the background sounds emphasizing the contrast between target and non-target stimuli. Although these issues need to be explored in human listeners, they suggest that learning outcomes may be mediated by the listening conditions, and that background noise does not necessarily have a wholly negative effect on auditory learning.
1.3 Current study
To date, auditory-neurophysiological studies of speech processing in noise (and disorders thereof) have been conducted predominantly in children ages 8–15 years old. Children this age have typically received prolonged instruction in language and literacy, and most have either been diagnosed with a learning problem (LP) or “cleared” as typical learners. An ideal approach to investigate auditory processing and its disorders would also measure neural activity in preschoolers. The preschool years are a time of rapid auditory learning and development, and a crucial age for identification of children who may begin to lag behind their peers with respect to language milestones. This approach could also facilitate developmental research aimed at discovering how auditory neurophysiology matures interactively with auditory perception and cognition.
A necessary step in developing such a marker, however, is an understanding of response properties in typically developing children. Thus, the goal of this paper is to delineate the effects of background noise on the speech-evoked FFR in this population. Of particular interest is how noise affects the coding of timing-, pitch-, and harmonic-related aspects of speech, in addition to gross measures of neural function such as the trial-by-trial stability of the response. The following aspects of neural processing are considered: the magnitude of non-stimulus evoked activity (“neural noise”); the amplitudes, the trial-by-trial stability, and the latencies of time-domain responses; the spectral amplitudes of the frequency-domain response; and the precision of coding the temporal envelope of the stimulus.
Theoretically, characterizing these measures in quiet and noise can offer physiological insights into auditory processing in noise during early childhood, which can in turn inform strategies to facilitate auditory learning during critical developmental years. Here, it was hypothesized that background noise diminishes precise neural coding of speech, with a particularly degrading consequence for coding perceptually vulnerable consonant transitions. To test this hypothesis, FFRs were elicited in response to a CV syllable in quiet and a multi-talker background noise. It was predicted that noise would make responses smaller, less stable on a trial-by-trial basis, and slower.
2. Materials and Methods
2.1 Subjects
The goal of this study is to elucidate auditory-neurophysiological response properties in ostensibly typically developing children ages 3–5. Strict inclusionary criteria were therefore adopted. By parental report, no child had a family member with a diagnosis of a learning disability, no history of fetal trauma or of a neurologic, motor, articulatory, or learning problem; and none of the children had a history of physical, occupational, or speech therapy or a diagnosis of autism spectrum disorder. All children were native English-speaking monolinguals.
Children passed a screening of peripheral auditory health (normal otoscopy, Type A tympanograms, and distortion product otoacoustic emissions ≥ 6 dB above the noise floor from 0.5–4 kHz). Each child also had normal click-evoked auditory brainstem responses (identifiable wave V latency of < 5.84 ms in response to a 100 μs square-wave click stimulus presented at 80.4 dB SPL in rarefaction at 31 Hz).
The cohort comprised 58 children (age: M = 49.2 months, SD = 7.3), was balanced for boys (n = 36) and girls (χ2 = 0.057, p = 0.811), and the boys and girls were matched for age (boys M = 48.7 months, SD = 7.2; girls M = 49.8 months, SD = 7.2; t(56) = 0.575, p = 0.568). All children performed normally on an intelligence test (scale scores on the Wechsler Preschool and Primary Scale of Intelligence [Pearson/PsychCorp, San Antonio, TX], verbal subtest M = 13.47, SD = 3.34; non-verbal subtest M = 12.88, SD = 3.05).
Informed consent and assent was obtained from legal guardians and children, respectively, in accordance with the Declaration of Helsinki and as approved by the Northwestern University Institutional Review Board; children were remunerated for their participation.
2.2 Stimuli
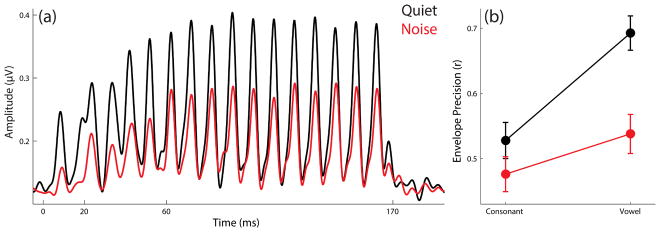
Responses were elicited to a consonant-vowel syllable [da]. The [da] was a 170 ms six-formant stop consonant synthesized at 20 kHz in a Klatt-based synthesizer (SENSYN, Sensimetrics Corporation, Cambridge, MA), with voicing onset at 5 ms, a 50 ms consonant transition, and a 120 ms steady state vowel. The F0 was constant throughout the stimulus at 100 Hz. During the consonant transition (from /d/ to /a/), the lower three formant frequencies changed (F1 400→720 Hz, F2 1700→1240 Hz, and F3 2580→2500 Hz) but were stable in the vowel portion. The upper three formants were steady for the entire stimulus (F4 3300 Hz, F5 3750 Hz, F6 4900). The [da] was presented both in isolation (“quiet” condition) and masked by a background track (“noise” condition). The noise track was 45-s of 6-talker babble adapted from Van Engen and Bradlow (2007). See Figure 1A for a time domain illustration of the [da].
Figure 1.

The stimulus and grand-average responses are presented. Time regions corresponding to the consonant transition and vowel are marked. (A) The [da] stimulus is presented in the time domain. Following the initial onset burst, there is a 50 ms consonant transition during which the lower three formants shift. The 120 ms vowel has a steady spectral content. (B) The grand average FFRENV response is illustrated in quiet (black) and noise (red). Peaks of interest in the latency analysis are labeled. (C) The grand average FFRTFS response is illustrated in quiet (black) and noise (red).
Stimulus presentation was controlled by E-Prime version 2.0 (Psychology Software Tools, Inc., Sharpsburg, PA) and the [da] was presented at 80 dB SPL in alternating polarity with an 81 ms inter-stimulus interval. In the noise condition, [da] was presented at a +10 SNR. The noise was presented as a continuous repeating masking track and there was no phase synchrony between the onsets of the [da] and the noise track.
2.3 Electrophysiology
2.3.1 Recording
For most subjects, [da] in quiet and noise were collected in a single test session (40–50 minutes); in some cases, children required a break or a second session. Subjects sat in an electrically-shielded and sound-attenuated booth (IAC Acoustics, Bronx, NY) while watching a film to facilitate a relaxed state. Stimuli were presented monaurally to the right ear via electromagnetically shielded insert earphones (ER-3A, Etymōtic Research, Elk Grove Village, IL). The left ear was unoccluded so children could hear the movie soundtrack (< 40 dB SPL in sound field). The goal was to collect 4000 artifact-free trials for each stimulus from each child, and so ~4200 stimulus trials were presented.
Responses were recorded differentially with a BioSemi Active2 system (BioSemi, Amsterdam, The Netherlands) with ActiABR module via LabView 2.0 (National Instruments, Austin, TX). A vertical recording montage was used with active at Cz, references at each ear, and CMS/DRL equidistant from Fpz (1 cm on either side). Only ipsilateral responses were used in analysis. Responses were digitized at 16.384 kHz with an online bandpass filter of 100–3000 Hz (6.02 dB/octave roll-off). Offset voltages for all electrodes were < 50 mV.
2.3.2 Data processing
Responses were offline amplified in the frequency domain 6.02 dB/octave for 3 decades below 100 Hz. Amplified responses were bandpass filtered from 70–2000 Hz (12 dB/octave roll-off, Butterworth filter, zero phaseshift). Responses were epoched from −40 to 210 ms (re: stimulus onset) and baseline-corrected relative to the prestimulus period. Responses exceeding ±35 μV were rejected as artifact. Final responses comprised 2000 sweeps of each stimulus polarity.
Presenting stimuli in opposing polarity allows evaluation of the neural coding of two orthogonal temporal components in speech: the temporal envelope (ENV) and the temporal fine structure (TFS). Responses to the opposing polarities were added to emphasize the envelope-following response (FFRENV) and subtracted to emphasize the temporal fine structure-following response (FFRTFS) (Anderson et al., 2013a). For brevity, the FFRENV and FFRTFS are referred to collectively as the two temporal “components” of the response.
All data processing was conducted in MATLAB (Mathworks, Inc., Natick, MA) using custom routines. These computer programs are available upon request.
2.4 Electrophysiological analyses
A number of analytic techniques were pursued. The FFR is an unusually rich auditory evoked potential that offers insights into neural processing with extreme granularity, ranging from gross measures such as response amplitude to minute measures such as coding of specific speech harmonics. The measures that are included here are: pre-stimulus response amplitude, response amplitude, intertrial stability of the responses, latency of the responses, spectral coding, and the precision of coding the temporal envelope. These are summarized in Table 1.
Table 1.
Summary of results across neurophysiological measures; indicated are levels of statistical significance for degradation in noise (main effect of condition), if the response to the consonant transition was weaker than the response to the vowel (main effect of time region), and if the response degradation was exacerbated in response to the consonant transition (condition × time region interaction).
| Measure | § | Degraded by noise | Response to consonant weaker | Response to consonant more degraded by noise |
|---|---|---|---|---|
| Pre-stimulus amplitude | 3.1.1 | |||
| Response amplitude | 3.1.2 | *** | *** | |
| Response stability | 3.2 | *** | *** | ** |
| Latency | 3.3 | *** | n/a | *** |
| Spectral coding | ||||
| FFRENV | 3.4.2 | *** | ***a | *** |
| FFRTFS | 3.4.3 | *** | ***a | |
| Envelope precision | 3.5 | *** | *** | ** b |
p < .01,
p ≤ .001.
These results were inconsistent between responses to individual harmonics, please refer to Results 3.4 and Fig. 5 for a breakdown for each harmonic.
This pattern was reversed for envelope precision: the response to the vowel was more degraded by noise than the response to the consonant transition.
2.4.1 Response amplitude
Root mean square (RMS) amplitude was used to quantify the magnitude of response and pre-stimulus (i.e., nonresponse) activity. RMS is calculated by (1) squaring each point in a response waveform, (2) computing the mean of the squared values, and then (3) taking the square root of the mean. Amplitudes were computed for the pre-stimulus period (−40 to 0 ms), the entire response (5–180 ms), the response to the consonant transition (20–60 ms), and the response to the vowel (60–170 ms). The pre-stimulus region constitutes the “noise floor” of the response; that is, the amplitude of the averaged EEG activity corresponding to the period of silence between each presentation of the [da] (i.e. the interstimulus interval). The quotient of response amplitude in a time window and pre-stimulus amplitude provided a measure of response signal-to-noise ratio (SNR). SNRs were computed across three time regions: the entire response (amplitude of 5–180 ms/amplitude of −40-0 ms) the response to the consonant transition (amplitude of 20–60 ms/amplitude of −40-0 ms) and the response to the vowel (amplitude of 60–170 ms/amplitude of −40-0 ms). These procedures were conducted for both FFRENV and FFRTFS.
2.4.2 Trial-by-trial stability
To compute a measure of the trial-by-trial stability of the response, the filtered, epoched, and baselined responses were re-averaged offline in MATLAB. Two “paired” sub-averages were computed. Each sub-average comprised 2000 randomly sampled (without replacement) sweeps from the response (for example, if one sub-average had sweeps 1, 2, 4, 7, …, 2000 then its companion sub-average would have sweeps 3, 5, 6, 8, …, 1999). These two sub-averages were correlated to compute a Pearson product-moment correlation coefficient (r). This process was performed 300 times for each response, each time selecting random subsets of sweeps; the mean of these 300 sets of paired-average correlations was computed. Pearson’s r’s were Fisher transformed to z-scores for statistical purposes (Cohen et al., 2003). Correlations were performed over three time ranges corresponding to the entire response (5–180 ms), the response to the consonant transition (20–60 ms), and the response to the vowel (60–170 ms). These procedures were conducted for both FFRENV and FFRTFS.
2.4.3 Latency
To analyze subcortical neural timing, peaks in the responses were manually identified. The goal of this procedure is to determine the latencies of positive- and negative-going deflections in the response (see Fig. 1B) that reflect the onset response (to the stop burst in the /d/) and subsequent phaselocking to the stimulus F0. Peaks were labeled according to a reference latency (e.g., a peak occurring at about 31 ms after stimulus onset would be called “peak 31”). Positive going “peaks” were given odd-numbered labels and negative-going “troughs” were given even-numbered labels. The onset peak was identified as peak 7, consonant transition peaks were 21, 31, 41, 51, and vowel peaks were 61, 71, 81, 91, 101, …, 161. The troughs were always 1 ms later (8, 22, 32, 42, … 162.) An automated peak detection program in Neuroscan Edit 4.5 (Compumedics, Charlotte, NC) was used to label peaks using local minimum and maximum detection. Two trained individuals, blind to stimulus condition but in consultation with the population grand average and two sub-averages of a given response, identified each peak of interest in the response. A third trained individual confirmed each peak identification. This procedure was only applied to FFRENV, because subtracting the responses to opposing polarities (i.e., FFRTFS) essentially eliminates the “major” F0-locked peaks that are of interest in the timing analysis (see Fig. 1C).
To corroborate timing results gleaned from peak latencies the responses were cross-correlated with the stimulus. This provides a common reference point for responses in quiet and noise; both are yoked to a signal with identical timing (the stimulus) and the cross-correlation lag between stimulus and response is taken as an index of neural timing. The stimulus waveform was resampled to have the same number of points as the responses, and then the two were cross-correlated with a time lag window of 5 to 12 ms. The lag that achieves the maximum correlation between the stimulus and response is reported; separate cross-correlations between the stimulus and the responses were run over time regions corresponding to the consonant transition (20–60 ms) and the vowel (60–170 ms).
2.4.4 Spectral coding
A fast Fourier transformation (FFT) was applied to responses to gauge the magnitude of neural phaselocking at specific frequencies. Average spectral amplitudes were calculated from each response. A 16,384 point FFT was computed with a 10 ms ramp for responses to the consonant transition (20–60 ms) and vowel (60–170 ms) and amplitudes were computed over 40 Hz bins for F0 (100 Hz) and its integer harmonics up to 1000 Hz (H2-10). This procedure was conducted both for FFRENV and FFRTFS.
2.4.5 Envelope precision
To analyze the fidelity of neural coding of the stimulus envelope, the stimulus was bandpass filtered to match the filtering of the responses (70–2000 Hz, 12 dB/octave roll-off). Hilbert transformations were applied to both the stimulus and the responses (FFRENV) to extract the temporal envelopes, and then each were low-pass filtered at 200 Hz (see Fig. 5). To calculate the precision between the stimulus and children’s neural coding of the envelope, a cross-correlation was performed between the stimulus and the response envelopes in quiet and noise (5–12 ms lag window). The maximum correlation is reported (r; converted to Fisher z for statistical purposes). Stimulus-to-response envelope correlations were run over time regions corresponding to the consonant transition (20–60 ms) and the vowel (60–170 ms).
Figure 5.

Grand average spectra are shown for responses in quiet (black) and noise (red) for responses to the consonant transition (left, A/C) and vowel (right, B/D) for FFRENV (top, A/B) and FFRTFS (bottom, C/D).
2.5 Statistical analyses
This study employed a multilevel repeated measures design: responses were elicited to the same syllable (comprising a consonant transition and a vowel) in two conditions (quiet and noise). Thus, the primary statistical approach was a 2 (time region: consonant transition vs. vowel) × 2 (condition: quiet vs. noise) repeated measures analysis of variance (RMANOVA). As indicated in several cases, a third factor was included (temporal component: FFRENV vs. FFRTFS).
The peak latency measures had a different number of variables across responses to the stimulus onset (2 peaks), consonant transition (8 peaks), and vowel (22 peaks); RMANOVA was therefore not appropriate. Instead, peak latencies were submitted to a mixed-effects model with response time region, noise condition, and peak polarity (positive or negative deflection; see Fig. 1B) as fixed effects and subject as a random effect.
In all cases variables conformed to the assumptions of the general linear model (Shapiro-Wilk test for normality, Levene’s test for homogeneity of variance, and where appropriate Mauchly’s test for sphericity) and all p-values reflect two-tailed tests.
3. Results
Grand-average responses in quiet and noise are illustrated in Figure 1. As may be seen, responses in noise tend to be smaller than those in quiet, especially for FFRENV. Each individual child’s responses in quiet and noise are illustrated in Figure 2. Variability between children is observed with respect to response size and morphology. However, we note a striking morphological coherence between each individual child’s responses in quiet and noise. That is, the children who tend to have larger responses in quiet also tend to have larger responses in noise, and the children who tend to have smaller responses in quiet tend to have smaller responses in noise. It is as though each child has a “signature” morphological response profile that is preserved across listening conditions.
Figure 2.

Each individual child’s responses are plotted in quiet (black) and noise (red). Illustrated are FFRENV responses in the time domain. Each panel is plotted on the same scale, with the axes labeled in the lower left-hand panel.
3.1 Amplitudes of the noise floor & response
3.1.1 Non-stimulus-evoked activity (noise floor)
The pre-stimulus time region, corresponding to neural activity in the absence of stimulation, had amplitudes < 0.1 μV (≈ 0.09 μV; SDs ≈ 0.02) which yielded signal-to-noise ratios > 2 (FFRENV in quiet; SDs ≈ 0.5), ≈ 1.6 (FFRENV in noise; SDs ≈ 0.5–0.6), and ≈ 1.5 (FFRTFS in quiet and noise; SDs ≈ 0.4–0.5).
The noise floor amplitude was equivalent between responses in quiet and noise (F(1,57) = 0.024, p = 0.877, η2 < 0.001). It was also equivalent between FFRENV and FFRTFS (F(1,57) = 0.067, p = 0.796, η2 = 0.001), and there were no interactions between stimulus condition (quiet vs. noise) and temporal component (FFRENV vs. FFRTFS, F(1,57) = 0.342, p = 0.561, η2 = 0.066). This suggests that the addition of background noise during a recording session does not affect spontaneous neural activity as reflected by FFR. It is therefore presumed that none of the background noise effects reported elsewhere in this paper are influenced by this non-stimulus evoked activity.
See Table 2 for noise floor amplitudes across conditions and time regions for FFRENV and FFRTFS.
Table 2.
Mean response amplitudes (μV), signal-to-noise ratios, and trial-by-trial stability estimates (Pearson’s r) are reported (with standard deviations) across conditions and time regions for both FFRENV and FFRTFS.
| Quiet | Noise | ||||
|---|---|---|---|---|---|
| FFRENV | FFRTFS | FFRENV | FFRTFS | ||
| Response Amplitude (μV) | Pre-stimulus (−40-0 ms) | 0.097 (0.024) | 0.095 (0.025) | 0.096 (0.022) | 0.023 (0.023) |
| Consonant transition (20–60 ms) | 0.185 (0.038) | 0.135 (0.030) | 0.142 (0.041) | 0.129 (0.027) | |
| Vowel (60–170 ms) | 0.203 (0.050) | 0.137 (0.031) | 0.162 (0.042) | 0.134 (0.028) | |
| Entire Response (5–180 ms) | 0.191 (0.041) | 0.132 (0.029) | 0.152 (0.036) | 0.131 (0.025) | |
| Signal-to-Noise Ratio | Consonant transition (20–60 ms) | 2.003 (0.511) | 1.478 (0.404) | 1.512 (0.414) | 1.409 (0.586) |
| Vowel (60–170 ms) | 2.187 (0.644) | 1.500 (0.404) | 1.756 (0.640) | 1.511 (0.632) | |
| Entire Response (5–180 ms) | 2.064 (0.554) | 1.450 (0.369) | 1.634 (0.512) | 1.440 (0.570) | |
| Trial-by-trial stability (Pearson’s r) | Consonant transition (20–60 ms) | 0.597 (0.247) | 0.342 (0.222) | 0.359 (0.212) | 0.297 (0.260) |
| Vowel (60–170 ms) | 0.638 (0.269) | 0.347 (0.218) | 0.470 (0.270) | 0.336 (0.271) | |
| Entire Response (5–180 ms) | 0.605 (0.245) | 0.319 (0.202) | 0.416 (0.236) | 0.300 (0.252) | |
3.1.2 Stimulus-evoked activity
In the time domain, FFRENV amplitudes ranged from ≈ 0.13–0.20 μV (SDs ≈ 0.04–0.05), and FFRTFS amplitudes were ≈ 0.13 μV (SDs ≈ 0.03). FFRENV response amplitudes were reduced by about 20% in noise, whereas FFRTFS amplitudes were only reduced marginally.
Overall, responses were smaller in noise for both the consonant transition and the vowel, irrespective of temporal component (main effect of condition, F(1,57) = 24.743, p < .001, η2 = 0.303). Responses to the vowel were larger than those to the consonant across both noise conditions and irrespective of temporal component (main effect of time region, F(1,57) = 46.499, p < .001, η2 = 0.449). Moreover, FFRTFS were smaller than FFRENV across conditions and response regions (main effect of component, F(1,57) = 86.546, p < .001, η2 = 0.603).
Additionally, FFRENV amplitudes were more degraded in noise than FFRTFS (condition × component interaction, F(1,57) = 14.430, p < .001, η2 = 0.202). This was likely due to the already relatively low amplitude of FFRTFS responses in the quiet condition. Noise degraded response amplitudes to the consonant and vowel equivalently (no condition × time region interaction, F(1,57) = 1.856, p = 0.178, η2 = 0.032). The FFRENV vs. FFRTFS amplitude difference of the vowel region was larger than the difference in the consonant region across noise conditions (response region × component interaction, F(1,57) = 102.034, p < .001, η2 = 0.642). This was the case for both responses in quiet and noise (i.e. there was no condition × time region × component interaction, F(1,57) = 0.732, p = 0.396, η2 = 0.013).
The response signal-to-noise ratio (SNR) was also calculated (see Methods 2.4.1). As is expected by similarities in noise floor amplitudes, all patterns of effects observed for the response amplitudes were paralleled for the SNRs.
See Table 2 for a full list of amplitudes and SNRs for responses in quiet and noise for FFRENV and FFRTFS.
3.2 Trial-by-trial stability
The response stability is expressed as a correlation coefficient (Pearson’s r) and so has an upper limit of 1. These values are presented across conditions and time regions for FFRENV and FFRTFS in Table 2. In quiet, FFRENV stability estimates were in the range of r ≈ 0.6 (SDs ≈ 0.3). These scores were approximately halved for FFRENV in noise (r ≈ 0.4; SDs ≈ 0.2) and for FFRTFS in quiet (r ≈ 0.35; SDs ≈ 0.=2); scores were lowest for FFRTFS in noise (r ≈ 0.3; SDs ≈ 0.2).
Responses in quiet were more stable across trials than responses in noise, irrespective of time region or temporal component (main effect of condition, F(1,57) = 31.511, p < .001, η2 = 0.356). The response to the vowel was more stable than the response to the consonant transition, irrespective of noise condition or temporal component (main effect of time region, F(1,57) = 24.920, p < .001, η2 = 0.304). Additionally, across time regions and noise conditions, stability estimates were higher for FFRENV than for FFRTFS (main effect of component, F(1,57) = 102.103, p < .001, η2 = 0.642).
Relative to the response to the vowel, noise disproportionately reduced trial-by-trial stability in response to the consonant transition (condition × time region interaction, F(1,57) = 11.734, p = .001, η2 = 0.171). Likewise, noise disproportionately reduced the stability of FFRENV relative to the FFRTFS (condition × component interaction, F(1,57) = 102.377, p < .001, η2 = 0.642). Additionally, the difference in response stability between the responses to the consonant transition and vowel was larger for FFRENV than FFRTFS, likely due to the overall low stability estimated in FFRTFS (time region × component interaction, F(1,57) = 12.713, p = .001, η2 = 0.182). This was the case for responses in quiet and noise (i.e., there was no condition × time region × component interaction, F(1,57) = 1.177, p = 0.161, η2 = 0 .020).
See Table 2 for a full list of stability estimates for responses in quiet and noise for FFRENV and FFRTFS.
3.3 Response latency
Noise delayed response timing. On average, responses in noise were 0.3 ms later than responses in quiet. The onset response was the most delayed by noise (0.6 ms; SD 0.9 ms) followed by the response to the consonant transition (0.5 ms; SD 0.9 ms) and then the vowel with the smallest noise delay (0.3 ms; SD 0.6 ms).
Overall, irrespective of time region responses to speech in quiet were earlier than responses to speech in noise (main effect of condition, F(1,57) = 111.510, p < .001, η2 = 0.662). This was the case for both the positive going response “peaks” and the negative-going “troughs” that follow each peak (there was no condition × polarity interaction, F(1,69) = 2.264, p = .111, η2 = 0.044). In response to the onset and consonant transition, there was a larger peak-to-trough timing discrepancy than in response to the vowel (time region × polarity interaction, F(2,114) = 135.636, p < .001, η2 = 0.704).
There was a greater noise-induced latency shift in response to the onset and consonant transition than to the vowel (condition × time region interaction, F(2,114) = 7.003, p = .001, η2 = 0.109). This was the case for both peaks and troughs (i.e., there was no condition × time region × polarity interaction, F(2,114) = 0.465, p = .629, η2 = 0.008).
Mean peak latencies are reported in Table 3, and Figure 3 illustrates the noise-induced timing delay for each peak and trough in the onset, consonant transition, and vowel responses.
Table 3.
Response latencies (ms; with standard deviations) are reported for response peaks comprising the response to the stimulus onset, consonant transition, and vowel in quiet and noise. By convention, peaks are named with a number approximating their expected latencies. Odd numbers are positive-going peaks; even numbers are negative-going troughs. See Figure 1A for an average response with peaks labeled and Figure 3 for quiet-to-noise timing shifts for each peak and trough.
| Quiet | Noise | ||
|---|---|---|---|
| Onset | 7 | 7.51 (0.52) | 8.11 (0.68) |
| 8 | 8.88 (0.68) | 9.60 (0.57) | |
| Consonant | 21 | 22.02 (0.74) | 22.57 (0.74) |
| 22 | 23.52 (0.94) | 24.03 (0.90) | |
| 31 | 31.62 (0.61) | 32.15 (0.84) | |
| 32 | 32.94 (0.84) | 33.53 (1.10) | |
| 41 | 41.52 (0.39) | 41.95 (0.65) | |
| 42 | 42.76 (0.55) | 43.20 (0.76) | |
| 51 | 51.54 (0.30) | 51.83 (0.68) | |
| 52 | 52.66 (0.47) | 53.02 (0.82) | |
| Vowel | 61 | 61.63 (0.27) | 61.89 (0.42) |
| 62 | 62.74 (0.28) | 63.05 (0.58) | |
| 71 | 71.64 (0.26) | 71.99 (0.58) | |
| 72 | 72.80 (0.36) | 73.17 (0.68) | |
| 81 | 81.67 (0.26) | 81.96 (0.55) | |
| 82 | 82.81 (0.35) | 83.11 (0.60) | |
| 91 | 91.74 (0.45) | 91.99 (0.68) | |
| 92 | 92.89 (0.54) | 93.13 (0.72) | |
| 101 | 101.69 (0.24) | 101.89 (0.36) | |
| 102 | 102.83 (0.32) | 103.04 (0.46) | |
| 111 | 111.68 (0.24) | 111.96 (0.57) | |
| 112 | 112.83 (0.34) | 113.15 (0.62) | |
| 121 | 121.68 (0.23) | 121.92 (0.56) | |
| 122 | 122.86 (0.30) | 123.10 (0.56) | |
| 131 | 131.66 (0.29) | 131.94 (0.62) | |
| 132 | 132.83 (0.33) | 133.19 (0.68) | |
| 141 | 141.69 (0.26) | 141.92 (0.53) | |
| 142 | 142.81 (0.37) | 143.10 (0.65) | |
| 151 | 151.66 (0.22) | 151.94 (0.49) | |
| 152 | 152.76 (0.30) | 153.19 (0.56) | |
| 161 | 161.69 (0.26) | 161.91 (0.32) | |
| 162 | 162.82 (0.33) | 162.98 (0.42) | |
Figure 3.

Group average quiet-to-noise timing shifts (ms) are displayed for all response peaks. Responses to the onset and consonant transition are delayed more than responses to vowel by the addition of background noise. Error bars reflect +1 SEM.
3.3.1 Reliability of peak latencies
Because latency selection involved manual identification (experimenters adjusting local maxima and minima detected by a computer algorithm; see Methods 2.4.3) the internal consistency between peak latencies (Cronbach’s α) within each time region and condition was calculated to gauge the reliability of this method. Essentially, this provides a measure of the internal consistency of the peaks comprising responses in each time region, and reflects the shared variance between each.
Across time regions and conditions, reliability estimates were high (ranging from α = 0.764 to α = 0.942; see Table 4). As might be expected, the response to the vowel had the highest reliability in quiet and noise. This was likely because the response is most robust in the vowel than other regions, and because stimulus frequencies are stable during this portion of the speech token. Importantly, reliability estimates were essentially equivalent across stimulus conditions. This supplementary analysis suggests that despite the fact that peak latencies are not computed automatically (unlike other analyses such as response amplitude, trial-by-trial stability, and spectral coding) they may still provide a statistically rigorous index of neurophysiological processing, both for responses in quiet and noise.
Table 4.
Reliability estimates (Cronbach’s α) are reported for peak latencies in quiet and noise for the onset, consonant transition, and vowel. By convention, all estimates are in the “good” to “excellent” range of reliability.
| Quiet | Noise | |
|---|---|---|
| Onset | 0.791 | 0.764 |
| Consonant transition | 0.848 | 0.846 |
| Vowel | 0.968 | 0.942 |
3.3.2 Cross-correlation lag
When using the fully automated stimulus-to-response cross-correlation lag measures, an identical pattern of timing results was observed when using peak latencies. Responses in quiet were faster than those in noise (i.e., had a smaller lag; main effect of condition, F(1,57) = 19.000, p < .001, η2 = 0.250). The response to the consonant transition was more delayed by noise than the response to the vowel (condition × time region interaction, F(1,57) = 4.888, p = .031, η2 = 0.079). This secondary analysis provides confirmation of the timing results employing peak latencies.
Stimulus-to-response cross-correlation lags are illustrated for responses in quiet and noise in Figure 4.
Figure 4.

Group average stimulus-to-response cross-correlation lags are illustrated. The cross-correlation provides an objective confirmation of latencies gleaned from peak picking. The response to the consonant transition is relatively later in noise than in quiet as compared to the response to the vowel.
3.4 Spectral coding
Spectra were visually inspected to ascertain which harmonics are reliably present in the responses. In FFRENV, responses to the F0 and integer harmonics up to H10 were detectable. In the FFRTFS, only harmonics H2 through H10 were detectable. Thus, the spectral coding in FFRENV and FFRTFS were analyzed separately. Responses to the first formant (H4 through H7) were reliably represented in both FFRENV and FFRTFS, and so only these harmonics were used to compare the two temporal components across quiet and noise.
Grand average spectra are illustrated in Figure 5 and mean spectral amplitudes (with SDs) are presented in Table 5.
Table 5.
Mean spectral amplitudes (in nV, with SDs) are presented for responses in quiet and noise, for responses to the consonant transition and vowel, and for FFRENV and FFRTFS.
| Consonant transition | ||||
|---|---|---|---|---|
| Quiet | Noise | |||
| FFRENV | FFRTFS | FFRENV | FFRTFS | |
| F0 | 71.88 (26.54) | n/a | 43.49 (26.50) | n/a |
| H2 | 52.12 (24.95) | 32.81 (17.71) | 39.07 (22.91) | 28.88 (13.36) |
| H3 | 25.62 (11.83) | 19.83 (10.34) | 22.10 (11.39) | 23.95 (11.71) |
| H4 | 24.05 (13.37) | 17.46 (0.07) | 17.32 (9.10) | 18.20 (9.63) |
| H5 | 28.24 (14.15) | 17.39 (12.97) | 14.97 (8.61) | 15.67 (8.97) |
| H6 | 16.83 (7.93) | 16.97 (12.11) | 9.59 (5.45) | 18.39 (14.51) |
| H7 | 10.41 (5.41) | 12.18 (7.51) | 5.72 (3.40) | 12.52 (8.10) |
| H8 | 5.31 (2.95) | 8.93 (5.07) | 4.29 (2.67) | 8.12 (5.03) |
| H9 | 6388 (4.56) | 7.37 (4.12) | 4.91 (3.22) | 6.23 (3.62) |
| H10 | 4.81 (2.60) | 8.34 (4.42) | 3.74 (2.00) | 6.85 (3.45) |
| Vowel | ||||
| Quiet | Noise | |||
| F0 | 46.56 (20.22) | n/a | 35.97 (15.53) | n/a |
| H2 | 44.38 (19.67) | 19.72 (10.10) | 31.01 (0.19) | 20.17 (10.90) |
| H3 | 27.67 (10.83) | 14.92 (7.21) | 19.49 (0.22) | 14.03 (7.80) |
| H4 | 40.17 (17.19) | 18.57 (8.73) | 29.57 (15.34) | 19.35 (8.57) |
| H5 | 40.64 (21.80) | 18.27 (8.63) | 27.38 (17.84) | 16.87 (7.93) |
| H6 | 15.40 (6.63) | 12.11 (6.18) | 10.69 (5.14) | 11.66 (7.44) |
| H7 | 8.74 (4.48) | 28.21 (16.98) | 5.50 (2.94) | 26.51 (16.95) |
| H8 | 6.40 (3.21) | 12.19 (8.32) | 4.12 (2.22) | 12.61 (7.64) |
| H9 | 6.67 (4.12) | 8.70 (4.25) | 5.53 (3.60) | 7.94 (4.88) |
| H10 | 4.983 (2.63) | 7.93 (4.29) | 4.43 (0.83) | 8.15 (4.21) |
3.4.1 Summary of spectral results
There were inconsistent effects of background noise on spectral coding across harmonics and across FFRENV vs. FFRTFS—the amplitudes of some harmonics were larger in noise, some were smaller, and some were equivalent. For example, whereas spectral amplitudes for FFRENV were essentially half as large in noise as in quiet, amplitudes were about equivalent between quiet and noise for FFRTFS.
This pattern (or lack thereof) supports the idea that FFRENV and FFRTFS reflect temporal components of speech that may be coded orthogonally and have distinct noise profiles (Henry and Heinz, 2012; Ruggles et al., 2012). This finding is also consistent with computational models that suggest that TFS coding may be relatively resilient to noise (Shamma and Lorenzi, 2013).
3.4.2 FFRENV
Irrespective of time region or harmonic, spectral amplitudes were lower in noise than in quiet for FFRENV (F(10,48) = 17.736, p < .001, η2 = 0.787). Spectral amplitudes differed between responses to the consonant and the vowel overall (F(10,48) = 15.728, p < .001, η2 = 0.766) with distinct patterns for different harmonics (see Table 6 and Fig. 5). In other words, some harmonics were larger in response to the consonant transition whereas others were larger in response to the vowel. This is not necessarily surprising given that the spectral differences between the /d/ and /a/ in the stimulus (see Methods 2.2). Noise differentially affected amplitudes in response to the consonant and vowel (condition × time region interaction, F(10,48) = 5.994, p < .001, η2 = 0.555) but once again the pattern of results differed between frequencies.
Table 6.
RMANOVA results considering spectral amplitudes in response to the consonant transition and vowel in quiet and noise for FFRENV and FFRTFS. F statistics are reported along with effect sizes (η2). Please refer to Fig. 5 for an illustration of noise effects across harmonics for FFRENV and FFRTFS.
| Quiet vs. Noise (Main effect of condition) | Consonant transition vs. Vowel (Main effect of time region) | Distinct effects of noise on time regions (Condition × time region) | |||||
|---|---|---|---|---|---|---|---|
| F | η2 | F | η2 | F | η2 | ||
| FFRENV | F0 | 84.763*** | 0.598 | 44.771*** | 0.440 | 25.421*** | 0.308 |
| H2 | 31.193*** | 0.354 | 11.775*** | 0.171 | 0.004 | < 0.001 | |
| H3 | 25.713*** | 0.311 | 0.050 | 0.001 | 3.716~ | 0.061 | |
| H4 | 36.783*** | 0.392 | 75.516*** | 0.570 | 3.223~ | 0.054 | |
| H5 | 98.460*** | 0.633 | 40.069*** | 0.367 | < 0.001 | < 0.001 | |
| H6 | 70.111*** | 0.552 | 0.045 | 0.001 | 4.622* | 0.075 | |
| H7 | 70.749*** | 0.554 | 4.801* | 0.078 | 4.387* | 0.071 | |
| H8 | 21.568*** | 0.275 | 2.396 | 0.040 | 4.144* | 0.068 | |
| H9 | 14.388*** | 0.202 | 0.390 | 0.007 | 2.598 | 0.044 | |
| H10 | 8.383** | 0.128 | 1.434 | 0.236 | 1.201 | 0.021 | |
| FFRTFS | H2 | 0.833 | 0.014 | 56.172*** | 0.496 | 2.435 | 0.041 |
| H3 | 1.377 | 0.024 | 44.199*** | 0.437 | 4.277* | 0.070 | |
| H4 | 0.594 | 0.010 | 0.990 | 0.017 | < 0.001 | < 0.001 | |
| H5 | 2.253 | 0.038 | 0.587 | 0.010 | 0.032 | 0.001 | |
| H6 | 0.188 | 0.003 | 17.198*** | 0.232 | 2.504 | 0.042 | |
| H7 | 0.540 | 0.009 | 107.282*** | 0.653 | 2.733 | 0.046 | |
| H8 | 0.152 | 0.003 | 43.327*** | 0.432 | 3.362~ | 0.056 | |
| H9 | 4.931~ | 0.080 | 12.088** | 0.175 | 0.237 | 0.004 | |
| H10 | 1.836 | 0.031 | 0.943 | 0.016 | 8.540 | 0.130 | |
p < 0.10;
p < 0.05;
p < .01;
p < .001.
Mean spectral amplitudes are reported in Table 5 and spectra are illustrated in Figure 5A/B. Full results of the RMANOVA are presented in Table 5. Across time regions, all harmonic amplitudes were smaller in noise than in quiet. Both in quiet and noise, F0, H2, and H7 amplitudes were larger in response to the consonant than the vowel, whereas H4 and H5 amplitudes were larger in response to the vowel; H3, H6, and H8-10 amplitudes were equivalent in response to the consonant and vowel. With respect to relative noise effects on responses to the consonant and vowel, the consonant response was more degraded at F0, H6, and H7, the vowel region was more degraded for H8, and the effect was equivalent for H2-5 and H9-10.
3.4.3 FFRTFS
Overall, spectral amplitudes were equivalent in quiet and noise for FFRTFS (F(9,49) = 1.031, p = .429, η2 = 0.159). Spectral amplitudes differed in response to the consonant and vowel (F(9,49) = 28.284, p < .001, η2 = 0.839) with distinct patterns for different harmonics (see Table 6 and Fig. 5). Noise differentially affected amplitudes in response to the consonant and vowel (F(9,49) = 5.206, p < .001, η2 = 0.489) but once again the pattern of results differed between frequencies.
Mean spectral amplitudes are reported in Table 5 and spectra are illustrated in Figure 5C/D. Full results of the RMANOVA are presented in Table 6. Across time regions, harmonic amplitudes were equivalent between quiet and noise. Both in quiet and noise, H2, H3, and H6 were larger in response to the consonant than the vowel, whereas H7-9 were larger in response to the vowel, and H4, H5, and H10 were equivalent. With respect to relative noise effects on responses to the consonant and vowel, the consonant response was more degraded at H3 and the effect was equivalent for H4, H5, and H9.
3.4.4 Comparison of FFRENV & FFRTFS spectra
Responses to the first formant (H4-7) were reliably represented both for FFRENV and FFRTFS. Thus, these four harmonics were used to compare responses across conditions, time regions, and temporal components (i.e., FFRENV vs. FFRTFS). Overall, responses to the first formant were larger in quiet than in noise (F(4,54) = 16.762, p < .001, η2 = 0.544); responses to the vowel were larger than response to the consonant transition (F(4,54) = 31.354, p < .001, η2 = 0.699); and FFRENV was larger than FFRTFS (F(4,54) = 28.698, p < .001, η2 = 0.680).
When considering spectral coding of FFRENV and FFRTFS in tandem, spectral amplitudes in response to the consonant transition were more affected by noise than responses to the vowel (condition × time region interaction, F(4,54) = 25.368, p < .001, η2 = 0.653). In general, FFRENV spectra were smaller in response to the consonant transition and in noise, whereas FFRTFS spectra did not differ between time regions and conditions. However, these effects were inconsistent between harmonics, meaning that FFRENV and FFRTFS responses were affected differently in response to the consonant transition and vowel (time region × temporal component, F(4,54) = 34.353, p < .001, η2 = 0.718) across both quiet and noise (i.e. there was no noise condition × temporal component interaction, F(4,54) = 0.437, p = 0.781, η2 = 0.031; given this, there was a condition × time region × temporal component interaction, F(4,54) = 4.006, p = .006, η2 = 0.229).
3.5 Envelope precision
The envelope precision measure is expressed as a Pearson’s r and so has an upper limit of 1. Most responses were on the order of r ≈ 0.6 (SDs ≈ 0.2); these estimates were highest for response to the vowel in quiet (r ≈ 0.7; SD ≈ 0.2) and lowest for the response to the consonant transition in noise (r ≈ 0.5; SD ≈ 0.2).
Irrespective of time region, neural coding of the temporal envelope was more accurate in quiet than in noise (F(1,57) = 26.150, p < .001, η2 = 0.314). Irrespective of noise condition, this coding was more accurate in response to the vowel than in response to the consonant (F(1,57) = 34.241, p < .001, η2 = 0.375). Finally, the envelope response to the vowel was more degraded by background noise than the envelope response to the consonant transition (condition × time region interaction, F(1,57) = 14.159, p < .001, η2 = 0.199).
See Table 7 for a full list of values; grand average response envelopes are illustrated in Figure 6.
Table 7.
Mean envelope precision values (Pearson’s r) are reported (with SDs) in quiet and noise for responses to the consonant transition (20–60 ms), the vowel (60–170 ms), and the entire response (5–180 ms).
| Quiet | Noise | |
|---|---|---|
| Consonant transition | 0.528 (0.211) | 0.476 (0.204) |
| Vowel | 0.692 (0.201) | 0.537 (0.229) |
| Entire Response | 0.624 (0.202) | 0.503 (0.224) |
Figure 6.
Envelope components of grand average responses in quiet (black) and noise (red) are illustrated. (A) Envelopes were extracted from the responses using a Hilbert transform, and these were cross-correlated to the stimulus envelope to evaluate the fidelity with which this information is coded. B) Group average envelope precision values (±1 SEM) are plotted for responses to the consonant transition and vowel in quiet and noise.
3.6 What to expect in a typical response
The preceding section quantified response parameters in quiet, and characterized in detail how noise affects these parameters. As discussed previously, a long-term goal is to develop a clinical tool based on these responses to evaluate childhood listening and learning. The question may therefore arise: what is expected in a typical response?
To facilitate fast and easy interpretation of the responses in quiet and noise, the following “guidelines” are presented as a brief reference. Means are reported standard deviations between conditions and time regions in parentheses:
Pre-stimulus response amplitudes are < 0.1 (0.02) μV.
FFRENV SNRs are > 2 (0.5) in quiet and about 1.6 (0.5) in noise; FFRTFS SNRs are about 1.5 (0.4) in quiet and noise.
FFRENV amplitudes in the time and frequency domains are about half as large in noise as in quiet; FFRTFS amplitudes in the time and frequency domains are about equivalent in quiet and noise.
FFRENV in quiet has an inter-trial response stability of about r = 0.6 (0.3), which is about halved in noise; FFRTFS in quiet has a response stability of about r = 0.35 (0.2), which is slightly lower in noise.
Responses are about 0.5 ms (0.7) later in noise; responses to the onset burst and consonant transition are more delayed in noise than responses to the vowel (approximately 0.6 ms [0.9] vs. 0.3 ms [0.6]).
Envelope precision estimates are around r = 0.6 (0.2), and should be highest for the response to the vowel in quiet and lowest for the response to the consonant transition in noise.
Although work is needed to delineate the behavioral sequelae of responses that deviate from these trends in children this age, evidence from older children suggests that one or more response parameters outside of these guidelines should be given serious consideration and may motivate follow-up testing and/or close monitoring.
4. Discussion
Auditory-neurophysiological responses (FFRs) to a CV syllable were compared in quiet and background noise in a cohort of preschoolers (ages 3–5 yr). Across all dimensions, response quality was degraded by noise. In particular, the responses were smaller in the time and frequency domains, less stable on a trial-by-trial basis, slower, and more poorly tracked the stimulus envelope. Most of these degradations were more dramatic in response to the consonant transition than in response to the vowel, suggesting that consonant-in-noise processing is more vulnerable to masking neurophysiologically than vowel-in-noise processing. This poor processing in noise may place a physiological constraint on listening during early childhood, especially for coding consonants. Consequently, the timing- and harmonic- based cues used to understand consonants in English may be less accessible to children when listening in adverse conditions.
These results are consistent with previous neurophysiological studies from older age groups—especially in demonstrating that auditory-neurophysiological response quality is degraded in noise, and by demonstrating that this degradation is exacerbated in response to consonants as opposed to vowels (Anderson et al., 2010; Cunningham et al., 2002). Broadly speaking, these results are evocative of behavioral findings showing that acoustically dynamic speech cues are more difficult to recognize in noise than static cues. We note parallels between the deleterious effects of background noise we document on the FFR and this literature, especially insofar as these were exacerbated for responses to the acoustically-dynamic consonant transition period.
Although there were general trends to these noise effects, there were nuances as well (see Table 1). For example, whereas spectral amplitudes for FFRENV were smaller in noise, they were about equivalent between quiet and noise for FFRTFS. The fact that noise effects are subtly distinct across temporal components supports the contention that these metrics reflect distinct aspects of neural processing—despite coming from a single electrophysiological recording. This pattern of results both illustrates the granularity the speech-evoked FFR offers in terms of evaluating auditory processing and reinforces the idea that a thorough and complete evaluation of response parameters within an individual offers tremendous insight into auditory function.
4.1 Implications for listening in noise during early childhood
Unsurprisingly, neural processing was less robust in noise than in quiet. For the majority of measures considered, this noise degradation was markedly worse in response to the consonant transition relative to the vowel. This suggests that in preschoolers the acoustic processing of dynamic speech components may be more susceptible to noise interference than the processing of static features, at least in terms of midbrain coding. In this respect, the current findings are consistent with perceptual evidence from children and adults that consonants are more difficult to recognize in noise than vowels (Johnson, 2000; Miller and Nicely, 1955), especially stop consonants such as /d/ (Nishi et al., 2010).
Previous studies have shown relationships between the neurophysiological processing of speech in noise and perceptual performance. For example, Cunningham and her colleagues (2001) found that children with learning problems (LPs; ages 10–13 yr) have poorer FFRs to a consonant-vowel (CV) syllable in noise than their typically-developing peers. In particular, the LP children have less robust encoding of spectral features in speech (corresponding to the first formant) and a poorer response fidelity to the stimulus. Interestingly, these children also showed abnormal perceptual discrimination of contrastive speech sounds in noise, poor cortical processing of speech in noise (see also Warrier et al., 2004), and did not benefit from perceptual cue enhancement in noise. Similarly, Anderson and her colleagues (2010) found that children (ages 8–14 yr) who exhibited a more pronounced noise-induced timing shift in response to the consonant transition of the same [da] used here had poorer sentence recognition in noise than their peers. By characterizing typical response-in-noise properties in young children, it is hoped that these results can inform future research into listening-in-noise development (and difficulties) during early childhood.
Although it is thought that neural coding of speech in noise is one element that contributes to perception in noise, there are additional mitigating factors that are important to consider in terms of behavioral performance. For example, cognitive factors such as attention and working memory play a strong role when in listening in noise (Gordon-Salant and Fitzgibbons, 1997; Nahum et al., 2008; Rönnberg et al., 2008). Linguistic experience may influence factors such as informational masking and lexical access of target words (Calandruccio et al., 2014a, 2014b). And despite the demonstrated importance of cognitive and central auditory factors (Anderson et al., 2013b), audiometric acuity is still important, especially developmentally. For example, children with recurrent otitis media with effusion may experience excessive masking (Roberts et al., 2004), and hearing-in-noise difficulties are more pronounced in children with even a mild sensorineural hearing loss (Crandell, 1993). Additional physiological factors, such as the efferent system, should also be considered, especially with respect to listeners who struggle in noise (de Boer et al., 2012; Muchnik et al., 2004) and developmentally (Abdala et al., 1999; Mishra, 2014). A full understanding, then, of speech perception in noise during early childhood—and by extension disorders thereof—will have to account for these peripheral, central, cognitive, and experiential factors (see, for example, Anderson et al., 2013b).
4.2 Considering the nature of the noise
Here, responses in noise were elicited against a six-talker background track. Although the voices may at times be discernible, this track has a strong energetic masking effect on speech processing. This is one case of background noise, and there may be subtle differences in neurophysiological processing that align with perceptual differences as a function of the number of background talkers (Simpson and Cooke, 2005) and in terms of energetic vs. information masking; for example, children reach adult-like performance under energetic masking conditions by about age 6 years (Schneider et al., 1989), but under informational masking conditions they do not reach adult-like performance until age 10 years (Wightman and Kistler, 2005). The linguistic content of the maskers should also be considered (Van Engen and Bradlow, 2007), especially because this is a preschool population, in whom language is forming but not yet crystallized; this may lead to different acoustic and linguistic constraints informational masking places on both speech perception and neurophysiological processing.
It is also important to point out that responses were only elicited at a single SNR. Consonant perception in noise may be more subject to SNR effects than vowel recognition (Cutler et al., 2004). From the standpoint of developing a clinically reliable biological index of auditory function a suprathreshold response at a fixed SNR may provide the best protocol. In terms of understanding the neurophysiology underlying speech-in-noise processing in preschoolers, however, one should keep in mind the potential for different constraints at different SNRs (cf. Li and Jeng, 2011).
4.3 Evaluating neural coding in preschoolers: Clinical potential
Behavioral assessments of sentence recognition in noise can be problematic in this age group, and although there have been advances in measuring word recognition in noise (Garadat and Litovsky, 2007) it remains difficult for children this young. There is a need to identify listening-in-noise difficulties in children and the neurophysiological approach outlined here may provide an opportunity for research into these childhood listening problems (Anderson et al., 2010; Billiet and Bellis, 2011; Cunningham et al., 2001). A long-term goal is that this approach may be clinically useful in the evaluation of listening difficulties. Noteworthy is that this class of evoked potential has a high sensitivity and specificity with respect to both auditory processing disorder and selective language impairment (Rocha-Muniz et al., 2012) and there is good test-retest reliability of these responses in school-age children (Hornickel et al., 2012) and young adults (Song et al., 2011). In preschoolers and school-aged children, we have shown that a composite measure of the neural coding of consonants in noise, integrating peak latency, response stability, and representation of the harmonics, predicts performance on gamut of (pre)literacy achievement tests, both concurrently and longitudinally (White-Schwoch et al., in press). Additionally, we have shown that in school-aged children this measure reliably classifies children into diagnostic groups. The results discussed herein present normative data on these neurophysiological measures in preschoolers.
4.4 Limitations and avenues for future research
Although children who exhibited a risk factor for a learning problem were excluded (see Methods 2.1), some children in this study may eventually receive a diagnosis, and so the assertion that these data represent a “typically-developing” population should be taken cautiously. Retrospective reanalysis of this dataset will be necessary once these children are old enough to have received a diagnosis (or not) to firmly establish the typically developing preschooler auditory-neurophysiological profile.
Using a CV syllable raises a point of concern—the consonant comes first in the stimulus, raising the question of whether order effects within the stimulus contribute to noise effects as opposed to reflecting vulnerability of dynamic speech cues. In a perceptual study, Cutler and her colleagues (2004) compared recognition of CV and VC syllables in noise; although they found an order effect (initial phoneme less intelligible than final) this effect was outweighed by the effect of consonant vs. vowel, with listener’s recognition of consonants worse in noise irrespective of position in a syllable. Moreover, a neurophysiological investigation in an animal model that used a VCV syllable ([ada]) found a pattern of noise degradation in IC essentially identical to the findings reported here (Cunningham et al., 2002). Thus, it is presumed that the current results do in fact reflect consonant vs. vowel processing as opposed to order effects. Finally, it should be noted that the current study only employed a single CV syllable, and although consonants in general are subject to greater masking effects than vowels, these effects may be intensified for a subset of consonants (Miller and Nicely, 1955) and these perceptual confusion patterns may be distinct during early childhood (Nishi et al., 2010).
5. Conclusion
This study demonstrates that background noise degrades the neural processing of speech in preschoolers, and that this degradation is exacerbated in response to consonant transitions relative to vowels. Responses were degraded in terms of magnitude, timing, spectral content, temporal coding of the speech envelope, and with respect to the stability across stimulus trials. An exception to this effect is neural coding of temporal fine structure information, which seems more resilient to noise degradation than the coding of the temporal envelope. This degradation may place a neurophysiological constraint on consonant-in-noise processing and is consistent with evidence that listeners have exceptional difficulty recognizing consonants under adverse listening conditions. Here, this consonant degradation is demonstrated neurophysiologically during early childhood, when listening (and its neural substrates) remains under development.
Our long-term goal is to understand the developmental trajectory of speech-sound processing with respect to listening, learning, and literacy, to elucidate how this trajectory goes awry in children who struggle in the language development process, and to use these insights to design targeted interventions to improve child listening and learning. This study establishes the preschooler profile for auditory-neurophysiological processing in quiet and noise, and demonstrates the feasibility of testing children this age. These children will be followed longitudinally, with the hope of harnessing insights gleaned from these evoked potentials into biological predictors of future listening and literacy competencies. Should this prove viable, these neurophysiological responses may provide an objective and uniform assessment that is meaningful in individual children. An exciting possibility is that pre-school auditory-neurophysiological assessment can expedite and inform early and specific interventions to enhance auditory processing.
Highlights.
Auditory-neurophysiological responses to a CV syllable in quiet and noise in preschoolers
Noise degraded response quality, especially for response to the consonant transition vs. vowel
May be why consonants more difficult to recognize than vowels in adverse listening conditions
May offer an objective index of the physiological constraints on to speech in quiet and noise
Acknowledgments
Thanks to S.G. Zecker for his statistical advice, M. Agouridou and A.B. Fitzroy for comments on an earlier draft of the manuscript, and to members of the Auditory Neuroscience Laboratory for their assistance with data collection. Supported by NIH R01-HD069414 and the Knowles Hearing Center.
Abbreviations
- FFR
frequency-following response
- ABR
auditory brainstem response
- F0
fundamental frequency
- LP
learning problems
- CV
consonant vowel
- M
mean
- SD
standard deviation
- SPL
sound pressure level
- CMS/DRL
common mode sense/driven right leg
- ENV
envelope
- TFS
temporal fine structure
- SNR
signal-to-noise ratio
- RMS
root mean squared
- FFT
fast Fourier transformation
- RMANOVA
repeated measures analysis of variance
- SEM
standard error of the mean
Footnotes
We note that this response has often been referred to by our group as the cABR (auditory brainstem response to complex sounds) or the sABR (auditory brainstem response to speech) to emphasize that the response may reflect the neural coding of acoustic features of behaviorally relevant sounds such as speech.
Author Contributions: All authors contributed to the interpretation of the results and the manuscript. In addition, TW-S, TN, ARB & NK contributed to study design; ECD, ECT & KWC collected and processed the data; TN contributed analytic techniques; TW-S & ECD analyzed the data and prepared the initial draft of the manuscript; and NK provided resources and facilities.
Publisher's Disclaimer: This is a PDF file of an unedited manuscript that has been accepted for publication. As a service to our customers we are providing this early version of the manuscript. The manuscript will undergo copyediting, typesetting, and review of the resulting proof before it is published in its final citable form. Please note that during the production process errors may be discovered which could affect the content, and all legal disclaimers that apply to the journal pertain.
References
- Abdala C, Ma E, Sininger YS. Maturation of medial efferent system function in humans. The Journal of the Acoustical Society of America. 1999;105:2392–2402. doi: 10.1121/1.426844. [DOI] [PubMed] [Google Scholar]
- Anderson S, Parbery-Clark A, White-Schwoch T, Drehobl S, Kraus N. Effects of hearing loss on the subcortical representation of speech cues. J Acoust Soc Am. 2013a;133:3030–3038. doi: 10.1121/1.4799804. [DOI] [PMC free article] [PubMed] [Google Scholar]
- Anderson S, Skoe E, Chandrasekaran B, Kraus N. Neural timing is linked to speech perception in noise. J Neurosci. 2010;30:4922–4926. doi: 10.1523/JNEUROSCI.0107-10.2010. [DOI] [PMC free article] [PubMed] [Google Scholar]
- Anderson S, White-Schwoch T, Parbery-Clark A, Kraus N. A dynamic auditory-cognitive system supports speech-in-noise perception in older adults. Hear Res. 2013b;300:18–32. doi: 10.1016/j.heares.2013.03.006. [DOI] [PMC free article] [PubMed] [Google Scholar]
- Anderson S, White-Schwoch T, Parbery-Clark A, Kraus N. Reversal of age-related neural timing delays with training. Proc Natl Acad Sci U S A. 2013c;110:4357–4362. doi: 10.1073/pnas.1213555110. [DOI] [PMC free article] [PubMed] [Google Scholar]
- Bidelman GM, Krishnan A. Effects of reverberation on brainstem representation of speech in musicians and non-musicians. Brain Res. 2010;1355:112–125. doi: 10.1016/j.brainres.2010.07.100. [DOI] [PMC free article] [PubMed] [Google Scholar]
- Billiet CR, Bellis TJ. The relationship between brainstem temporal processing and performance on tests of central auditory function in children with reading disorders. J Speech Lang Hear Res. 2011;54:228. doi: 10.1044/1092-4388(2010/09-0239). [DOI] [PubMed] [Google Scholar]
- Bradlow AR, Kraus N, Hayes E. Speaking Clearly for Children With Learning DisabilitiesSentence Perception in Noise. J Speech Lang Hear Res. 2003;46:80–97. doi: 10.1044/1092-4388(2003/007). [DOI] [PubMed] [Google Scholar]
- Calandruccio L, Bradlow AR, Dhar S. Speech-on-speech Masking with Variable Access to the Linguistic Content of the Masker Speech for Native and Nonnative English Speakers. J Am Acad Audiol. 2014a;25:355–366. doi: 10.3766/jaaa.25.4.7. [DOI] [PMC free article] [PubMed] [Google Scholar]
- Calandruccio L, Buss E, Hall JW., III Effects of linguistic experience on the ability to benefit from temporal and spectral masker modulation. J Acoust Soc Am. 2014b;135:1335–1343. doi: 10.1121/1.4864785. [DOI] [PMC free article] [PubMed] [Google Scholar]
- Cohen J, Cohen P, West SG, Aiken LS. Applied Multiple Regression/Correlation Analysis for the Behavioral Sciences. 3. Erlbaum; Mahwah, NJ: 2003. [Google Scholar]
- Crandell CC. Speech recognition in noise by children with minimal degrees of sensorineural hearing loss. Ear Hear. 1993;14:210–216. doi: 10.1097/00003446-199306000-00008. [DOI] [PubMed] [Google Scholar]
- Cunningham J, Nicol T, King C, Zecker SG, Kraus N. Effects of noise and cue enhancement on neural responses to speech in auditory midbrain, thalamus and cortex. Hear Res. 2002;169:97–111. doi: 10.1016/s0378-5955(02)00344-1. [DOI] [PubMed] [Google Scholar]
- Cunningham J, Nicol T, Zecker SG, Bradlow A, Kraus N. Neurobiologic responses to speech in noise in children with learning problems: deficits and strategies for improvement. Clin Neurophysiol. 2001;112:758–767. doi: 10.1016/s1388-2457(01)00465-5. [DOI] [PubMed] [Google Scholar]
- Cutler A, Weber A, Smits R, Cooper N. Patterns of English phoneme confusions by native and non-native listeners. J Acoust Soc Am. 2004;116:3668–3678. doi: 10.1121/1.1810292. [DOI] [PubMed] [Google Scholar]
- De Boer J, Thornton ARD, Krumbholz K. What is the role of the medial olivocochlear system in speech-in-noise processing? J Neurophysiol. 2012;107:1301–1312. doi: 10.1152/jn.00222.2011. [DOI] [PMC free article] [PubMed] [Google Scholar]
- Douglass JK, Wilkens L, Pantazelou E, Moss F, et al. Noise enhancement of information transfer in crayfish mechanoreceptors by stochastic resonance. Nature. 1993;365:337–340. doi: 10.1038/365337a0. [DOI] [PubMed] [Google Scholar]
- Fujihira H, Shiraishi K. Correlations between word intelligibility under reverberation and speech auditory brainstem responses in elderly listeners. Clin Neurophysiol. 2014 doi: 10.1016/j.clinph.2014.05.001. [DOI] [PubMed] [Google Scholar]
- Garadat SN, Litovsky RY. Speech intelligibility in free field: Spatial unmasking in preschool children. J Acoust Soc Am. 2007;121:1047–1055. doi: 10.1121/1.2409863. [DOI] [PMC free article] [PubMed] [Google Scholar]
- Gordon-Salant S, Fitzgibbons PJ. Selected cognitive factors and speech recognition performance among young and elderly listeners. J Speech Lang Hear Res. 1997;40:423. doi: 10.1044/jslhr.4002.423. [DOI] [PubMed] [Google Scholar]
- Hall JW, III, Grose JH, Buss E, Dev MB. Spondee recognition in a two-talker masker and a speech-shaped noise masker in adults and children. Ear Hear. 2002;23:159–165. doi: 10.1097/00003446-200204000-00008. [DOI] [PubMed] [Google Scholar]
- Henry KS, Heinz MG. Diminished temporal coding with sensorineural hearing loss emerges in background noise. Nat Neurosci. 2012;15:1362–1364. doi: 10.1038/nn.3216. [DOI] [PMC free article] [PubMed] [Google Scholar]
- Hornickel J, Knowles E, Kraus N. Test-retest consistency of speech-evoked auditory brainstem responses in typically-developing children. Hear Res. 2012;284:52–58. doi: 10.1016/j.heares.2011.12.005. [DOI] [PMC free article] [PubMed] [Google Scholar]
- Johnson CE. Children’s phoneme identification in reverberation and noise. J Speech Lang Hear Res. 2000;43:144–157. doi: 10.1044/jslhr.4301.144. [DOI] [PubMed] [Google Scholar]
- Kraus N, Bradlow AR, Cheatham MA, Cunningham J, King CD, Koch DB, Nicol TG, McGee TJ, Stein L, Wright BA. Consequences of neural asynchrony: a case of auditory neuropathy. J Assoc Res Otolaryngol. 2000;1:33–45. doi: 10.1007/s101620010004. [DOI] [PMC free article] [PubMed] [Google Scholar]
- Kraus N, Nicol T. The cognitive auditory system. In: Fay R, Popper A, editors. Perspectives on Auditory Research, Springer Handbook of Auditory Research. Springer-Verlag; Heidelberg: 2014. pp. 299–319. [Google Scholar]
- Leibold LJ, Buss E. Children’s identification of consonants in a speech-shaped noise or a two-talker masker. J Speech Lang Hear Res. 2013;56:1144–1155. doi: 10.1044/1092-4388(2012/12-0011). [DOI] [PMC free article] [PubMed] [Google Scholar]
- Li X, Jeng F-C. Noise tolerance in human frequency-following responses to voice pitch. The Journal of the Acoustical Society of America. 2011;129:EL21–EL26. doi: 10.1121/1.3528775. [DOI] [PubMed] [Google Scholar]
- Messaoud-Galusi S, Hazan V, Rosen S. Investigating speech perception in children with dyslexia: is there evidence of a consistent deficit in individuals? J Speech Lang Hear Res. 2011;54:1682–1701. doi: 10.1044/1092-4388(2011/09-0261). [DOI] [PMC free article] [PubMed] [Google Scholar]
- Miller GA, Nicely PE. An analysis of perceptual confusions among some English consonants. J Acoust Soc Am. 1955;27:338–352. [Google Scholar]
- Mishra SK. Attentional modulation of medial olivocochlear inhibition: Evidence for immaturity in children. Hearing research. 2014 doi: 10.1016/j.heares.2014.10.009. [DOI] [PubMed] [Google Scholar]
- Morse RP, Evans EF. Enhancement of vowel coding for cochlear implants by addition of noise. Nature medicine. 1996;2:928–932. doi: 10.1038/nm0896-928. [DOI] [PubMed] [Google Scholar]
- Moucha R, Pandya PK, Engineer ND, Rathbun DL, Kilgard MP. Background sounds contribute to spectrotemporal plasticity in primary auditory cortex. Experimental brain research. 2005;162:417–427. doi: 10.1007/s00221-004-2098-4. [DOI] [PMC free article] [PubMed] [Google Scholar]
- Muchnik C, Ari-Even Roth DE, Othman-Jebara R, Putter-Katz H, Shabtai EL, Hildesheimer M. Reduced medial olivocochlear bundle system function in children with auditory processing disorders. Audiol Neurootol. 2004;9:107–114. doi: 10.1159/000076001. [DOI] [PubMed] [Google Scholar]
- Nahum M, Nelken I, Ahissar M. Low-level information and high-level perception: the case of speech in noise. PLoS biology. 2008;6:e126. doi: 10.1371/journal.pbio.0060126. [DOI] [PMC free article] [PubMed] [Google Scholar]
- Nishi K, Lewis DE, Hoover BM, Choi S, Stelmachowicz PG. Children’s recognition of American English consonants in noisea) J Acoust Soc Am. 2010;127:3177–3188. doi: 10.1121/1.3377080. [DOI] [PMC free article] [PubMed] [Google Scholar]
- Roberts J, Hunter L, Gravel J, Rosenfeld R, Berman S, Haggard M, Hall J, Lannon C, Moore D, Vernon-Feagans L, et al. Otitis media, hearing loss, and language learning: controversies and current research. J Dev Behav Pediatr. 2004;25:110–122. doi: 10.1097/00004703-200404000-00007. [DOI] [PubMed] [Google Scholar]
- Rocha-Muniz CN, Befi-Lopes DM, Schochat E. Investigation of auditory processing disorder and language impairment using the speech-evoked auditory brainstem response. Hear Res. 2012;294:143–52. doi: 10.1016/j.heares.2012.08.008. [DOI] [PubMed] [Google Scholar]
- Rönnberg J, Rudner M, Foo C, Lunner T. Cognition counts: A working memory system for ease of language understanding (ELU) Int J Audiol. 2008;47:S99–S105. doi: 10.1080/14992020802301167. [DOI] [PubMed] [Google Scholar]
- Ruggles D, Bharadwaj H, Shinn-Cunningham BG. Why middle-aged listeners have trouble hearing in everyday settings. Curr Biol. 2012 doi: 10.1016/j.cub.2012.05.025. [DOI] [PMC free article] [PubMed] [Google Scholar]
- Schneider BA, Trehub SE, Morrongiello BA, Thorpe LA. Developmental changes in masked thresholds. The Journal of the Acoustical Society of America. 1989;86:1733–1742. doi: 10.1121/1.398604. [DOI] [PubMed] [Google Scholar]
- Shamma S, Lorenzi C. On the balance of envelope and temporal fine structure in the encoding of speech in the early auditory system. J Acoust Soc Am. 2013;133:2818–2833. doi: 10.1121/1.4795783. [DOI] [PMC free article] [PubMed] [Google Scholar]
- Simpson SA, Cooke M. Consonant identification in N-talker babble is a nonmonotonic function of N. J Acoust Soc Am. 2005;118:2775–2778. doi: 10.1121/1.2062650. [DOI] [PubMed] [Google Scholar]
- Song JH, Nicol T, Kraus N. Test–retest reliability of the speech-evoked auditory brainstem response. Clin Neurophysiol. 2011;122:346–355. doi: 10.1016/j.clinph.2010.07.009. [DOI] [PMC free article] [PubMed] [Google Scholar]
- Song JH, Skoe E, Banai K, Kraus N. Training to improve hearing speech in noise: Biological mechanisms. Cereb Cortex. 2012;122:1890–1898. doi: 10.1093/cercor/bhr196. [DOI] [PMC free article] [PubMed] [Google Scholar]
- Souza PE, Boike KT, Witherell K, Tremblay K. Prediction of speech recognition from audibility in older listeners with hearing loss: effects of age, amplification, and background noise. J Am Acad Audiol. 2007;18:54–65. doi: 10.3766/jaaa.18.1.5. [DOI] [PubMed] [Google Scholar]
- Sperling AJ, Lu ZL, Manis FR, Seidenberg MS. Deficits in perceptual noise exclusion in developmental dyslexia. Nat Neurosci. 2005;8:862–863. doi: 10.1038/nn1474. [DOI] [PubMed] [Google Scholar]
- Van Engen KJ, Bradlow AR. Sentence recognition in native-and foreign-language multi-talker background noise. J Acoust Soc Am. 2007;121:519. doi: 10.1121/1.2400666. [DOI] [PMC free article] [PubMed] [Google Scholar]
- Warrier CM, Johnson KL, Hayes EA, Nicol T, Kraus N. Learning impaired children exhibit timing deficits and training-related improvements in auditory cortical responses to speech in noise. Exp Brain Res. 2004;157:431–441. doi: 10.1007/s00221-004-1857-6. [DOI] [PubMed] [Google Scholar]
- White-Schwoch T, Woodruff Carr K, Thompson EC, Anderson S, Nicol T, Bradlow AR, Zecker SG, Kraus N. Auditory processing in noise: A preschool biomarker for literacy. PLOS Biol. doi: 10.1371/journal.pbio.1002196. in press. [DOI] [PMC free article] [PubMed] [Google Scholar]
- Wightman FL, Kistler DJ. Informational masking of speech in children: Effects of ipsilateral and contralateral distracters. J Acoust Soc Am. 2005;118:3164–3176. doi: 10.1121/1.2082567. [DOI] [PMC free article] [PubMed] [Google Scholar]
- Wright BA, Zecker SG. Learning problems, delayed development, and puberty. Proceedings of the National Academy of Sciences of the United States of America. 2004;101:9942–9946. doi: 10.1073/pnas.0401825101. [DOI] [PMC free article] [PubMed] [Google Scholar]
- Zeng FG, Fu QJ, Morse R. Human hearing enhanced by noise. Brain research. 2000;869:251–255. doi: 10.1016/s0006-8993(00)02475-6. [DOI] [PubMed] [Google Scholar]
- Zeng FG, Oba S, Garde S, Sininger Y, Starr A. Temporal and speech processing deficits in auditory neuropathy. Neuroreport. 1999;10:3429–3435. doi: 10.1097/00001756-199911080-00031. [DOI] [PubMed] [Google Scholar]
- Ziegler JC, Pech-Georgel C, George F, Lorenzi C. Speech-perception-in-noise deficits in dyslexia. Dev Sci. 2009;12:732–745. doi: 10.1111/j.1467-7687.2009.00817.x. [DOI] [PubMed] [Google Scholar]