Abstract
Unique mechanical properties of collagen molecule make it one of the most important and abundant proteins in animals. Many tissues such as connective tissues rely on these properties to function properly. In the past decade, molecular dynamics (MD) simulations have been used extensively to study the mechanical behavior of molecules. For collagen, MD simulations were primarily used to determine its elastic properties. In this study, constant force steered MD simulations were used to perform creep tests on collagen molecule segments. The mechanical behavior of the segments, with lengths of approximately 20 (1X), 38 (2X), 74 (4X), and 290 nm (16X), was characterized using a quasi-linear model to describe the observed viscoelastic responses. To investigate the mechanisms of the viscoelastic behavior, hydrogen bonds (H-bonds) rupture/formation time history of the segments were analyzed and it was shown that the formation growth rate of H-bonds in the system is correlated with the creep growth rate of the segment ( β = 2.41 βH). In addition, a linear relationship between H-bonds formation growth rate and the length of the segment was quantified. Based on these findings, a general viscoelastic model was developed and verified where, using the smallest segment as a building block, the viscoelastic properties of larger segments could be predicted. In addition, the effect of temperature control methods on the mechanical properties were studied, and it was shown that application of Langevin Dynamics had adverse effect on these properties while the Lowe-Anderson method was shown to be more appropriate for this application. This study provides information that is essential for multi-scale modeling of collagen fibrils using a bottom-up approach.
Keywords: Collagen, viscoelastic properties, steered molecular dynamics, creep simulations, quasi-linear viscoelastic (QLV) theory, hydrogen bonds
1. Introduction
Development of constitutive models for connective tissues has been a primary focus in biomechanics. The approaches used for this purpose have been mostly phenomenological and consider the tissue as a continuum with macroscopic mechanical models that are often nonlinear, rate dependent and may include directional dependence. Understanding the mechanical characteristics of collagen molecule would provide a basis to investigate the micromechanics of connective tissues. This knowledge, in turn, can be used to study the effect of mutation or disease of collagen on tissue mechanical properties, or to determine initiation of micro-failure due to trauma among other applications. While several microstructural elements may interact within connective tissues, collagen, the main protein in their extracellular matrix (ECM), is believed to largely determine their structural integrity (Silver et al., 2006).
Organization into a complex hierarchical structure is an important factor for the mechanical function of collagen. The first level of collagen structural hierarchy, Tropocollagen is a triple-helix protein with an approximate length of 290 nm and a diameter of about 1.5 nm. This superhelix is comprised of three polypeptide left-handed chains (α chain). The common characteristic of each of these chains is a continuous amino acid motif (Gly – X – Y) repeat, where X and Y are mostly proline and hydroxyproline, but can also be any amino acid. Tropocollagens have a distinctive cross-striation with a periodicity of 67 nm and five of them organize into a micro-fibril. Micro-fibrils wind together to form a fibril (Shoulders and Raines, 2009).
In addition to experimental studies that report elastic (Sasaki and Odajima, 1996; Shen et al., 2011, 2008; Svensson et al., 2010a; van der Rijt et al., 2006; Wenger et al., 2007) and viscoelastic properties (Sun et al., 2002; Svensson et al., 2010b) of collagen at the fibrillar scale, computational models at the molecular scale have recently become possible by the improvements in computational methods and resources. In several studies, the elastic properties of collagen molecule have been characterized using molecular dynamics (MD) simulations (Bhowmik et al., 2009; M. Buehler, 2006; Buehler, 2008; M. J. Buehler, 2006; Gautieri et al., 2010, 2008; Pradhan et al., 2011). The shear interaction between collagen molecules in a model microfibril (Gautieri et al., 2012a) and the intermolecular slip mechanism between two collagen molecule (Gautieri et al., 2009) were also investigated using MD simulations. The viscoelastic behavior of collagen was primarily studied in a series of papers by Gautieri et al. (Gautieri et al., 2013, 2012b; Vesentini et al., 2013) in which fully solvated (wet) and dry collagen segments with length of 20 nm were examined using constant force steered molecular dynamics (SMD) simulations. The results were fitted using a linear Kelvin-Voigt (KV) viscoelastic model. It was further shown that the higher number of intramolecular H-bonds in the dry segment resulted in a higher Young's modulus in comparison with the wet segment. The H-bonds that the solvated collagen molecule formed with the surrounding water molecules were found to be the underlying mechanism for the viscous behavior.
This study is a first step in our bottom-up approach for characterizing the constitutive behavior of collagen fibrils. Since the mechanical behavior of collagenous tissues is generally nonlinear viscoelastic (Fung, 1993), the main objective of this study was to test the hypothesis that this nonlinear behavior starts at the molecular scale. A series of SMD creep tests were performed to characterize nonlinear viscoelastic constitutive models of collagen homotrimer molecule segments with different lengths. It was also hypothesized that a quantitative relationship can be established between the trends of H-bonds rupture/formation and the creep growth rates for different lengths of the molecule. This relationship would allow us to predict the growth rate of larger molecule segments from the ones of smaller segments.
2. Materials and methods
2.1. Overview
We hypothesized that the quasi-linear viscoelastic (QLV) theory that has been extensively used to model collagenous tissues (Fung, 1993) could model the viscoelastic behavior of collagen molecule. Creep SMD simulations were performed on segments of collagen with different lengths, and strain responses were used to characterize the viscoelastic properties. The optimized viscoelastic model parameters are expressed as mean ± 95% confidence interval and the coefficient of determination R2 is used as a measure of the goodness of fit.
2.2. Collagen molecule generation and SMD preparation
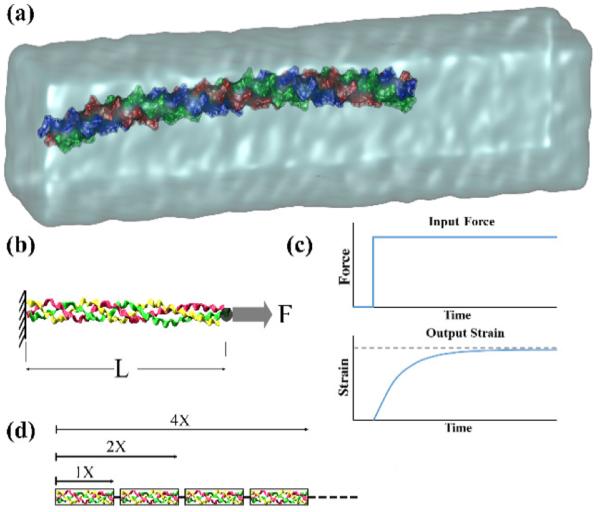
Considering the abundance of proline (Pro – P) and hydroxyproline (Hyp –O) as the X and Y amino acids in the tropocollagen structure (Ramshaw et al., 1998), they were chosen to construct the collagen model. The molecule structure [Gly-Pro-Hyp or GPO] was built using the triple helical building script (The BuSCr) developed by Rainey et al. (Rainey and Goh, 2004, 2002). The total length of the molecule, due to its symmetry, was divided into segments with different number of GPO building blocks. Following the approach of Gautieri et al. (2012b), the fundamental segment was chosen with 21 building blocks or (GPO)21 and was named 1X (Fig. 1a). The larger segments that were studied had 41, 85, and 338 building blocks (named 2X, 4X, and 16X respectively). A summary of these segments and their characteristics is provided in Table 1.
Fig. 1.
Schematic of collagen molecule creep test. (a) Equilibrated 1X segment solvated in water box. (b) A constant force is applied to one end of the molecule while the other end is fixed. (c) The applied force on the molecule is the input and measured increase of strain over time is the output of the system. (d) Representation of larger segments of collagen molecule constructed from a series of 1X segments as the building block.
Table 1.
Summary Collagen Segments Characteristics
| Name | Structure | Atoms | Initial length of segment (nm) | Equilibrated length of segment (nm) | Water box size (nm) |
|---|---|---|---|---|---|
| 1X | (GPO)21a | 75000 | 19.4 | 17.24 | 25 × 7 × 7 |
| 2X | (GPO)41 | 210000 | 37.6 | 35.98 | 51 × 7 × 7 |
| 4X | (GPO)85 | 455000 | 74.2 | 70.66 | 108 × 7 × 7 |
| 16X | (GPO)338 | 1267000 | 289.3 | 257.68 | 350 × 7 × 7 |
denotes glycine-proline-hydroxyproline (GPO)
The MD simulations were performed using NAMD 2.8 (Phillips et al., 2005), with CHARMM force field (MacKerell A. D. et al., 1998). The lack of hydroxyproline amino acid parameters in the CHARMM force field was resolved by manually adding its parameter to the force field using the procedure suggested by Anderson (Anderson, 2006). The segments were solvated using TIP3P water molecule boxes, and potassium chloride (KCl) ions with the concentration of 0.5 mol/L were added to the system using Visual Molecular Dynamics (VMD) (Humphrey et al., 1996). Periodic boundary conditions were applied at all ends of the box to effectively surround it with similar systems. An integration time step of 1 fs, which is typically used for simulations involving vibrating water molecules, was selected. Initial energy minimization was carried out for 50000 steps using the conjugate gradient method. In the next step, the system was equilibrated at the temperature of 310 K (body temperature) and pressure of 1 atm for 20 ns. This equilibration time was verified to be sufficient by monitoring the stabilization of the root mean square deviation (RMSD) of the alpha-carbons (Cα atoms). The solvated collagen molecule segments were used to carry out the creep simulations, and the snapshots were rendered by POV-Ray software package (“Persistence of Vision Raytracer,” 2004).
2.3. System temperature control algorithm
Since the viscoelastic behavior and temperature are closely related, it was necessary to keep the system temperature constant (isothermal deformation), so the constitutive model would depend only on the force and displacement measures. Several thermostat algorithms are available to keep the temperature constant in MD simulations by coupling the system to an external heat bath. Most of the studies in this field have used Langevin dynamics (Gautieri et al., 2012b; Ghodsi and Kazemi, 2011; Pradhan et al., 2011, 2012). In this method, additional damping and random forces are introduced to control the kinetic energy of the system (Kubo et al., 1991). In the creep tests, since obtaining the viscosity and mechanical properties are the main objective, the recently implemented Lowe-Anderson thermostat that does not add viscosity to the system was used (Koopman and Lowe, 2006). This method is a variation of Anderson dynamics (Andersen, 1980) in which each atom at each integration time is subjected to a small probability of experiencing a collision with the heat bath. Therefore, there is a small probability that the velocity of each atom is reassigned during the integration. This method reassigns the velocity of pairs of particles located only within a particular distance. New velocities are imposed in a way that the angular and linear momentums are conserved. As a result, this thermostat is Galilean invariant and advantageous for non-equilibrium MD simulations (Soddemann et al., 2003). Langevin and Lowe-Anderson thermostats and also applying no temperature control were compared in representative creep simulations to demonstrate that the Lowe-Anderson thermostat was more appropriate for this study.
2.4. In silico creep tests and modeling
The creep test is one of the common ways to characterize the viscoelastic behavior of materials in which the time-dependent displacement or strain resulting from an instantaneously applied constant force to one end of the sample is measured while the other end is kept fixed (Fig. 1b). The NAMD package allows application of constant forces on atoms. To implement the creep boundary conditions on the collagen molecule segments, the three Cα atoms of the N-terminal were fixed, and a constant force was directly applied to the center point of the three Cα atoms of the C-terminal. Force levels of 500, 1000, 2000, and 4000 pN were used on the four segments to generate strains from about 1% to 40%. A hydrogen bond cut-off distance of 3.5 Å and a cut-off angle of 60° were employed to extract the number of H-bonds during loading of the molecule (Ghodsi and Kazemi, 2011).
The engineering strain (change of length divided by the equilibrated length L) versus time curves for different levels of applied force were determined from SMD simulations and the creep behavior of the segments (strain vs. applied force) was modeled using the QLV theory (Fig. 1c). In this theory, the strain response is separated into two functions, i.e., a steady-state strain function of the applied force and a reduced (normalized) creep function of time. Based on the model results, an exponential form was assumed for the steady-state strain function using the following equation:
| (1) |
in which A1 and A2 are model parameters to be determined from simulations. A physical explanation for this curve was studied by considering the unwinding of the molecule and the number of steady-state H-bonds at different force levels. The reduced creep function was assumed to be a simple exponential function, written as:
| (2) |
in which β is creep growth rate that depends on the molecule length L. The creep time constant would be τ = 1/β. The overall creep response can be written as:
| (3) |
The creep behavior of different segments were determined directly from SMD simulations and also from adding the response of 1X building blocks in series (Fig. 1d) and the results of the two methods were compared. From the change in the total number of H-bonds (protein-protein and protein-solvent) against time, the H-bond growth rates (βH) were determined for different segments using a simple exponential function similar to Eq. 2 and subsequently a correlation was established between β(L) and βH(L).
3. Results
3.1. Analysis of the steady-state response
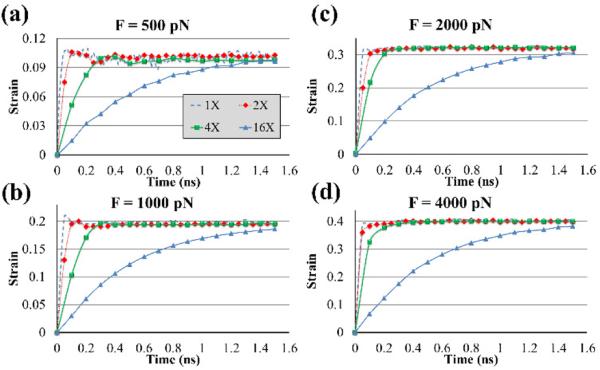
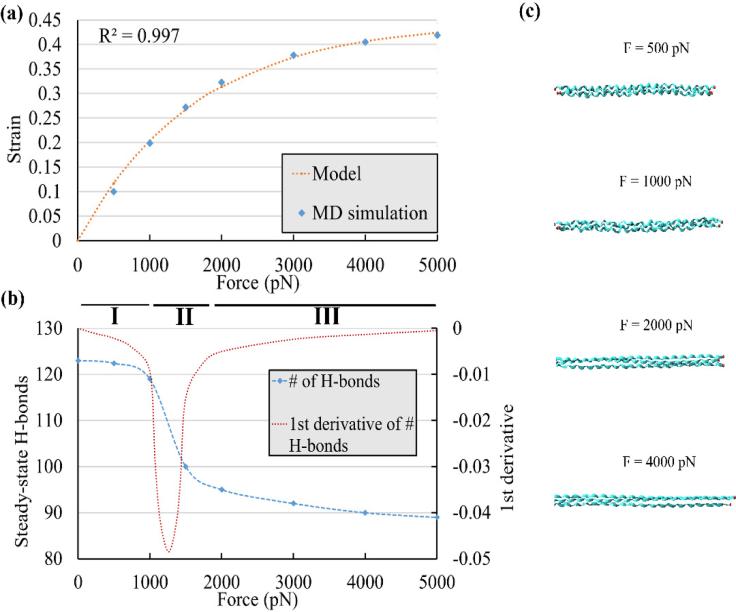
The strains of the segments for the four force levels are shown in the Fig. 2. As expected, the steady-state strain was independent of the length and the growth rate decreased for longer segments. Based on these curves and additional simulations with applied forces of 1500, 3000, and 5000 on the 1X segment, the steady-state strain versus force function was plotted (Fig. 3a) which clearly showed a nonlinear trend. The coefficients of Eq. 1 were determined as A1 = 0.4456 ± 0.024, A2 = (6.094 ± 0.816) × 10−4 pN−1 with R2 = 0.997. To further elucidate this nonlinear behavior, the number of H-bonds in the 1X segment at the steady-state strain was drawn versus the applied force (Fig. 3b). Three main regions were detected on this graph. The first region (Region I) was for forces less than about 1000 pN in which the amount of H-bonds decreased slowly as the force increased. It was found that in this region, the segment became straight from its initial curved shape and only a small portion of the triple-helix structure unwound. As the force increased from 1000 pN to about 2000 pN (Region II) the number of H-bonds decreased significantly as most of the unwinding of the triple-helix structure occurred in this region (Fig 3c). At the end of Region II, the segment became almost a molecule with three straight and untwisted polypeptide chains. As the force passed 2000 pN (Region III), again the number of H-bonds reduced slightly. In this region, individual polypeptide chains covalent bonds deformed and, as a result, only small changes in strain occurred. To differentiate these regions further, the first derivative of the steady-state H-bonds curve was calculated with respect to force (Fig 3b) and the highest decrease in Region II was determined at the minimum of the first derivative curve at about 1250 pN.
Fig. 2.
Creep responses of 1X, 2X, 4X, and 16 X collagen segments under the applied force of (a) 500, (b) 1000, (c) 2000, and (d) 4000 pN.
Fig. 3.
Steady-state creep response. (a) The results from SMD simulations clearly showed a nonlinear trend and showed good agreement with the model given in Eq. 1. (b) The number of intramolecular H-bonds at the steady-state strain against the applied force and its first derivative. Three regions (I, II, and III) were distinguished that had significant changes in the decrease of H-bonds. (c) Snapshots of the 1X segment at the steady-state strain for different forces. The molecule became straight in Region I, the triple-helix started to unwind in Region II, and the polypeptide chains started to stretch in Region III.
3.2. Viscoelastic modeling
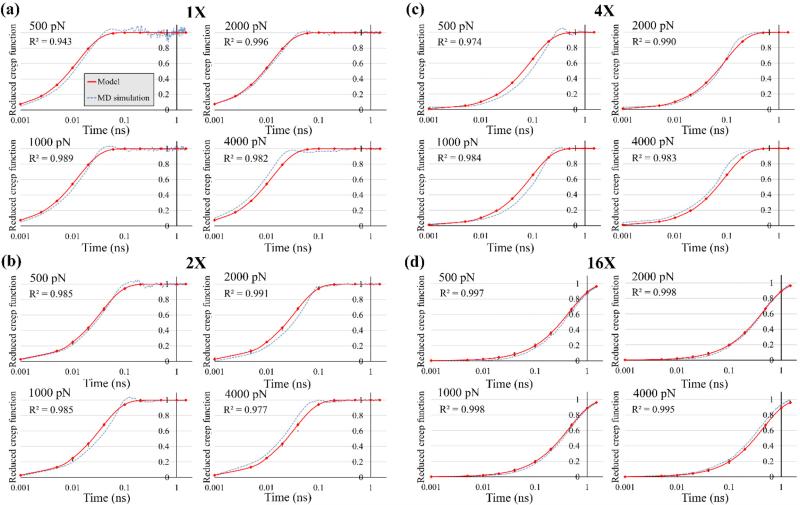
Reduced creep functions for different segments were determined by minimizing the least square error for the four force levels simultaneously using Microsoft Excel Solver (Fig. 4). As can be seen, the creep responses could be satisfactorily described (R2 > 0.974) using a single β (Eq. 2). The values of β and the corresponding τ are summarized in Table 2. Since in previous studies, linear elastic and linear viscoelastic models were used to describe the mechanical behavior of collagen molecule (M. Buehler, 2006; Cusack and Miller, 1979; Gautieri et al., 2012b; Harley et al., 1977; Sasaki and Odajima, 1996; Sun et al., 2002), for the nonlinear model developed in this study, a tangent Young's modulus E (instantaneous slope of the stress-strain curve) and a corresponding instantaneous viscosity μ = E/β were calculated for the sake of comparison. The force level of 1500 pN in Region II, in which the molecule deformation mechanism is mainly determined by H-bonds rupture/formation, was selected for this comparison. The molecule average cross-sectional diameter for these calculations was determined to be 1.5 nm by direct measurement in the model. The tangent modulus was evaluated as E = 4.750 ± 0.045 GPa and the values of μ are given in Table 2.
Fig. 4.
Reduced creep functions fitted to the SMD creep responses. Note that, the time axes are drawn in the logarithmic scale.
Table 2.
Viscoelastic creep parameters: growth rate β, time constant τ, and instantaneous viscosity μ.
| QLV model | Linear model | ||
|---|---|---|---|
| Segment | β (ns−1) | τ (ns) | μ (Pa.s) |
| 1X | 76.41 | 0.0131 | 0.0622 ± 0.0005 |
| 2X | 32.13 | 0.0311 | 0.1478 ± 0.0014 |
| 4X | 13.39 | 0.0747 | 0.3547 ± 0.0034 |
| 16X | 2.87 | 0.3484 | 1.6551 ± 0.0158 |
3.3. Relationship between creep and H-bonds growth rates
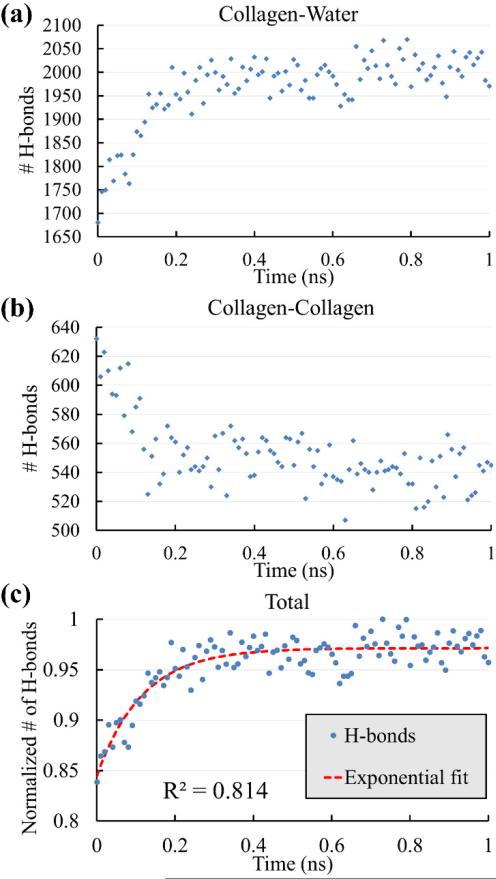
Representative time histories of protein-solvent and intramolecular H-bonds for the 4X segment pulled by 2000 pN force are shown in Figs. 5a and 5b. The collagen-solvent H-bonds increased as the molecule was stretched while the intramolecular H-bonds decreased. As the triple-helix unwound, some of the intramolecular H-bonds had to break to make this possible while on the other hand, there was more surface area for water molecules to form new H-bonds with the collagen molecule and this resulted in an increase in the number of collagen-solvent H-bonds. The overall effect was a net increase in the number of H-bonds (Fig. 5c) and it was observed that the normalized H-bonds net formation curves behaved similarly to the reduced creep functions. The results of βH for different segments and lengths are summarized in Table 3.
Fig. 5.
Representative time histories of the number of H-bonds in creep simulations extracted from the 4X segment under 2000 pN force. (a) Collagen-solvent H-bonds. (b) Intramolecular H-bonds. (c) The normalized number of total H-bonds in the system. A net formation of H-bonds can be seen as a result of the applied force.
Table 3.
H-bonds growth rates βH (ns–1) for different force levels.
| Segment | 500 pN | 1000 pN | 2000 pN | 4000 pN | Mean ± SD |
|---|---|---|---|---|---|
| IX | 29.1 | 31.2 | 33.2 | 35.1 | 32.2 ± 2.23 |
| 2X | 9.9 | 11.5 | 12.9 | 14.8 | 12.3 ± 1.80 |
| 4X | 4.8 | 4.9 | 5.2 | 6.9 | 5.50 ± 0.85 |
| 16X | 1.1 | 1.2 | 1.4 | 1.5 | 1.30 ± 0.16 |
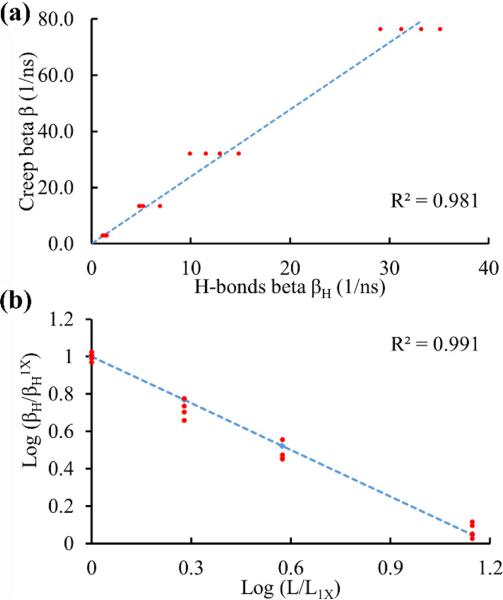
A strong linear relationship was found between the creep and H-bonds growth rates (Fig. 6a):
| (4) |
Additionally, a strong linear relationship was found between the normalized H-bonds growth rate and the normalized length of the segments in the log scale (Fig. 6b):
| (5) |
in which βH1X and L1X are the 1X segment H-bonds growth rate and length, respectively. Eqs. 4 and 5 relate viscoelastic mechanical properties of collagen to its chemical and physical properties. Based on these equations, for a given L the values of βH and β can be estimated. The estimated values of β were compared with the values measured from SMD simulations, and their ratio was found to be 1.01±0.07, which confirmed the applicability of the above relationships.
Fig. 6.
Relationships between mechanical, chemical, and physical properties of collagen. (a) Creep growth rate versus H-bonds formation growth rate. (b) The log of normalized H-bonds growth rate versus the log of normalized molecule length.
4. Discussion
In this study, we reported findings from a series of SMD creep simulations on different collagen molecule segments. The simulations revealed that applying a constant force, resulted in an exponentially increasing strain until an asymptotic value was reached. It was demonstrated that the quasi-linear viscoelastic (QLV) theory could describe the creep responses. Therefore, the collagen creep response was decoupled into a nonlinear strain versus force elastic response and a time-dependent reduced creep function. This is an improvement to previous studies where only linear elastic (Pradhan et al., 2011) or linear viscoelastic (Gautieri et al., 2012b) models were implemented. The tangent elastic modulus E at the force level of 1500 pN is comparable with the values obtained in different experimental and computational studies for the Young's modulus as summarized in Table 4. As it was mentioned earlier, the value reported for this study is the steady-state tangent modulus in a region where the mechanical behavior is primarily determined by the H-bonds rupture/formation and therefore we believe it is a good representative of the viscoelastic creep properties. As can be seen, the order of magnitude of our result is the same as most of the previous experimental results which validate the applicability of the idealized molecule structure used in this study. The differences in the numbers can be partly attributed to the fact that the mechanical behavior of collagen is nonlinear and rate dependent. As a result, depending on the range and rate of loading, slightly different values could be obtained.
Table 4.
Comparison of the Young's modulus of collagen molecule
| Approach | Young's modulus (GPa) |
|---|---|
| Estimated from persistence length (Hofmann et al., 1984) | 3 – 5.1 |
| Brillouin light scattering (Harley et al., 1977) | 9.0 |
| Brillouin light scattering (Cusack and Miller, 1979) | 5.1 |
| Optical trap (Sun et al., 2002) | 0.35 – 12 |
| Atomistic simulation (Gautieri et al., 2012b) | 5.4 |
| Atomistic simulation (Pradhan et al., 2011) | 4 - 14 |
| Present work | 4.75 ± 0.045 |
In order to verify the QLV assumption, it was verified that the reduced creep function was independent of the applied force. For this purpose, a separate creep function was fitted to each force level. Although it was observed that the creep growth rate slightly increased at higher force levels, but since this increase was less than 5%, it was concluded that the QLV assumption is acceptable. This assumption greatly simplifies the viscoelastic modeling in terms of computational cost as compared to a fully nonlinear model (Darvish and Crandall, 2015). The higher force levels applied in this study (above 4000 pN) are higher than the forces measured in experiments (Cusack and Miller, 1979; Shen et al., 2011; Sun et al., 2002) that are up to about 1600 pN. While breaking of covalent bonds was not considered in this study, a computational study (Buehler, 2006) proposes 50% strain for the onset of rupture of covalent bonds in collagen. Since in our simulations, strains were below 40%, it was concluded that it was acceptable to ignore the covalent bonds rupture.
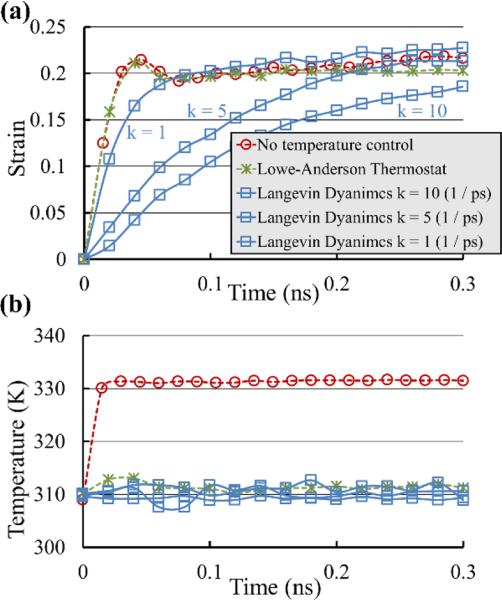
As shown in Table 2, the values of μ were in the range of 0.062 ± 0.001 (for 16X) to 1.66 ± 0.016 (1X) Pa.s. The value for 1X is less than half of the only corresponding value reported in the literature (3.84 ± 0.38 Pa.s) that is also based on SMD creep simulations of a 1X segment (Gautieri et al., 2012b). This difference can be attributed to the temperature control used in the simulations. In this study, the Lowe-Anderson thermostat was used in contrast to the Langevin dynamics that was used in Gautieri et al. We further investigated the effect of different thermostat algorithms on the viscoelastic properties using a series of SMD creep simulations with no temperature control and with Langevin dynamics with different damping coefficient (k = 1, 5, 10 ps−1) on the 1X segment with 1000 pN applied force (the damping coefficient used in Gautieri et al. was evaluated to be approximately 10 ps−1). The results were then compared with the result obtained using the Lowe-Anderson thermostat. The creep responses and changes in temperature are depicted in the Figs. 7a and 7b respectively. It can be seen that with no temperature control, the temperature rose by approximately 20 K while all temperature control algorithms kept the temperature approximately constant at 310 K. However, in terms of the creep response, the results with no temperature control and Lowe-Anderson thermostat were almost the same while the results with Langevin dynamics were notably more viscous. Even when the damping coefficient was reduced to 1 ps−1, the creep growth rate was still lower with Langevin dynamics. We, therefore, concluded that the results obtained using Lowe-Anderson thermostat were more suitable for determination of the viscosity of the molecule.
Fig. 7.
The effect of temperature control in SMD creep simulations of 1X segment with 1000 pN force. The Langevin dynamics with different damping coefficients is compared with the Lowe-Anderson thermostat and no temperature control. (a) The creep response using Lowe-Anderson thermostat is almost the same as when the temperature control is disabled. On the contrary, using Langevin dynamics adds significant viscosity to the system. (b) Temperature control ability is the same for all the thermostats and the temperature is kept approximately at 310K.
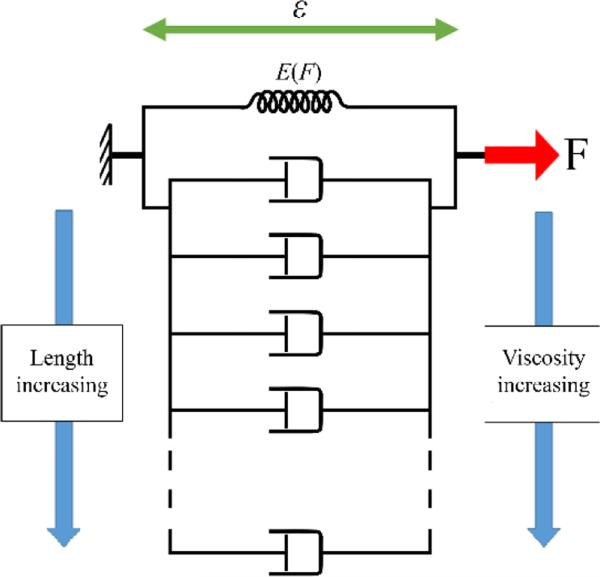
While the QLV model does not have an exact discrete representation, an approximate discrete model, as shown in Fig. 8, is helpful to better demonstrate the mechanism of deformation of the segments. The 1X segment can be considered as a Voigt model with a spring (with instantaneous stiffness E(F)) in parallel with a dashpot. In the actual QLV model, the dashpot coefficient is variable so that the growth rate stays constant. As the length of the segment is increased, the effective viscosity is also increased, which is represented by additional dashpots in parallel with the original Voigt model. The additional viscosity is a result of the net formation (increase in the number) of H-bonds. Nevertheless, the steady-state creep strain of the model is independent of the number of dashpots (length of the molecule).
Fig. 8.
Schematic of discrete representation of viscoelastic model of collagen segments. A single spring represents the steady-state elastic behavior and is in parallel with several dashpots depending on the length of the segment. As the length of the segment is increased, more dashpots are added to account for the observed increased viscosity.
The presented methodology could be particularly applicable in studying the effect mutated motifs in small segments and predict their effects on the mechanical behavior of the whole collagen molecule. Due to the high occurrence of amino acid motif of (Gly-Pro-Hyp or GPH) (Miles et al., 2002), the (GPH) motif was used as the only amino acids triplet in this study for simplification. The physiological collagen molecules are clearly not constructed by ideal triple-helix chains, and their mechanical properties could be different from what we found in this study as it has been shown previously (Uzel and Buehler, 2009). It was however, verified that the Young's modulus determined from the idealized molecule was in the same order of magnitude of reported experimental results. Future work could address this limitation by applying the same methodology to a wider range of amino acid motifs. The length of the 1X segment may need to be adjusted based on the type of the motif considered.
We emphasize the significance of Eq. 4, which is a relationship between two essentially different quantities. The creep growth rate (β) describes the deformation of the molecule whereas the H-bonds growth rate (βH) describes the rate at which H-bonds are formed. Therefore, a quantity that is of chemical nature is related to a quantity that is of mechanical nature. As more H-bonds are formed, they slow down the deformation and, therefore, a creep behavior is observed. The form of this cross-disciplinary relationship is expected to be dependent on the geometry of the molecule and the chemical composition of the molecule and the solvent. Other quantitative models of H-bonds rupture/formation mechanism, e.g, Bell's model (Bell, 1978), also confirm that the rupture of H-bonds in the mechanics of protein materials is a time-dependent phenomenon (Buehler and Ackbarow, 2007).In this study, a linear relationship was determined, which showed that the mechanical growth rate was almost twice of the chemical growth rate. The linear dependence of these two quantities could mean that for collagen molecule, the H-bonds rupture/formation is the primary mechanism of the viscoelastic behavior.
Since the time-scale of MD simulations are generally limited to only a few hundred nanoseconds due to prohibitive computational cost, it is difficult to compare the time-dependent part of the simulation to experimental results that are obtained in a few milliseconds to even a few seconds due to limitations in experimental techniques (e.g., Bozec and Horton, 2005; Gautieri et al., 2013). We demonstrated however that the steady-state responses of the creep simulations were in agreement with experimental results. We also quantified the decrease in creep growth rate as the size of the molecule was increased. The lumped constitutive model developed in this study is a first step in developing constitutive models of collagen fibrils and fibers that are based on MD simulations and the same time are computationally efficient and are at time scales that can be validated against experimental data.
5. Conclusions
The creep response of 20 nm collagen segment (1X) and larger segments with 2X, 4X, and 16X in size were studied. Utilizing the H-bonds rupture/formation mechanisms and a correlation between the net formation of H-bonds and creep behavior, a QLV model for collagen segment with different lengths was developed. The growth rates, calculated from this model, were verified by those obtained directly from SMD simulations. Overall, it was shown that the growth rate in H-bonds net formation has a linear relationship with the creep growth rate. In addition, it was found that H-bonds formation growth rate could be quantified based on the length of the segment.
Different thermostats were compared, and it was concluded that utilizing Langevin dynamics in studies focused on determining the mechanical properties, could affect the creep response, and result in high viscosities. On the contrary, Lowe-Anderson thermostat did not affect the mechanical behavior of the creep response.
Future studies, using the described model, could investigate the dependence of the collagen molecule mechanical properties on the amino acid sequence. The results reported in this article constitute a first step of a multi-scale approach for developing a constitutive model for collagen fibril based on its fundamental building blocks.
Highlights.
Steered molecular dynamics (SMD) simulations were performed on collagen segments.
A QLV viscoelastic model was used to model the creep behavior.
Hydrogen bonds rupture/formation mechanisms of the systems were investigated.
Based on the hydrogen bonds mechanisms a constitutive model for creep was developed.
Different temperature control algorithms in SMD simulations were investigated.
6. Acknowledgements
The MD computation of this research was supported in part by the National Science Foundation through major research instrumentation grant number CNS-09-58854. This work was partially supported by the Temple University Graduate Fellowship (HG) and NIH under Grant Number K25 HL086512-05 (KD).
Footnotes
Publisher's Disclaimer: This is a PDF file of an unedited manuscript that has been accepted for publication. As a service to our customers we are providing this early version of the manuscript. The manuscript will undergo copyediting, typesetting, and review of the resulting proof before it is published in its final citable form. Please note that during the production process errors may be discovered which could affect the content, and all legal disclaimers that apply to the journal pertain.
References
- Andersen HC. Molecular dynamics simulations at constant pressure and/or temperature. J. Chem. Phys. 1980;72:2384. doi:10.1063/1.439486. [Google Scholar]
- Anderson D. Collagen self-assembly: A complementary experimental and theoretical perspective. University of Toronto; 2006. [Google Scholar]
- Bell GI. Models for the specific adhesion of cells to cells. Science (80-. ) 1978;200:618–627. doi: 10.1126/science.347575. [DOI] [PubMed] [Google Scholar]
- Bhowmik R, Katti KS, Katti DR. Mechanisms of Load-Deformation Behavior of Molecular Collagen in Hydroxyapatite-Tropocollagen Molecular System: Steered Molecular Dynamics Study. J. Eng. Mech. 2009;135:413–421. doi:10.1061/(ASCE)0733-9399(2009)135:5(413) [Google Scholar]
- Bozec L, Horton M. Topography and Mechanical Properties of Single Molecules of Type I Collagen Using Atomic Force Microscopy. Biophys. J. 2005;88:4223–4231. doi: 10.1529/biophysj.104.055228. doi: http://dx.doi.org/10.1529/biophysj.104.055228. [DOI] [PMC free article] [PubMed] [Google Scholar]
- Buehler M. Atomistic and continuum modeling of mechanical properties of collagen: elasticity, fracture, and self-assembly. J. Mater. Res. 2006;21:1947–1961. doi:10.1557/JMR.2006.0236. [Google Scholar]
- Buehler MJ. Nanomechanics of collagen fibrils under varying cross-link densities: atomistic and continuum studies. J. Mech. Behav. Biomed. Mater. 2008;1:59–67. doi: 10.1016/j.jmbbm.2007.04.001. doi:10.1016/j.jmbbm.2007.04.001. [DOI] [PubMed] [Google Scholar]
- Buehler MJ. Nature designs tough collagen: explaining the nanostructure of collagen fibrils. Proc. Natl. Acad. Sci. 2006;103:12285–90. doi: 10.1073/pnas.0603216103. doi:10.1073/pnas.0603216103. [DOI] [PMC free article] [PubMed] [Google Scholar]
- Buehler MJ, Ackbarow T. Fracture mechanics of protein materials. Mater. Today. 2007;10:46–58. doi: http://dx.doi.org/10.1016/S1369-7021(07)70208-0. [Google Scholar]
- Cusack S, Miller A. Determination of the elastic constants of collagen by Brillouin light scattering. J. Mol. Biol. 1979;135:39–51. doi: 10.1016/0022-2836(79)90339-5. [DOI] [PubMed] [Google Scholar]
- Darvish KK, Crandall JR. Nonlinear viscoelastic effects in oscillatory shear deformation of brain tissue. Med. Eng. Phys. 2015;23:633–645. doi: 10.1016/s1350-4533(01)00101-1. doi:10.1016/S1350-4533(01)00101-1. [DOI] [PubMed] [Google Scholar]
- Fung YC. Biomechanics: Mechanical Properties of Living Tissues. Springer-Verlag; New York: 1993. [Google Scholar]
- Gautieri A, Pate MI, Vesentini S, Redaelli A, Buehler MJ. Hydration and distance dependence of intermolecular shearing between collagen molecules in a model microfibril. J. Biomech. 2012a;45:2079–83. doi: 10.1016/j.jbiomech.2012.05.047. doi:10.1016/j.jbiomech.2012.05.047. [DOI] [PubMed] [Google Scholar]
- Gautieri A, Russo A, Vesentini S, Redaelli A, Buehler MJ. Coarse-grained model of collagen molecules using an extended MARTINI force field. J. Chem. Theory Comput. 2010;6:1210–1218. doi:10.1021/ct100015v. [Google Scholar]
- Gautieri A, Vesentini S, Montevecchi FM, Redaelli A. Mechanical properties of physiological and pathological models of collagen peptides investigated via steered molecular dynamics simulations. J. Biomech. 2008;41:3073–7. doi: 10.1016/j.jbiomech.2008.06.028. doi:10.1016/j.jbiomech.2008.06.028. [DOI] [PubMed] [Google Scholar]
- Gautieri A, Vesentini S, Redaelli A, Ballarini R. Modeling and measuring visco-elastic properties: From collagen molecules to collagen fibrils. Int. J. Non. Linear. Mech. 2013;56:25–33. doi:10.1016/j.ijnonlinmec.2013.03.012. [Google Scholar]
- Gautieri A, Vesentini S, Redaelli A, Buehler MJ. Viscoelastic properties of model segments of collagen molecules. Matrix Biol. 2012b;31:141–9. doi: 10.1016/j.matbio.2011.11.005. doi:10.1016/j.matbio.2011.11.005. [DOI] [PubMed] [Google Scholar]
- Gautieri A, Vesentini S, Redaelli A, Buehler MJ. Intermolecular slip mechanism in tropocollagen nanofibrils. Int. J. Mater. Res. 2009;100:921–925. doi:10.3139/146.110132. [Google Scholar]
- Ghodsi H, Kazemi MT. Elastic Properties of Actin Assemblies in Different States of Nucleotide Binding. Cell. Mol. Bioeng. 2011;5:1–13. doi:10.1007/s12195-011-0181-z. [Google Scholar]
- Harley R, James D, Miller A, White J. Phonons and the elastic moduli of collagen and muscle. Nature. 1977;267:285. doi: 10.1038/267285a0. [DOI] [PubMed] [Google Scholar]
- Hofmann H, Voss T, Kühn K, Engel J. Localization of flexible sites in thread-like molecules from electron micrographs. J Mol Biol. 1984;172:325–343. doi: 10.1016/s0022-2836(84)80029-7. doi:10.1016/S0022-2836(84)80029-7. [DOI] [PubMed] [Google Scholar]
- Humphrey W, Dalke A, Schulten K. VMD: visual molecular dynamics. J. Mol. Graph. 1996;14:33–8. 27–8. doi: 10.1016/0263-7855(96)00018-5. [DOI] [PubMed] [Google Scholar]
- Koopman EA, Lowe CP. Advantages of a Lowe-Andersen thermostat in molecular dynamics simulations. J. Chem. Phys. 2006;124:204103. doi: 10.1063/1.2198824. doi:10.1063/1.2198824. [DOI] [PubMed] [Google Scholar]
- Kubo R, Toda M, Hashitsume N. Statistical Physics II. 2nd ed. Springer; New York: 1991. [Google Scholar]
- MacKerell AD, Bashford D, Bellott, Dunbrack RL, Evanseck JD, Field MJ, Fischer S, Gao J, Guo H, Ha S, Joseph-McCarthy D, Kuchnir L, Kuczera K, Lau FTK, Mattos C, Michnick S, Ngo T, Nguyen DT, Prodhom B, Reiher WE, Roux B, Schlenkrich M, Smith JC, Stote R, Straub J, Watanabe M, Wiórkiewicz-Kuczera J, Yin D, Karplus M. All-Atom Empirical Potential for Molecular Modeling and Dynamics Studies of Proteins. J. Phys. Chem. B. 1998;102:3586–3616. doi: 10.1021/jp973084f. doi:10.1021/jp973084f. [DOI] [PubMed] [Google Scholar]
- Miles CA, Sims TJ, Camacho NP, Bailey AJ. The Role of the 2 Chain in the Stabilization of the Collagen Type I Heterotrimer: A Study of the Type I Homotrimer in oim Mouse Tissues. J. Mol. Biol. 2002;321:797–805. doi: 10.1016/s0022-2836(02)00703-9. doi: http://dx.doi.org/10.1016/S0022-2836(02)00703-9. [DOI] [PubMed] [Google Scholar]
- Persistence of Vision Raytracer. 2004.
- Phillips JC, Braun R, Wang W, Gumbart J, Tajkhorshid E, Villa E, Chipot C, Skeel RD, Kalé L, Schulten K. Scalable molecular dynamics with NAMD. J. Comput. Chem. 2005;26:1781–1802. doi: 10.1002/jcc.20289. doi:10.1002/jcc.20289. [DOI] [PMC free article] [PubMed] [Google Scholar]
- Pradhan S, Katti D, Katti K. Steered molecular dynamics study of mechanical response of full length and short collagen molecules. J. Nanomech. Micromech. 2011:104–110. doi:10.1061/(ASCE)NM. [Google Scholar]
- Pradhan SM, Katti KS, Katti DR. Structural hierarchy controls deformation behavior of collagen. Biomacromolecules. 2012;13:2562–9. doi: 10.1021/bm300801a. doi:10.1021/bm300801a. [DOI] [PubMed] [Google Scholar]
- Rainey J, Goh M. An interactive triple-helical collagen builder. Bioinformatics. 2004;20:2458–2459. doi: 10.1093/bioinformatics/bth247. doi:10.102/ci034177z.Skoog. [DOI] [PubMed] [Google Scholar]
- Rainey JK, Goh MC. A statistically derived parameterization for the collagen triple-helix. Protein Sci. 2002;11:2748–54. doi: 10.1110/ps.0218502. doi:10.1110/ps.0218502. [DOI] [PMC free article] [PubMed] [Google Scholar]
- Ramshaw JA, Shah NK, Brodsky B. Gly-X-Y tripeptide frequencies in collagen: a context for host-guest triple-helical peptides. J. Struct. Biol. 1998;122:86–91. doi: 10.1006/jsbi.1998.3977. [DOI] [PubMed] [Google Scholar]
- Sasaki N, Odajima S. Stress-strain curve and young's modulus of a collagen molecule as determined by the X-ray diffraction technique. J. Biomech. 1996;29:655–658. doi: 10.1016/0021-9290(95)00110-7. doi:10.1016/0021-9290(95)00110-7. [DOI] [PubMed] [Google Scholar]
- Shen Z, Dodge MR, Kahn H, Ballarini R, Eppell SJ. Stress-strain experiments on individual collagen fibrils. Biophys. J. 2008;95:3956–63. doi: 10.1529/biophysj.107.124602. doi:10.1529/biophysj.107.124602. [DOI] [PMC free article] [PubMed] [Google Scholar]
- Shen Z, Kahn H, Ballarini R, Eppell S. Viscoelastic properties of isolated collagen fibrils. Biophys. J. 2011;100:3008–15. doi: 10.1016/j.bpj.2011.04.052. doi:10.1016/j.bpj.2011.04.052. [DOI] [PMC free article] [PubMed] [Google Scholar]
- Shoulders M, Raines R. Collagen structure and stability. Annu. Rev. Biochem. 2009;78:929–958. doi: 10.1146/annurev.biochem.77.032207.120833. doi:10.1146/annurev.biochem.77.032207.120833.COLLAGEN. [DOI] [PMC free article] [PubMed] [Google Scholar]
- Silver FH, Freeman JW, Horvath I, Bradica G. Bionanotechnology. Springer; Netherlands: 2006. The role of collagen in energy storage and dissipation in extracellular Matrix; pp. 97–115. doi:10.1007/978-1-4020-4375-8. [Google Scholar]
- Soddemann T, Dünweg B, Kremer K. Dissipative particle dynamics: A useful thermostat for equilibrium and nonequilibrium molecular dynamics simulations. Phys. Rev. E. 2003;68:046702. doi: 10.1103/PhysRevE.68.046702. doi:10.1103/PhysRevE.68.046702. [DOI] [PubMed] [Google Scholar]
- Sun Y-L, Luo Z-P, Fertala A, An K-N. Direct quantification of the flexibility of type I collagen monomer. Biochem. Biophys. Res. Commun. 2002;295:382–6. doi: 10.1016/s0006-291x(02)00685-x. [DOI] [PubMed] [Google Scholar]
- Svensson RB, Hassenkam T, Grant C. a, Magnusson SP. Tensile properties of human collagen fibrils and fascicles are insensitive to environmental salts. Biophys. J. 2010a;99:4020–7. doi: 10.1016/j.bpj.2010.11.018. doi:10.1016/j.bpj.2010.11.018. [DOI] [PMC free article] [PubMed] [Google Scholar]
- Svensson RB, Hassenkam T, Hansen P, Peter Magnusson S. Viscoelastic behavior of discrete human collagen fibrils. J. Mech. Behav. Biomed. Mater. 2010b;3:112–5. doi: 10.1016/j.jmbbm.2009.01.005. doi:10.1016/j.jmbbm.2009.01.005. [DOI] [PubMed] [Google Scholar]
- Uzel SGM, Buehler MJ. Nanomechanical sequencing of collagen: tropocollagen features heterogeneous elastic properties at the nanoscale. Integr. Biol. 2009;1:452–459. doi: 10.1039/b906864c. doi:10.1039/B906864C. [DOI] [PubMed] [Google Scholar]
- Van der Rijt J. a J., van der Werf KO, Bennink ML, Dijkstra PJ, Feijen J. Micromechanical testing of individual collagen fibrils. Macromol. Biosci. 2006;6:697–702. doi: 10.1002/mabi.200600063. doi:10.1002/mabi.200600063. [DOI] [PubMed] [Google Scholar]
- Vesentini S, Redaelli A, Gautieri A. Nanomechanics of collagen microfibrils. Muscles. Ligaments Tendons J. 2013;3:23–34. doi: 10.11138/mltj/2013.3.1.023. [DOI] [PMC free article] [PubMed] [Google Scholar]
- Wenger MPE, Bozec L, Horton M. a, Mesquida P. Mechanical properties of collagen fibrils. J. Biomech. 2007;93:1255–63. doi: 10.1529/biophysj.106.103192. doi:10.1529/biophysj.106.103192. [DOI] [PMC free article] [PubMed] [Google Scholar]


