

Abstract
We report the first assessment of blind predictions of water positions at protein-protein interfaces, performed as part of the CAPRI (Critical Assessment of Predicted Interactions) community-wide experiment. Groups submitting docking predictions for the complex of the DNase domain of colicin E2 and Im2 immunity protein (CAPRI target 47), were invited to predict the positions of interfacial water molecules using the method of their choice. The predictions – 20 groups submitted a total of 195 models – were assessed by measuring the recall fraction of water-mediated protein contacts. Of the 176 high or medium quality docking models – a very good docking performance per se – only 44% had a recall fraction above 0.3, and a mere 6% above 0.5. The actual water positions were in general predicted to an accuracy level no better than 1.5 Å, and even in good models about half of the contacts represented false positives. This notwithstanding, three hotspot interface water positions were quite well predicted, and so was one of the water positions that is believed to stabilize the loop that confers specificity in these complexes. Overall the best interface water predictions was achieved by groups that also produced high quality docking models, indicating that accurate modelling of the protein portion is a determinant factor. The use of established molecular mechanics force fields, coupled to sampling and optimization procedures also seemed to confer an advantage. Insights gained from this analysis should help improve the prediction of protein-water interactions and their role in stabilizing protein complexes.
Keywords: Protein docking, water, blind prediction, CAPRI, protein interface
Introduction
Water plays a major role in stabilizing the conformation of individual proteins and of their complexes with other molecules and macromolecules, including other proteins 1,2. In addition to its role as a solvent, which underlies important physical phenomena such as the hydrophobic effect 3,4 and electrostatic screening 5, water molecules also form specific associations with macromolecules 6,7. These associations and their dynamic properties make important contributions to protein folding and stability 8, to enzyme substrate recognition and catalysis 9 and to molecular recognition in general 2,10.
Analysis of protein complexes and their interfaces has provided compelling evidence that protein-associated water crucially influences the structure and stability of protein-protein interfaces 11,12. An excellent example is the very high affinity barnase-barstar complex, where as many as 18 water molecules are fully buried in the interface between the interacting proteins 13. Water also plays an essential role in mediating transient protein-protein interactions, which are at the basis of most cellular processes 14.
Atomic-scale computational analyses of protein-water systems have been extremely valuable in providing insights into the dynamic and energetic properties of protein-water interactions and their role in conferring protein stability 15, protein-ligand interaction specificity 10,16 and in enzymatic catalysis 17. A significant body of work has also been devoted to computational methods for predicting bound water positions in known protein structures 18-21, and particularly to modelling water molecules in protein-ligand docking procedures, commonly employed in computational drug design, where water-mediated contacts often play a very important role. A plethora of methods has been developed to tackle the latter category of problems. These include methods that incorporate water molecules implicitly or explicitly to predict protein-ligand docking poses, implemented in packages such as GOLD, AUTODOCK or GLIDE 22-25,26,27, and algorithms such as WaterMap28 and WaterDock 29. Other approaches such as SuperStar 30 and AcquaAlta 31 identify hydration sites in proteins using knowledge-based approaches.
In comparison, very few methods have been proposed for the prediction of hydration water positions at protein-protein interfaces32,33. Similarly, in computational protein docking procedures modelling the role of water has in general been limited to approximating its bulk effects (see for example 34). Only very few methods so far incorporate explicit water molecules in the docking calculations with positive impact on the quality of the predicted complexes 35,36.
Protein-protein docking procedures 37-40 are designed to predict the detailed atomic structure of a protein complex from the 3D structure of the individual protein components, which have either been determined independently, or are derived by homology modelling 41 from the known structure of one or more related proteins. These procedures usually involve sampling a very large number of possible association modes between the two proteins and selecting those likely to form stable associations 42-44. These tasks are very computationally intensive and current methods are still encountering difficulties in incorporating any additional degrees of freedom as part of the docking calculations in order to model conformational changes that often occur upon association45. This may be one of the reasons why most protein docking methods refrain from modelling interactions with water molecules. Another likely reason is the current limited understanding of how to account for the structural and energetic contributions of bound water molecules to protein association in the calculations.
The CAPRI (Critical Assessment of Predicted Interactions) experiment 45,46 has been playing a central role in evaluating and fostering progress in protein docking methods. Initially designed to assess the quality of predicted structures of protein complexes, it has since then undertaken the evaluation of the functions employed to score protein-protein interfaces 45,47 and more recently that of predicting the relative affinity of protein-protein association 48,49.
Here we report a first step towards extending the scope of CAPRI to the assessment of blind predictions of water positions at protein-protein interfaces. Groups submitting standard docking predictions for the complex of the DNase domain of colicin E2 and Im2 immunity protein (CAPRI target 47) 50 were invited to predict the positions of water molecules involved in the interface of the complex using the method of their choice. Interfacial water molecules are known to play a critical role in both the stability and specificity of colicin DNase-Immunity protein complexes 51,52. In the current exercise, groups thus had to predict both the structure of the protein-protein interface as well as the water positions in this interface and that, without prior knowledge of the correct answer for either modelling problems. This represented a more challenging task than in previous efforts of predicting water positions in interfaces of known protein complexes 32,33.
Twenty groups rose up to the challenge, submitting water predictions for a total 195 models of the Colicin E2 DNase – Im2 complex. These predictions were assessed by comparing protein-water interactions in the predicted interfaces to those in the target. In the following we describe the assessment method, and report the assessment results. The methods used to predict water positions are briefly reviewed with additional details provided by individual participants as Supplementary information.
The Target Complex and Its Interfacial Water Molecules
The target complex (CAPRI target T47) for which the prediction of interface water positions is evaluated here, was that of the DNase domain of colicin E2 with the cognate Im2 immunity protein 50 (RCSB-PDB code 3U43), solved at 1.72 Å resolution at 100K. Using a cryogenic structure as a benchmark for the investigation and prediction of specific protein water interactions makes good sense. In cryogenic structures hydration sites are more clearly defined than those in structures solved at room temperature and therefore the number of identifiable hydration sites is between 1.5 to 3 times that at ambient temperature 53. But sites observed at room temperature are also present in the cryogenic experiments.
Defining interface water positions as any crystallographic water molecules found within a distance of 3.5 Å of both ligand and receptor residues, the target structure comprised a total of 23 interface water positions, of which 9 are buried (with <10% solvent accessibility). Furthermore, a total of 3 interface water positions (3, 6, and 16, numbered 32, 87 and 88 in the original publication) occupy conserved positions in related colicin DNase–immunity complexes 50.
The 23 interface waters participate in 35 water-mediated ligand-receptor contacts, 21 of which originate from the 9 buried waters. The list of water-mediated contacts is provided in the Supplementary Material. Figure 1 illustrates the interface water positions in the target, and the hydrogen-bonding network formed by the subset of buried water molecules.
Figure 1.

The Colicin E2 DNase – Im2 interface highlighting interface water molecules and hydrogen bond networks made by water molecules buried at the interface.
(a) Interface water molecules in the DNase-Im2 complex. The protein subunits are illustrated using colored light blue and orange, respectively. The 9 buried interface water molecules are shown as blue spheres, the remaining 14 interface waters as red spheres. Atomic coordinates were taken from reference 50 (PDB-RCSB code 3U43). The illustration was produced using the PyMol software (www.PyMol.org).
(b) The hydrogen bond network formed by the water molecules buried in the interface of the DNase-Im2 complex. Shown are water-water and water protein contacts, formed between the water oxygens and polar heavy atoms of the proteins at a distance of 3.5Å or less.
Methods Used to Predict Interfacial Water Molecules
Groups participating in this prediction challenge needed to first predict the structure of the complex from those of the individual protein components. While no 3D structures of the Colicin E2 DNase domain or the Im2 proteins were available in the PDB, those of several related complexes between Im7-colicin E7 (PDB code 7CEI), Im9-colicin E9 (PDB code 1EMV), Im2-colicin E9 (PDB code 2WPT) and others, were available. Predictor groups were hence able to model the colicin E2 DNase-Im2 complex by homology modelling techniques using the structures of the proteins in one (or several) of these complexes as templates. This made for a relatively easy target for the docking challenge, but not necessarily for the interface water predictions, given that the precise atomic positions in the interfaces of the docking models are likely to differ from those in the target, especially those of side chains and loops.
The approaches used to predict interface water positions in the computed models spanned a wide range and were generally quite complex. They involved different methods for generating the initial water positions, sampling alternative positions and optimizing the interactions with protein atoms at the interface. Table I provides a very crude overview of the salient features of the methods used by individual groups. Detailed descriptions of these methods, provided by the participants themselves, are available in the Supplementary Material.
Table I.
Salient features of the interface water prediction methods (rows) used by the participating groups (columns). A detailed description of the different methods is given in the Supplementary Material. No Methods information was provided by the group of Wang, which is therefore not listed.
| Nakamura | Zacharias | Zou | Grudinin | Bonvin | Gray | Vajda | Bates | Eisenstein | HADDOCK | Vakser | Ritchie | Mitchell | Seok | Shen | Weng | Zhou | Fernandez-Recio | Wolfson | |
|---|---|---|---|---|---|---|---|---|---|---|---|---|---|---|---|---|---|---|---|
| Molecular mechanics force fields | X | X | X | X | X | X | X | X | X | X | X | X | X | X | X | ||||
| Knowledge-based or other force-fields | X | X | X | X | |||||||||||||||
| Homologous water positions | X | X | X | X | X | X | X | X | X | X | X | X | X | ||||||
| Energy minimization initial models | X | X | X | X | X | X | X | X | X | X | |||||||||
| Energy minimization final models | X | X | X | X | X | X | X | X | X | X | X | X | X | ||||||
| Relaxation with molecular dynamics | X | X | X | X | X | X | X | ||||||||||||
| Docking with solvent | X | X | X | ||||||||||||||||
| Distance/energy-based placement or filtering | X | X | X | X | X | X | X | X | X | X | X | X | X | ||||||
| Manual selection of water positions | X | X | X | X |
The vast majority of the groups modelled water positions a posteriori into the interface of the best docking models generated in absence of water molecules. Among these groups, a few (Wolfson, Zacharias) modelled water positions ab initio, by adding a box of water molecules at the expected density, followed by several cycles of molecular dynamics or energy refinement and pruning, to select only interface waters and to eliminate overlap between water molecules. Water positions were then rescored or refined using energy functions based on force fields from packages such as CHARMM 54, AMBER 55, or Rosetta 56 and only those with lowest energy were submitted as candidate positions for evaluation. Most other groups (Bates, Eisenstein, Gray, Vakser, Mitchell, Nakamura, Shen, Seok) applied a similar strategy, but starting from water positions derived from the structures of related complexes in the PDB. These positions were either considered alone, or complemented with additional ab-initio water positions. Grudinin and Derevyanko used knowledge-based protein-water scoring functions to model water positions, Vajda and Kozakov adapted an earlier procedure for ligand binding sites predictions to treat water binding, whereas Fernández-Recio employed the optimization procedure in DOWSER 57 to predict the position of buried water molecules. Bonvin/Haddock and Shen were the only groups to model initial interface water position during the docking calculations. These positions were then pruned, remodelled and scored, using analogous strategies to those already mentioned. Lastly, Weng and Zhou relied on very simple water placement procedures, starting from water positions derived from related complexes.
Evaluating Interface Water Predictions
The correspondence between the predicted water positions and those observed in the crystal structure of the target was evaluated for all the docking models submitted (at most 10) by each participant. To this end we identified the so-called water-mediated receptor-ligand contacts, in the target structure and in submitted docking models, respectively. Such water-mediated contacts are defined whenever residues from both the ligand and the receptor proteins have one or more heavy atoms within a 3.5 Å distance of the same water molecule, as illustrated in Fig. 2. As in standard CAPRI assessment the larger protein in the complex is denoted as the receptor, whereas the smaller one as the ligand. As shown in Fig. 2, a given interface water position may give rise to more than one water-mediated residue-residue contact, so that the number of such contacts tends to be larger than the number of interface water positions. The 23 water molecules in the target interface thus form 35 water-mediated contacts.
Figure 2.
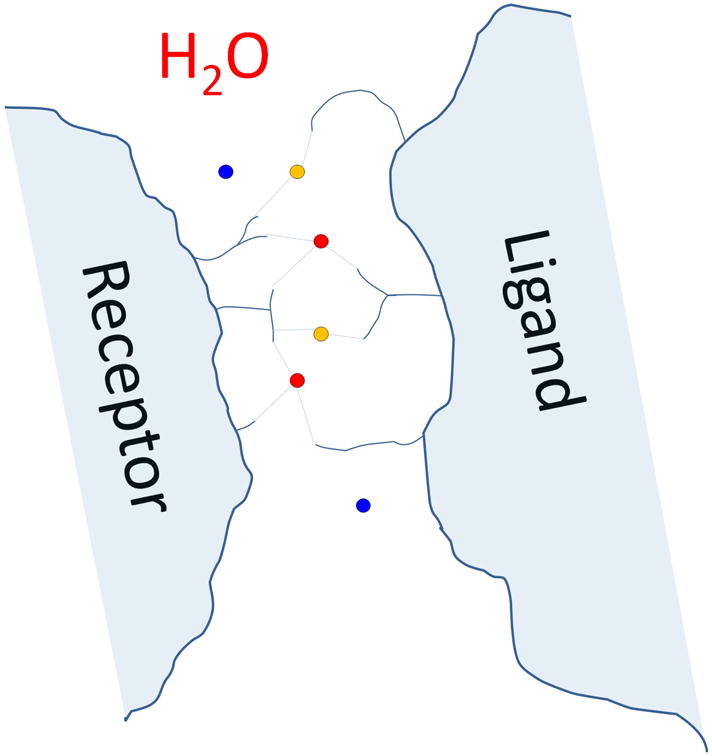
Schematic illustration of water mediated residue-residue contact at an interface of a protein-protein complex.
Water molecules are indicated as coloured circles, with red water molecules engaging in two, and orange waters in a single water-mediated contact. Blue surface waters are only bound to a single of the entities (ligand or receptor) and do not contribute to the water-mediated contact list.
Next, we computed the quantity fwmc(nat) defined as the fraction of water-mediated contacts in the target that is recalled by the docking model. This quantity is analogous to the f(nat) quantity (fraction of recalled direct native residue-residue contacts) used in CAPRI to assess docking models 45, only here the contacts are not direct receptor-ligand contacts, but indirect water-mediated contacts.
We then used fwmc(nat) to rank and classify water predictions in individual models. To avoid evaluating trivial water models where the predicted interface is filled with densely packed (or overlapping) water molecules, we used a clash threshold to accept or reject predicted water positions. We identified interface water molecules in both the target and predicted models with their number denoted respectively as and , and defined a clash as a contact of less than 2.5 Å between two interface water molecules. In the predicted models, the number of such clashes should not exceed the number of native interface waters. As clashes turned out not to be a major issue in the current exercise, we ignore them. Table II lists the ranges of fwmc(nat) values used to rank and classify predictions. These ranges are the same as those used for the ‘classic’ CAPRI f(nat) criterion, except that we add the outstanding category for fwmc(nat) ≥ 0.8.
Table II.
Ranges of fwmc(nat) values used to assign water predictions to one of 5 categories. fwmc(nat) is defined as the fraction of recalled water mediated contacts in the target that is recalled in the predicted model. In analogy to the stars (*) for the docking prediction, we assign plusses (+) for the water prediction quality.
| 0 | bad | fwmc(nat) < 0.1 |
| + | fair | 0.1 ≤ fwmc(nat) < 0.3 |
| 2+ | good | 0.3 ≤ fwmc(nat) < 0.5 |
| 3+ | excellent | 0.5 ≤ fwmc(nat) <0.8 |
| 4+ | outstanding | 0.8 ≤ fwmc(nat) |
In addition to evaluating the recall of water-mediated contacts, we also evaluated the recall of the native interface water positions themselves. This measure, denoted as fw(nat), is defined as follows:
where is defined as previously and is the number of predicted interface water molecules within a certain distance r of a crystallographic interface water. The quantity fw(nat) was computed for different values of r (0.5, 1.0, 1.5 and 2.0 Å) after fitting the interface residues of the predicted and target complexes. Interface residues were defined as residues from both proteins that have any of their atoms within 5Å distance of one another. The fitting was performed on the backbone atoms of all interface residues from both proteins. fw(nat) values were not used to rank predictions in this experiment.
Prediction Results
Performance across groups
Water positions were assessed in a total of 195 docking models of the Colicin E2 DNase–Im2 complex submitted by 20 predictor groups. The standard docking assessment classified the submitted models into 4 quality categories (incorrect, acceptable, medium, and high) based on the usual CAPRI criteria 45. Each of these models was further classified into 5 categories according to its interface water prediction quality on the basis the fwmc(nat) criterion (Table II).
The global water prediction performance, summarized in Table III, highlights the clear dependence of the prediction performance, as measured by the fwmc(nat) values, on the quality of the predicted docking models. All the 9 incorrect docking models, had ‘incorrect’ interface water predictions (fwmc(nat) < 0.1). Of the 10 acceptable models, only 4 had ‘fair’ interface water predictions (40% of the models), whereas among the 88 medium quality docking models, as many as 77 models (88%) had water predictions of ‘fair’ quality or higher, including 7 models with an ‘excellent’ water prediction quality. The best prediction performance was for the 88 high quality docking models, with 82 of these models (93%) having water predictions of fair quality or better. None of the models ranked as ‘outstanding’ (fwmc(nat) ≥ 0.8).
Table III.
Models with different quality water predictions for different category of docking models.
Listed are the numbers of models with bad, fair, good, and excellent predictions of water-mediated contacts (Columns 3-6) for each number of docking models ranked as incorrect, acceptable, medium or high quality in the classical CAPRI assessment (Columns 1,2).
| Docking Models | Models w/bad | Models w/fair | Models w/good | Models w/excellent | |
|---|---|---|---|---|---|
| Incorrect | 9 | 9 | 0 | 0 | 0 |
| Acceptable | 10 | 6 | 4 | 0 | 0 |
| Medium | 88 | 11 | 45 | 25 | 7 |
| High | 88 | 6 | 35 | 43 | 4 |
It is noteworthy, that the majority of the models contained a significant fraction of false positive (non-native) water-mediated contacts, e.g. contacts that were not formed in the target. The fraction of these non-native contacts – denoted as fwmc(non – nat) – ranged between 0.4-0.6, even in models featuring excellent water predictions as judged by their fwmc(nat) value (see Supplementary Table S2 for details).
The relationship between fwmc(nat) values and various quality measures of the predicted docking models is illustrated in Fig. 3. As expected, higher quality models, those with higher f(nat), values tend to lead to higher quality water predictions, (higher fwmc(nat), values) (Fig. 3a). However, except for the clear absence of valid water predictions for incorrect models, the correlation between the quality measures of the model and the water predictions is poor, as witnessed from the large spread of fwmc(nat) values for the medium and high quality docking models (f(nat) > 0.7). A similar poor correlation is displayed between fwmc(nat) values and those of I-rmsd and S-rmsd (Fig. 3b,c). The interface and side-chain RMSD values (I-rmsd and S-rmsd) are calculated over interface residue backbone and side-chain atoms, respectively, after a fit (model over target) on the backbone atoms of interface residues (in both cases). Here too, incorrect models (I- or S-rmsd > 4 Å) invariably have poor water predictions, but models of medium or high quality display a large spread in the quality of their water predictions (0 < fwmc(nat) < 0.6).
Figure 3.

Relationships between fwmc(nat) and various measures for evaluating the quality of docking models in the regular CAPRI assessment.
(a) Scatter plot illustrating the relationship between fwmc(nat) (vertical axis) and f(nat), the fraction of residue-residue contacts recalled in individual submitted models of the colicin E2 DNase – Im2 complex T47 (horizontal axis). Horizontal dashed lines are used to indicate fwmc(nat) values separating bad, fair, good, and excellent or outstanding predictions (see text). Vertical dotted lines indicate the f(nat) values that separate high / medium / acceptable quality docking models in the classical CAPRI assessment. Individual data points in the figures are color-coded following final evaluation classification: high quality: red; medium quality: green; acceptable: blue; incorrect: yellow.
(b) Scatter plot illustrating the relationship of fwmc(nat) and I_rmsd(Å), the root mean square deviation of backbone atoms of interface residues, in submitted models of T47. All other details are as in (a).
(c) Scatter plot illustrating the relationship of fwmc(nat) and S_rmsd(Å), the root mean square deviation of the side chain atoms of interface residues measured after optimal superimposition of the backbone of these residues in the submitted and target structures, for T47. All other details are as in (a).
It can thus be concluded that in general, docking models of acceptable quality or worse do not produce good interface water prediction models; at least a medium-quality model seems to be required, but in this exercise high-quality docking models only lead to marginally better water prediction results than medium-quality models.
Lastly, we also examined the relation between the recall of water mediated contacts and actual interface water positions. Figure 4 shows scatter plots of fwmc(nat) versus fw(nat) the fraction of recalled interface water positions, where the latter is computed for 4 values of r, the allowed maximum distance between a predicted and target water position. When requiring that water positions be accurately predicted (r ≤ 0.5Å) the recall of interface water positions remains poor, even for fwmc(nat) ranges corresponding to ‘good’ and ‘fair’ water-mediated contact recall fractions. There is as a result little correlation between the performance measured by the recall of water-mediated contacts, and the recall of actual water positions. This correlation significantly improves however, as the accuracy requirements are relaxed (larger r values). Accepting as correct any predicted water position within 2 Å distance of a water molecule in the target leads to an excellent performance for water position recall: A total of 32 models had fw(nat) ≥ 0.5, including 2 models with fw(nat) ∼ 0.9 (Fig. 4). The 2 Å distance threshold is smaller than the average distance between 2 water molecules in the bulk (2.85 Å), or the distance of 2.5 Å used here to define a clash between 2 water positions, but it is much larger than the root mean square displacement (∼0.71Å) of the water molecule with the largest B-factor (B∼40Å2) in the crystal structure of the target. The 2Å threshold may therefore be regarded as corresponding to a valid low accuracy prediction. At this lower level of prediction accuracy, we observed that most models with excellent water position recall fw(nat) ≥ 0.5 also displayed a fraction of false positive predictions – predicted water positions that were not observed in the target interface. However, this fraction was on average lower than for the water-mediated contact predictions and generally ranged between 0.2 and 0.4. Only two models (by Grudinin) featured near zero false positive water positions (see Supplementary Table S2 for detail).
Figure 4.

Relationship between fwmc(nat) the recall of water mediated contacts, and fw(nat)(r) the recall of observed water positions in the predicted models for four different values of r, the distance between a predicted and closests observed water position. Each triangle in the plots correponds to the fw(nat)/fwmc(nat) pair of a single submitted model. The correlation coefficient for the data in the four plots is: 0.45 (r = 0.5 Å), 0.64 (r = 1.0 Å), 0.77 (r = 1.5 Å) and 0.81 (r = 2.0 Å).
Performance of individual groups
Table IV lists the performance of individual groups as measured by the number of models falling into one of the 5 categories in terms of the recall of water mediated contacts. A total of 20 groups submitted models with predicted water positions. Of these, 15 groups submitted at least one model out of the allowed 10, with good quality water predictions, as judged by their fwmc(nat) value.
Table IV. Water prediction results for individual groups.
The participant ID number and name appear in column 1,2. Columns 3-6 list the number of docking models submitted by each group, ranked as high quality (***), medium quality (**), acceptable (*), and incorrect (0), respectively. These ranking was performed on the basis of the classical CAPRI assessment criteria.
Columns 7-11 list for each group the number of models classified in one of 5 categories on the basis of their water predictions performance assessed using the ranges of fwmc(nat) values listed in Table I. The right-most column lists the number of models with water predictions over the total number of submitted models by each group.
| Docking prediction | Water prediction | ||||||||||
|---|---|---|---|---|---|---|---|---|---|---|---|
|
| |||||||||||
| ID | Participant | *** | ** | * | 0 | 4+ | 3+ | 2+ | + | 0 | Models |
| P26 | Nakamura | 1 | 9 | 0 | 0 | 0 | 7 | 3 | 0 | 0 | 10/10 |
| P08 | Zacharias | 7 | 3 | 0 | 0 | 0 | 3 | 4 | 3 | 0 | 10/10 |
| P40 | Zou | 10 | 0 | 0 | 0 | 0 | 1 | 9 | 0 | 0 | 10/10 |
| P23 | Grudinin | 8 | 2 | 0 | 0 | 0 | 0 | 9 | 1 | 0 | 10/10 |
| P10 | Bonvin | 4 | 6 | 0 | 0 | 0 | 0 | 6 | 4 | 0 | 10/10 |
| P11 | Gray | 1 | 9 | 0 | 0 | 0 | 0 | 6 | 3 | 1 | 9/10 |
| P38 | Vajda | 10 | 0 | 0 | 0 | 0 | 0 | 6 | 2 | 2 | 10/10 |
| P02 | Bates | 0 | 10 | 0 | 0 | 0 | 0 | 5 | 5 | 0 | 10/10 |
| P37 | Eisenstein | 6 | 0 | 0 | 0 | 0 | 0 | 5 | 1 | 0 | 6/6 |
| P32 | HADDOCK | 9 | 1 | 0 | 0 | 0 | 0 | 4 | 6 | 0 | 10/10 |
| P30 | Vakser | 7 | 3 | 0 | 0 | 0 | 0 | 4 | 6 | 0 | 10/10 |
| P13 | Ritchie | 1 | 6 | 0 | 3 | 0 | 0 | 3 | 4 | 3 | 10/10 |
| P31 | Mitchell | 0 | 9 | 1 | 0 | 0 | 0 | 2 | 8 | 0 | 10/10 |
| P29 | Seok | 10 | 0 | 0 | 0 | 0 | 0 | 1 | 9 | 0 | 10/10 |
| P17 | Wang | 1 | 7 | 2 | 0 | 0 | 0 | 1 | 6 | 3 | 10/10 |
| P49 | Shen | 3 | 4 | 2 | 1 | 0 | 0 | 0 | 7 | 3 | 10/10 |
| P15 | Weng | 10 | 0 | 0 | 0 | 0 | 0 | 0 | 6 | 4 | 10/10 |
| P47 | Zhou | 0 | 10 | 0 | 0 | 0 | 0 | 0 | 6 | 4 | 10/10 |
| P01 | Fernandez-Recio | 1 | 1 | 3 | 5 | 0 | 0 | 0 | 4 | 6 | 10/10 |
| P05 | Wolfson | 0 | 8 | 2 | 0 | 0 | 0 | 0 | 3 | 7 | 10/10 |
The top-performing group (Nakamura) submitted 7 models with ‘excellent’ water predictions and 3 models with ‘good’ ones. The other two groups to submit at least 1 model with excellent water predictions are Zacharias (3 models) and Zou (1 model). Unsurprisingly, all the docking models submitted by these groups were of medium quality or higher (Table IV). But this was also the case for several other groups such as Vajda, Vakser, Seok and Weng, whose water predictions were less successful. It might be of note, that Zacharias predicted interface water positions ab initio, combining energy functions that incorporate well-established force fields (AMBER) with energy minimization and short molecular dynamics runs. Both Nakamura and Zou used initial water positions derived from interfaces of related complexes, followed by pruning and by energy minimization, also using the AMBER force field, to yield the final predictions. All three groups modelled their water positions into docking solutions derived in absence of explicit water molecules.
Prediction of buried water molecules
Of the 23 interface waters molecules in the target, 9 are buried (with ≤10% of their surface accessible to bulk solvent). These water molecules contribute 17 out of the 35 ligand-receptor water mediated contacts all involving polar main chain or side chain atoms, and are hence heavily embedded in the interface. The prediction results for the corresponding water positions were therefore examined in further detail.
Figure 5 shows the distances of the closest predicted water position to each of the 23 interface water molecules submitted by individual groups. The water molecules are ordered by solvent accessibility and the results for the 9 buried waters appear at the lower part of the graph. Only two buried water molecules, 3 and 6 and to a lesser extent water 4, were relatively well predicted, with 15 out of the 20 groups predicting a water position within 1.0 Å of waters 3 and 6 (see also Supplementary Figure S2). Otherwise, buried waters don't seem to be better predicted than more accessible ones. On the other hand, we find that the three water molecules, 3,6, and 16, which are well conserved in other complexes of this family and are present in the structure of unbound E9 DNase 58, are clearly among the best predicted interface water molecules (Fig. 5). Water 3 and 6 are buried, but water 16 is partially accessible. There also are relatively good predictions for water 4. Both this water and water 5 interact with one another and appear to stabilize the loop that is involved in defining the specificity for this family of complexes, although water 5 is much less well predicted. The remaining, non-buried waters are more widely spaced and do not cluster together, with the exception of waters 10, 19 and 21. We observe again that one of them – water 10 – is consistently well predicted, whereas waters 19 and 21 are not. It is at this point not clear why particular water positions in a cluster or a pair of interacting water molecules are better predicted than others.
Figure 5.

Closest distance at which a predicted water molecule was found in the ensemble of predicted models, for each of the 23 water molecules in the interface, including the 9 buried ones. Individual data points are coloured according to their water prediction quality (see legend in Figure) and placed on the four (dotted) lines, following the prediction quality of the underlying docking model, from top to bottom line: high, medium, acceptable and incorrect. The 9 buried water molecules make (< 3.5 Å) contacts with the following ligand and receptor residues and atoms: W1 – Tyr-A54O, Lys-B72N, Asn-B75Nδ2; W2 – Tyr-A54O, Lys-B72O, Ser-B74N, Asn-B75N; W3 – Ile-A53O, Asp-A62Oδ1, Gly-B73N, Ser-B74N; W4 – Ile-A22O, Tyr-A54Oη, Asn-B78Nδ2; W5 – Asp-A33Oδ2, Asn-B78Oδ1, Arg-B98Nη2; W6 – Ser-A50Oγ, Asp-A51Oδ1, Ala-B87O, Gln-B92Nε2; W7 – Glu-A41Oε2, Ser-A50Oγ, Gln-B92Oε1; W8 – Asp-A62Oδ1, Ser-B74Oγ; W9 – Arg-A38Cγ, Glu-B97Oε2.
Lastly, our results also show that groups with a better water prediction performance overall are also more successful in predicting buried water molecules (Supplementary Table S2 and Fig. S3): Both Nakamura and Zacharias predict 5 of the 9 buried waters to within 1.0 Å, a number that, for Nakamura, increases to 8 out of 9 when relaxing the distance threshold to 1.5 Å. As already mentioned, both predictors use a similar procedure, applying energy minimization after a short molecular dynamics run with standard force-fields, confirming that the procedure is quite successful. However, whereas Zacharias places initial water molecules at random positions, Nakamura extracts them from crystal waters found in the related template structure (PDB code 2WPT), indicating that the performance of the procedure depends little on the starting water positions, as will be demonstrated below.
Modelling interface water positions in the target complex
Having observed a clear relationship between the quality of the predicted docking model and those of the water mediated contacts predictions, it seemed of interest to find out how well interface water molecules could be predicted starting from a perfect model of the complex. To this end we performed short (100 ps; 1 ps=10–12 sec) molecular dynamics simulations of the target colicin E2 DNase-Im2 complex in a box of explicit water molecules. The simulations were carried with the Gromacs package 59, using the SPC water model 60 standard periodic boundary conditions, and the Particle Mesh Ewald Method 61. Trajectories were produced at room temperature and at 100K. The protein coordinates were held fixed allowing only the water molecules to move. Interface water positions, and the water-mediated contacts in which they participate, were then analyzed in individual conformations from the simulated ensemble, as if they were models submitted in the current exercise.
Figure 6a shows the distribution of the fwmc(nat) and fwmc(non – nat) values in the simulated ensemble after random initial placement of the water molecules. The initial randomly placed water molecules give rise to fwmc(nat) values between 0.2 and 0.4 (data not shown), but they quickly adapt to the environment of the correctly placed protein side chains, to produce a distribution of values in the ‘excellent’ category (0.5 < fwmc(nat) ≤ 0.7). These values are centered roughly around that of the best predictor group (fwmc(nat) = 0.6 for Nakamura). A quenching experiment (dropping the simulation temperature during 100 ps from 310 K to 100 K) improves the fwmc(nat) values, and decreases somewhat the fraction of false positives predictions (fwmc(non – nat)) (Fig. 6b).
Figure 6.

Distributions of water prediction quality measures in conformational ensembles derived from molecular dynamics simulations of the target complex in presence of explicit water molecules. (a) Distributions derived from 100ps 310K simulation ensembles, starting from water molecules placed randomly in the simulation box. (b) Distributions derived from ensembles obtained after further 100ps simulations starting from those in (a) and dropping the temperature from 310K to 100K. (c) Distributions derived from 100ps 310K simulation ensembles, starting from water positions taken from the target x-ray structure. Plotted are the frequencies of models (vertical axis) as a function of the fwmc(nat) and fwmc(non-nat) values (horizontal axis). The total number of models in each panel was 101, corresponding to the number of recorded conformations in the molecular dynamics simulations. All other details are provided in the text.
Figure 6c shows the distribution of fwmc(nat) and fwmc(non-nat) values of simulated ensembles, where the initial placement of water molecules was taken from the (target) x-ray structure. Among the 101 frames analyzed, 69 (68%) have fwmc(nat) values exceeding 0.8, corresponding to the ‘outstanding’ classification. All other frames fall into the ‘excellent’ category. The distribution of the fraction of false positive predictions fwmc(non-nat) shows that this fraction remains consistently low, as about half of the models have fwmc(non-nat) values of 0.2 or lower, and none of the models exhibit values above 0.4. Decreasing the simulation temperature is expected to lower this fraction even further, analogous to the results in Fig. 6b.
These results taken together indicate that, given a perfect docking model, a situation rarely if ever encountered in blind predictions, water positions can be modelled a posteriori quite successfully using standard molecular mechanics force fields and sampling procedures. Furthermore, in this combined approach the prediction performance, as gauged here, is not crucially dependent on the initial positions of the water molecules. Similar findings have been reported in a number of previous studies using molecular simulations to model protein hydration and its influence on binding 36,53,62-64.
Discussion
In this paper we report the result of the first interface water prediction CAPRI challenge. In this challenge, groups using docking methods to predict the structure of CAPRI target T47, a complex between the DNase domain of colicin E2 and the cognate immunity protein Im2, were invited to submit predictions for the positions of water molecules in the interface of the complex. The predictions were assessed by measuring the fraction of water-mediated contacts in the target that was recalled in the docking model. T47 was an easy target for the protein docking challenge because it was very similar to other known complexes of related proteins, including a target (T41) previously used in CAPRI. Not surprisingly therefore, many high or medium quality docking models were submitted (Tables III, IV). However, the main goal of this experiment was to predict the position of interface waters, and that proved much more difficult: of the 176 high or medium quality docking models, only 78 (44%) had a water-mediated contacts recall fraction fwmc(nat) above 0.3, and a mere 11 (6%) had a recall fraction above 0.5. The fraction of models increases to 90% (159 models) when lower recall fractions (0.1 ≤ fwmc(nat) ≤ 0.3) for water predictions are considered.
These results suggest that further work is needed to reach an interface water prediction performance that is of practical use in applications such as drug and protein design. It is currently difficult to indicate with some confidence the direction that such further work must take, as the blind benchmarking carried out here was limited to a single interface. Moreover, the methods employed by different participants are often complex and span a wide range.
As already mentioned, the colicin E2 DNase–Im2 interface is part of a high-resolution structure (1.72Å) determined at cryogenic temperatures (100K) 50. There is compelling evidence that using a cryogenic structure to benchmark the performance of interface water predictions is highly relevant 53. In a cryogenic structure of a protein-protein complex, hydration sites, which include but are not limited to those identified in a protein-protein interface, are more clearly defined than those in structures solved at room temperature. This follows from the fact that at cryogenic temperatures the mobility of some of the more dynamic water molecules is sufficiently reduced to be able to identify and refine their positions in the electron density map, especially if this map is based on high-resolution data, as is the case here.
Analysis of the performance of individual groups indicates that some groups perform better than others. The methods description (Table I and Supplementary Material) together with Table IV, which ranks participants according to their interface water prediction performance, clearly indicate that a high to medium quality model for the protein complex is a prerequisite for successful interface water predictions. Beyond that, it appears that methods, which combine the use of more sophisticated force-fields (e.g. classical empirical force fields or the equivalent) with some sampling, followed by energy minimization, were more successful than much simpler water placement methods used for example by the groups of Weng, and Zhou. The disadvantage of the simpler methods is surmised from fact that they yielded some of the poorest interface water predictions in high and medium quality docking models for the protein complex (Table I).
Our own quite successful water modelling exercise on the target structure supports the conclusion on the advantage conferred by the use of classical molecular mechanics force-fields coupled with standard sampling and refinement procedures, provided the model of the protein portion is accurate enough. Taken together with the prediction results of the CAPRI community our test also indicates that predicting water positions a posteriori, by modelling them onto a docked complex, is a promising approach when the docking calculations themselves produce accurate models for the inter-molecular interface. But this approach clearly needs further fine tuning since even the best performing groups still produced a significant fraction of predicted false positive water mediated contacts. Reducing this fraction may require more elaborate approaches for modelling both the protein and water portions of the system. For the water portion this may involve estimating protein-water relative free energies or accounting for polarization effects to further prune candidate water positions derived on the basis of energy estimates alone. On the other hand one may argue that some of the false positive predictions may represent water molecules engaged in more dynamic interactions with the protein, which the crystallographic study considers as disordered (e.g. water positions with B-factors > ∼70Å2, Kleanthous, personal communications). A detailed comparison of the predicted water positions and contacts to those of the more mobile water positions may shed light on this interpretation.
Nonetheless it was reassuring to see that the three highly conserved water molecule (waters 3, 6, 16), which are believed to be part of the protein-protein interface hotspot are among the best predicted interface water positions. Another important water position (water 4), which is involved in defining the specificity for this particular family of complexes, is also relatively well predicted. Overall however, the prediction performance was not better for buried waters than for more accessible ones. Although we did note that well-predicted buried waters often represented one member of a small cluster of water molecules, whereas other members of the cluster were usually less well predicted, possibly due to the fact that predictor groups tended to avoid crowding several water positions in close proximity.
Finally it should be mentioned that for some systems – those that give rise to highly hydrated interfaces – deriving accurate prediction of the complex may require modelling protein-water interactions as part of the docking procedure. At present, examples of docking methods, which incorporate protein-water interactions remain the exception 35,65. But as more hydrated target interfaces are submitted as targets to CAPRI, docking methods will evolve to more fully integrate protein-water interactions into the prediction process. We therefore expect that the assessment of predicted interface water positions will become an integral part of the CAPRI evaluation procedure going forward.
Supplementary Material
Acknowledgments
The Canadian Institutes for Health Research is gratefully acknowledged for support to SJW. MFL acknowledges financial support from the French Agence Nationale de Recherche (grant ANR-12-BSV5-0009-01, Fluctuations in Structured Coulomb Fluids). (Vakser): IAV and PJK are supported by NIH grant R01GM074255. CK acknowledges support for this work from the BBSRC (grant GG/G020671/1).
References
- 1.Timasheff SN. The control of protein stability and association by weak interactions with water: how do solvents affect these processes? Annu Rev Biophys Biomol Struct. 1993;22:67–97. doi: 10.1146/annurev.bb.22.060193.000435. [DOI] [PubMed] [Google Scholar]
- 2.Levy Y, Onuchic JN. Water mediation in protein folding and molecular recognition. Annu Rev Biophys Biomol Struct. 2006;35:389–415. doi: 10.1146/annurev.biophys.35.040405.102134. [DOI] [PubMed] [Google Scholar]
- 3.Kauzmann W. Some factors in the interpretation of protein denaturation. Adv Protein Cjem. 1959;14:239–345. doi: 10.1016/s0065-3233(08)60608-7. [DOI] [PubMed] [Google Scholar]
- 4.Kuntz ID, Jr, Kauzmann W. Hydration of proteins and polypeptides. Adv Protein Chem. 1974;28:239–345. doi: 10.1016/s0065-3233(08)60232-6. [DOI] [PubMed] [Google Scholar]
- 5.Schutz CN, Warshel A. What are the dielectric “constants” of proteins and how to validate electrostatic models? Proteins. 2001;44(4):400–417. doi: 10.1002/prot.1106. [DOI] [PubMed] [Google Scholar]
- 6.Mentre P. Water in the orchestration of the cell machinery. Some misunderstandings: a short review. J Biol Phys. 2012;38(1):13–26. doi: 10.1007/s10867-011-9225-9. [DOI] [PMC free article] [PubMed] [Google Scholar]
- 7.Mattos C. Protein-water interactions in a dynamic world. Trends Biochem Sci. 2002;27(4):203–208. doi: 10.1016/s0968-0004(02)02067-4. [DOI] [PubMed] [Google Scholar]
- 8.Zhang L, Yang Y, Kao YT, Wang L, Zhong D. Protein hydration dynamics and molecular mechanism of coupled water-protein fluctuations. J Am Chem Soc. 2009;131(30):10677–10691. doi: 10.1021/ja902918p. [DOI] [PubMed] [Google Scholar]
- 9.Philips RS. How does active site water affect enzymatic stereorecognition? JMol Catl B Enz. 2002;19-20:103–107. [Google Scholar]
- 10.Ben-Naim A. Molecular recognition--viewed through the eyes of the solvent. Biophys Chem. 2002;101-102:309–319. doi: 10.1016/s0301-4622(02)00165-5. [DOI] [PubMed] [Google Scholar]
- 11.Janin J. Wet and dry interfaces: the role of solvent in protein-protein and protein-DNA recognition. Structure. 1999;7(12):R277–279. doi: 10.1016/s0969-2126(00)88333-1. [DOI] [PubMed] [Google Scholar]
- 12.Rodier F, Bahadur RP, Chakrabarti P, Janin J. Hydration of protein-protein interfaces. Proteins. 2005;60(1):36–45. doi: 10.1002/prot.20478. [DOI] [PubMed] [Google Scholar]
- 13.Buckle AM, Schreiber G, Fersht AR. Protein-protein recognition: crystal structural analysis of a barnase-barstar complex at 2.0-A resolution. Biochemistry. 1994;33(30):8878–8889. doi: 10.1021/bi00196a004. [DOI] [PubMed] [Google Scholar]
- 14.Perkins JR, Diboun I, Dessailly BH, Lees JG, Orengo C. Transient protein-protein interactions: structural, functional, and network properties. Structure. 2010;18(10):1233–1243. doi: 10.1016/j.str.2010.08.007. [DOI] [PubMed] [Google Scholar]
- 15.Teeter MM. Water-protein interactions: theory and experiment. Annu Rev Biophys Biophys Chem. 1991;20:577–600. doi: 10.1146/annurev.bb.20.060191.003045. [DOI] [PubMed] [Google Scholar]
- 16.Huggins DJ, Tidor B. Systematic placement of structural water molecules for improved scoring of protein-ligand interactions. Protein Eng Des Sel. 2011;24(10):777–789. doi: 10.1093/protein/gzr036. [DOI] [PMC free article] [PubMed] [Google Scholar]
- 17.Kollman PA, K B, Perakyla M. Computational studies of enzyme catalyzed reactions: where are we in predicting mechanisms and understanding the nature of enzyme catalysis? J Phys Chem B. 2002;106:1537–1541. [Google Scholar]
- 18.Boobbyer DN, Goodford PJ, McWhinnie PM, Wade RC. New hydrogen-bond potentials for use in determining energetically favorable binding sites on molecules of known structure. J Med Chem. 1989;32(5):1083–1094. doi: 10.1021/jm00125a025. [DOI] [PubMed] [Google Scholar]
- 19.Wade RC, Goodford PJ. Further development of hydrogen bond functions for use in determining energetically favorable binding sites on molecules of known structure. 2. Ligand probe groups with the ability to form more than two hydrogen bonds. J Med Chem. 1993;36(1):148–156. doi: 10.1021/jm00053a019. [DOI] [PubMed] [Google Scholar]
- 20.Wade RC, Clark KJ, Goodford PJ. Further development of hydrogen bond functions for use in determining energetically favorable binding sites on molecules of known structure. 1. Ligand probe groups with the ability to form two hydrogen bonds. J Med Chem. 1993;36(1):140–147. doi: 10.1021/jm00053a018. [DOI] [PubMed] [Google Scholar]
- 21.Schymkowitz JW, Rousseau F, Martins IC, Ferkinghoff-Borg J, Stricher F, Serrano L. Prediction of water and metal binding sites and their affinities by using the Fold-X force field. Proc Natl Acad Sci U S A. 2005;102(29):10147–10152. doi: 10.1073/pnas.0501980102. [DOI] [PMC free article] [PubMed] [Google Scholar]
- 22.Verdonk ML, Chessari G, Cole JC, Hartshorn MJ, Murray CW, Nissink JW, Taylor RD, Taylor R. Modeling water molecules in protein-ligand docking using GOLD. J Med Chem. 2005;48(20):6504–6515. doi: 10.1021/jm050543p. [DOI] [PubMed] [Google Scholar]
- 23.Osterberg F, Morris GM, Sanner MF, Olson AJ, Goodsell DS. Automated docking to multiple target structures: incorporation of protein mobility and structural water heterogeneity in AutoDock. Proteins. 2002;46(1):34–40. doi: 10.1002/prot.10028. [DOI] [PubMed] [Google Scholar]
- 24.Corbeil CR, Englebienne P, Moitessier N. Docking ligands into flexible and solvated macromolecules. 1. Development and validation of FITTED 1.0. J Chem Inf Model. 2007;47(2):435–449. doi: 10.1021/ci6002637. [DOI] [PubMed] [Google Scholar]
- 25.de Graaf C, Pospisil P, Pos W, Folkers G, Vermeulen NP. Binding mode prediction of cytochrome p450 and thymidine kinase protein-ligand complexes by consideration of water and rescoring in automated docking. J Med Chem. 2005;48(7):2308–2318. doi: 10.1021/jm049650u. [DOI] [PubMed] [Google Scholar]
- 26.Friesner RA, Murphy RB, Repasky MP, Frye LL, Greenwood JR, Halgren TA, Sanschagrin PC, Mainz DT. Extra precision glide: docking and scoring incorporating a model of hydrophobic enclosure for protein-ligand complexes. J Med Chem. 2006;49(21):6177–6196. doi: 10.1021/jm051256o. [DOI] [PubMed] [Google Scholar]
- 27.Forli S, Olson AJ. A force field with discrete displaceable waters and desolvation entropy for hydrated ligand docking. J Med Chem. 2012;55(2):623–638. doi: 10.1021/jm2005145. [DOI] [PMC free article] [PubMed] [Google Scholar]
- 28.Wang L, Berne BJ, Friesner RA. Ligand binding to protein-binding pockets with wet and dry regions. Proc Natl Acad Sci U S A. 2011;108(4):1326–1330. doi: 10.1073/pnas.1016793108. [DOI] [PMC free article] [PubMed] [Google Scholar]
- 29.Ross GA, Morris GM, Biggin PC. Rapid and accurate prediction and scoring of water molecules in protein binding sites. PLoS One. 2012;7(3):e32036. doi: 10.1371/journal.pone.0032036. [DOI] [PMC free article] [PubMed] [Google Scholar]
- 30.Verdonk ML, Cole JC, Taylor R. SuperStar: a knowledge-based approach for identifying interaction sites in proteins. J Mol Biol. 1999;289(4):1093–1108. doi: 10.1006/jmbi.1999.2809. [DOI] [PubMed] [Google Scholar]
- 31.Rossato G, Ernst B, Vedani A, Smiesko M. AcquaAlta: a directional approach to the solvation of ligand-protein complexes. J Chem Inf Model. 2011;51(8):1867–1881. doi: 10.1021/ci200150p. [DOI] [PubMed] [Google Scholar]
- 32.Jiang L, Kuhlman B, Kortemme T, Baker D. A “solvated rotamer” approach to modeling water-mediated hydrogen bonds at protein-protein interfaces. Proteins. 2005;58(4):893–904. doi: 10.1002/prot.20347. [DOI] [PubMed] [Google Scholar]
- 33.Bui HH, Schiewe AJ, Haworth IS. WATGEN: an algorithm for modeling water networks at protein-protein interfaces. J Comput Chem. 2007;28(14):2241–2251. doi: 10.1002/jcc.20751. [DOI] [PubMed] [Google Scholar]
- 34.Camacho CJ, Gatchell DW, Kimura SR, Vajda S. Scoring docked conformations generated by rigid-body protein-protein docking. Proteins. 2000;40(3):525–537. doi: 10.1002/1097-0134(20000815)40:3<525::aid-prot190>3.0.co;2-f. [DOI] [PubMed] [Google Scholar]
- 35.Kastritis PL, Visscher KM, van Dijk AD, Bonvin AM. Solvated protein-protein docking using Kyte-Doolittle-based water preferences. Proteins. 2013;81(3):510–518. doi: 10.1002/prot.24210. [DOI] [PubMed] [Google Scholar]
- 36.Ahmad M, Gu W, Geyer T, Helms V. Adhesive water networks facilitate binding of protein interfaces. Nat Commun. 2011;2:261. doi: 10.1038/ncomms1258. [DOI] [PubMed] [Google Scholar]
- 37.Wodak SJ, Janin J. Computer analysis of protein-protein interaction. J Mol Biol. 1978;124(2):323–342. doi: 10.1016/0022-2836(78)90302-9. [DOI] [PubMed] [Google Scholar]
- 38.Cherfils J, Duquerroy S, Janin J. Protein-protein recognition analyzed by docking simulation. Proteins. 1991;11(4):271–280. doi: 10.1002/prot.340110406. [DOI] [PubMed] [Google Scholar]
- 39.Vakser IA. Protein docking for low-resolution structures. Protein Eng. 1995;8(4):371–377. doi: 10.1093/protein/8.4.371. [DOI] [PubMed] [Google Scholar]
- 40.Katchalski-Katzir E, Shariv I, Eisenstein M, Friesem AA, Aflalo C, Vakser IA. Molecular surface recognition: determination of geometric fit between proteins and their ligands by correlation techniques. Proc Natl Acad Sci U S A. 1992;89(6):2195–2199. doi: 10.1073/pnas.89.6.2195. [DOI] [PMC free article] [PubMed] [Google Scholar]
- 41.Fiser A, Sali A. Modeller: generation and refinement of homology-based protein structure models. Methods Enzymol. 2003;374:461–491. doi: 10.1016/S0076-6879(03)74020-8. [DOI] [PubMed] [Google Scholar]
- 42.Wodak SJ, Janin J. Structural basis of macromolecular recognition. Adv Protein Chem. 2002;61:9–73. doi: 10.1016/s0065-3233(02)61001-0. [DOI] [PubMed] [Google Scholar]
- 43.Zacharias M. Accounting for conformational changes during protein-protein docking. Curr Opin Struct Biol. 2010;20(2):180–186. doi: 10.1016/j.sbi.2010.02.001. [DOI] [PubMed] [Google Scholar]
- 44.Ritchie DW. Recent progress and future directions in protein-protein docking. Curr Protein Pept Sci. 2008;9(1):1–15. doi: 10.2174/138920308783565741. [DOI] [PubMed] [Google Scholar]
- 45.Lensink MF, Wodak SJ. Docking and scoring protein interactions: CAPRI 2009. Proteins. 2010;78(15):3073–3084. doi: 10.1002/prot.22818. [DOI] [PubMed] [Google Scholar]
- 46.Janin J. Protein-protein docking tested in blind predictions: the CAPRI experiment. Mol Biosyst. 2010;6(12):2351–2362. doi: 10.1039/c005060c. [DOI] [PubMed] [Google Scholar]
- 47.Lensink MF, Mendez R, Wodak SJ. Docking and scoring protein complexes: CAPRI 3rd Edition. Proteins. 2007;69(4):704–718. doi: 10.1002/prot.21804. [DOI] [PubMed] [Google Scholar]
- 48.Fleishman SJ, Whitehead TA, Strauch EM, Corn JE, Qin S, Zhou HX, Mitchell JC, Demerdash ON, Takeda-Shitaka M, Terashi G, Moal IH, Li X, Bates PA, Zacharias M, Park H, Ko JS, Lee H, Seok C, Bourquard T, Bernauer J, Poupon A, Aze J, Soner S, Ovali SK, Ozbek P, Tal NB, Haliloglu T, Hwang H, Vreven T, Pierce BG, Weng Z, Perez-Cano L, Pons C, Fernandez-Recio J, Jiang F, Yang F, Gong X, Cao L, Xu X, Liu B, Wang P, Li C, Wang C, Robert CH, Guharoy M, Liu S, Huang Y, Li L, Guo D, Chen Y, Xiao Y, London N, Itzhaki Z, Schueler-Furman O, Inbar Y, Potapov V, Cohen M, Schreiber G, Tsuchiya Y, Kanamori E, Standley DM, Nakamura H, Kinoshita K, Driggers CM, Hall RG, Morgan JL, Hsu VL, Zhan J, Yang Y, Zhou Y, Kastritis PL, Bonvin AM, Zhang W, Camacho CJ, Kilambi KP, Sircar A, Gray JJ, Ohue M, Uchikoga N, Matsuzaki Y, Ishida T, Akiyama Y, Khashan R, Bush S, Fouches D, Tropsha A, Esquivel-Rodriguez J, Kihara D, Stranges PB, Jacak R, Kuhlman B, Huang SY, Zou X, Wodak SJ, Janin J, Baker D. Community-wide assessment of protein-interface modeling suggests improvements to design methodology. J Mol Biol. 2011;414(2):289–302. doi: 10.1016/j.jmb.2011.09.031. [DOI] [PMC free article] [PubMed] [Google Scholar]
- 49.Moretti R, Fleishman SJ, Agius R, Torchala M, Bates PA, Kastritis PL, Rodrigues JP, Trellet M, Bonvin AM, Cui M, Rooman M, Gillis D, Dehouck Y, Moal I, Romero-Durana M, Perez-Cano L, Pallara C, Jimenez B, Fernandez-Recio J, Flores S, Pacella M, Praneeth Kilambi K, Gray JJ, Popov P, Grudinin S, Esquivel-Rodriguez J, Kihara D, Zhao N, Korkin D, Zhu X, Demerdash ON, Mitchell JC, Kanamori E, Tsuchiya Y, Nakamura H, Lee H, Park H, Seok C, Sarmiento J, Liang S, Teraguchi S, Standley DM, Shimoyama H, Terashi G, Takeda-Shitaka M, Iwadate M, Umeyama H, Beglov D, Hall DR, Kozakov D, Vajda S, Pierce BG, Hwang H, Vreven T, Weng Z, Huang Y, Li H, Yang X, Ji X, Liu S, Xiao Y, Zacharias M, Qin S, Zhou HX, Huang SY, Zou X, Velankar S, Janin J, Wodak SJ, Baker D. Community-wide evaluation of methods for predicting the effect of mutations on protein-protein interactions. Proteins. 2013 doi: 10.1002/prot.24356. [DOI] [PMC free article] [PubMed] [Google Scholar]
- 50.Wojdyla JA, Fleishman SJ, Baker D, Kleanthous C. Structure of the ultra-high-affinity colicin E2 DNase--Im2 complex. J Mol Biol. 2012;417(1-2):79–94. doi: 10.1016/j.jmb.2012.01.019. [DOI] [PubMed] [Google Scholar]
- 51.Kuhlmann UC, Pommer AJ, Moore GR, James R, Kleanthous C. Specificity in protein-protein interactions: the structural basis for dual recognition in endonuclease colicin-immunity protein complexes. J Mol Biol. 2000;301(5):1163–1178. doi: 10.1006/jmbi.2000.3945. [DOI] [PubMed] [Google Scholar]
- 52.Meenan NA, Sharma A, Fleishman SJ, Macdonald CJ, Morel B, Boetzel R, Moore GR, Baker D, Kleanthous C. The structural and energetic basis for high selectivity in a high-affinity protein-protein interaction. Proc Natl Acad Sci U S A. 2010;107(22):10080–10085. doi: 10.1073/pnas.0910756107. [DOI] [PMC free article] [PubMed] [Google Scholar]
- 53.Nakasako M. Water-protein interactions from high-resolution protein crystallography. Philos Trans R Soc Lond B Biol Sci. 2004;359(1448):1191–1204. doi: 10.1098/rstb.2004.1498. discussion 1204-1196. [DOI] [PMC free article] [PubMed] [Google Scholar]
- 54.Brooks BR, Brooks CL, 3rd, Mackerell AD, Jr, Nilsson L, Petrella RJ, Roux B, Won Y, Archontis G, Bartels C, Boresch S, Caflisch A, Caves L, Cui Q, Dinner AR, Feig M, Fischer S, Gao J, Hodoscek M, Im W, Kuczera K, Lazaridis T, Ma J, Ovchinnikov V, Paci E, Pastor RW, Post CB, Pu JZ, Schaefer M, Tidor B, Venable RM, Woodcock HL, Wu X, Yang W, York DM, Karplus M. CHARMM: the biomolecular simulation program. J Comput Chem. 2009;30(10):1545–1614. doi: 10.1002/jcc.21287. [DOI] [PMC free article] [PubMed] [Google Scholar]
- 55.Case DA, Cheatham TE, 3rd, Darden T, Gohlke H, Luo R, Merz KM, Jr, Onufriev A, Simmerling C, Wang B, Woods RJ. The Amber biomolecular simulation programs. J Comput Chem. 2005;26(16):1668–1688. doi: 10.1002/jcc.20290. [DOI] [PMC free article] [PubMed] [Google Scholar]
- 56.Song Y, Tyka M, Leaver-Fay A, Thompson J, Baker D. Structure-guided forcefield optimization. Proteins. 2011;79(6):1898–1909. doi: 10.1002/prot.23013. [DOI] [PMC free article] [PubMed] [Google Scholar]
- 57.Zhang L, Hermans J. Hydrophilicity of cavities in proteins. Proteins. 1996;24(4):433–438. doi: 10.1002/(SICI)1097-0134(199604)24:4<433::AID-PROT3>3.0.CO;2-F. [DOI] [PubMed] [Google Scholar]
- 58.Li W, Keeble AH, Giffard C, James R, Moore GR, Kleanthous C. Highly discriminating protein-protein interaction specificities in the context of a conserved binding energy hotspot. J Mol Biol. 2004;337(3):743–759. doi: 10.1016/j.jmb.2004.02.005. [DOI] [PubMed] [Google Scholar]
- 59.Pronk S, Pall S, Schulz R, Larsson P, Bjelkmar P, Apostolov R, Shirts MR, Smith JC, Kasson PM, van der Spoel D, Hess B, Lindahl E. GROMACS 4.5: a high-throughput and highly parallel open source molecular simulation toolkit. Bioinformatics. 2013;29(7):845–854. doi: 10.1093/bioinformatics/btt055. [DOI] [PMC free article] [PubMed] [Google Scholar]
- 60.Toukan KR, A Molecular-dynamics study of atomic motion in water. Phys Rev B Conds Matter. 1985;31:2643–2648. doi: 10.1103/physrevb.31.2643. [DOI] [PubMed] [Google Scholar]
- 61.Essmann U, Perera L, Berkowitz ML, Darden T, Lee H, Pedersen LG. A smooth particle mesh Ewald method. The Journal of chemical physics. 1995;103(19):8577–8593. [Google Scholar]
- 62.Pettit BM, Makarov VA, Andrews BK. Protein hydration density: theory simulations and crystallography. Curr Opin Struct Biol. 1998;8:218–221. doi: 10.1016/s0959-440x(98)80042-0. [DOI] [PubMed] [Google Scholar]
- 63.Bizzarri AR, Cannistraro S. Molecular Dynamics of Water at the Protein–Solvent Interface. J Phys Chem B. 2002;106:6617–6633. [Google Scholar]
- 64.Cappel D, Wahlstrom R, Brenk R, Sotriffer CA. Probing the dynamic nature of water molecules and their influences on ligand binding in a model binding site. J Chem Inf Model. 2011;51(10):2581–2594. doi: 10.1021/ci200052j. [DOI] [PubMed] [Google Scholar]
- 65.van Dijk AD, Bonvin AM. Solvated docking: introducing water into the modelling of biomolecular complexes. Bioinformatics. 2006;22(19):2340–2347. doi: 10.1093/bioinformatics/btl395. [DOI] [PubMed] [Google Scholar]
Associated Data
This section collects any data citations, data availability statements, or supplementary materials included in this article.