

Abstract
Purpose
Epithelial ovarian tumors (EOTs) are amongst the most lethal of malignancies in women. We have previously identified ZIC2 as expressed at a higher level in samples of a malignant form (MAL) of EOT than in samples of a form with low malignant potential (LMP). We have now investigated the role of ZIC2 in driving tumor growth and its association with clinical outcomes.
Experimental Design
ZIC2 expression levels were analysed in two independent tumor tissue collections of LMP and MAL. In vitro experiments aimed to test the role of ZIC2 as a transforming gene. Cox models were used to correlate ZIC2 expression with clinical endpoints.
Results
ZIC2 expression was about 40-fold in terms of mRNA and about 17-fold in terms of protein in MAL (n = 193) versus LMP (n = 39) tumors. ZIC2 mRNA levels were high in MAL cell lines, but undetectable in LMP cell lines. Over-expression of ZIC2 was localized to the nucleus. ZIC2 over-expression increases the growth rate and foci formation of NIH 3T3 cells, and stimulates anchorage-independent colony formation; down-regulation of ZIC2 decreases the growth rate of MAL cell lines. Zinc finger domains 1 and 2 are required for transforming activity. In stage I MAL ZIC2 expression was significantly associated with overall survival in both univariate (p = 0.046), and multivariate model (p = 0.049).
Conclusions
ZIC2, a transcription factor related to the sonic hedgehog pathway, is a strong discriminant between MAL and LMP tumors: it may be a major determinant of outcome of EOT.
Keywords: Epithelial ovarian tumors, low malignant potential, ZIC2, oncogenes, sonic hedgehog
Introduction
Ovarian cancer is the gynecological malignancy with the highest mortality (1): it comprises several types of tumors with different pathological and clinical features (2, 3). Not surprisingly, karyotypic and molecular lesions reported in these tumors are also heterogeneous (4, 5) and to some extent they correlate with histological types and grading (4, 6, 7). The majority of malignant ovarian tumors are of epithelial origin (EOT), and the majority of these are aggressive, with a tendency to metastasize in the peritoneal cavity and elsewhere: for brevity we will refer to them as MAL. On the other hand, it has been recognized for a long time that some 10–20% of EOTs are confined to the ovaries at the time of diagnosis, grow more slowly and have little tendency to metastasize (8): these have been designated as borderline tumors, or tumors with low malignant potential (LMP). In recent years it has been abundantly confirmed that LMP tumors have a much better prognosis than MAL tumors (9).
At the time this work was initiated, gene expression profiling was used extensively in comparing a variety of tumors with ‘normal counterpart’ tissue (10): however, many of the differences observed were related essentially to differences in growth rate. In the case of ovarian cancer we thought that a more promising approach than comparing MAL with normal ovarian epithelium would be comparing MAL with LMP, because this comparison might bring to the fore selectively those differences that confer to MAL tumors the invasive character that LMP tumors lack. In a study that was recorded in a doctoral thesis (11) a quantitative profile study revealed 61 genes with significantly higher expression in MAL versus LMP. One of the highest-ranking was ZIC2, which belongs to a family of five genes originally defined by their homology to the drosophila genes odd-paired, that encode zinc-finger transcription factors. The ZIC genes play a major role in embryonic development, particularly in the establishment of left–right asymmetry and in the development of the central nervous system (12). In both mice and humans heterozygous deletions or other mutations of the ZIC2 gene result in severe brain malformation (13). We focused on ZIC2 because other transcription factors important in development are known to play a major role in oncogenesis. In the normal adult ZIC2 mRNA has been found only in brain and testis, but it is now known that ZIC2 is also expressed in a high proportion of several types of tumors (14, 15), including endometrial cancer (16).
In this paper we report that the over-expression of ZIC2 in MAL compared to LMP tumors has been confirmed independently in two large sets of archival material: in fact the mean ratio in expression level is greater than 30-fold. At the same time, we show by in vitro studies that ZIC2, when over-expressed, behaves as a transforming oncogene; and that the level of over-expression of ZIC2 correlates with clinical outcome in patients with MAL.
Materials and Methods
Cell lines
The HOSE cell lines (gift of J. Boyd), the LMP cell line ML46 (gift of L. Dubeau) and all the other ovarian cancer cell lines analyzed (Ovcar-8, Igrov, Skov-3, A2780, Ovcar-432, Ovcar-420, Ovcar-433, Ovcar-5, Caov-2, Ovcar-3), were routinely cultured in dedicated fresh medium with fetal calf serum at 37°C in a 5% CO2 incubator. The SBOT 3.1 cells (gift of Dr. Auersperg) were grown as reported (17).
Tumor sample collection
A total of 232 samples of EOT, staged according to the International Federation of Gynaecological and Obstetrics criteria (FIGO) (18) as obtained from two separate tumor tissue collections:
A total of 170 biopsies were part of 1300 samples stored in a frozen tissue bank collection between September 1992 and March 2005 and available at Department of Oncology, “Mario Negri” Institute, Milano, Italy. Tumor tissue was collected from patients undergoing surgery for EOC at the Obstetrics and Gynecology Dept., San Gerardo Hospital (Monza, Italy), as described (19).
A total of 62 biopsies were part of 600 samples stored in a frozen tissue bank collection between January 1992 and December 2005 and available at Department of Gynaecology-Oncology, “S. Anna”, University of Torino.
Samples were collected in the operating theatre from patients undergoing cytoreductive surgery, frozen within 15 min in liquid nitrogen and stored at −80°C. The tumor content of the specimens was assessed by H&E stain in the pathology Units. Only specimens containing >70% of tumor were used. Patients’ clinical and anatomo-pathological information were registered. Histology, grade, and stage of each tumor are listed in Supplementary Table I. The collection and use of tumor samples was approved by the local scientific ethical committees and written informed consent was obtained from the patients.
Real-time qRT-PCR and data analysis
Total RNA was purified using RNAeasyTM Plus Mini Kit according to manufacturer’s instructions (Qiagen, Milan, Italy). Absolute copy numbers were determined by quantitative real-time RT–PCR (qRT-PCR) (ABI-7900, Applied Biosystems) with Syber Green protocol (Qiagen, Milan Italy) using methods and protocols previously standardized (20). Primer pair sequences are reported in Supplementary Table II. Statistical analysis was carried out using the R 2.1.0 software as described (20). For gene expression experiments, statistical comparisons between median values were performed using Wilcoxon t test. Differences were considered statistically significant with a two sided p <0.05. Data are presented as median with inter-quartile range (IQ range, 25%–75% quartile). All tests and data plots were done using GraphPad Prism Version 5.01 (GraphPad Software, La Jolla, CA).
Western blot analysis
Total proteins were isolated through standard methods, separated through 10% SDS polyacrylamide gel electrophoresis (SDS-PAGE) and electro-transferred to nitrocellulose filters. For cytoplasmic and nuclear fractions, whole cells were prepared in buffer A (10 mM Hepes pH 7.9, 10 mM KCl, 0.1 mM EDTA, 0.1 mM EGTA, 1 mM DTT, 0.5 mM PMSF) containing protease inihibitors (Roche). Nuclear extracts were obtained using Buffer C (20 mM Hepes pH 7.9, 0.4 M NaCl, 1 mM EDTA, 1 mM EGTA, 1 mM DTT, 0.5 mM PMSF).
Immuno-blotting was carried out with ZIC2 monoclonal antibodies (Zymed, South San Francisco, CA); GAPDH (Abcam, Cambridge FL), laminin (B-2, Santa Cruz Biothecnology, Palo Alto CA,) or beta actin were used as loading controls (sc-130656, Santa Cruz). H2B (N-20, Santa Cruz Biothecnology) was used for loading control of nuclear fraction only. Antibody binding was revealed by peroxidase labeled secondary antibodies and visualized using enhanced chemioluminescence (Amersham, Piscataway, NJ).
ZIC2 constructs
The human full length ZIC2 cDNA sequence was provided by A. Gure (Ludwig Institute, New York Presbyterian Medical Center) and cloned into the pWZL/hygromycin retroviral vector or into the lentiviral pLENTN5/6 vector (Invitrogen, Carlsbad, California). The Phoenix packaging cell line was transfected with the pWZLZIC2 construct and vector alone. The 293 packaging cell line (Invitrogen) was transfected with pLENTIZIC2 construct and the control construct pLENTI+LACZ (Invitrogen). Lipofectamine 2000 (Invitrogen) was utilized for all transfection experiments. After 48 hours, supernatants of packaging cell lines were collected and applied onto NlH3T3 cell monolayers, along with 5 mg/ml polybrene (Sigma-Aldrich, St Louis, MO). Pools of stably transfected cells were isolated through selection with the appropriate antibiotic and ZIC2 protein over-expression was confirmed with ZIC2 immunoblots. Cells were plated in triplicate in 6 well plates and viable cells were counted every 48 hours by trypan blue exclusion. Average counts were recorded in order to assay the DNA synthesis NIH 3T3 cells were pulsed with FITC-BrdU (Clontech, Mountain View, CA) for 1 hour and harvested. Biparametric BrdU/DNA flow cytometric analysis was performed on at least 20.000 cells by using FACS Calibur instrument (Becton Dickinson) and analyzed by Cell Quest software.
ZIC2 siRNA
Three siRNA oligonuc1eotides (Supplementary Table II), targeted to the ZIC2 mRNA (Qiagen) were utilized along with control scrambled oligonucleotide. Ovcar 8 and Caov2 cells were transfected with these four oligonucleotides utilizing Oligofectamine (Qiagen). Cells were plated in triplicate in 6 well plates at a density of 2.5 × 10⁵ cells, transfected with 1.6 micrograms of scrambled RNA or a siRNA, and counted with trypan blue exclusion at 24-hour intervals. The average of 3 wells was recorded.
Transformation assay
For Foci assays, mouse embryo fibroblasts (MEF) were mixed at a density of 1 × 10⁵ cells per 35 mm plate, along with pools of 1 × 10³ cells stably transfected with either: pLENTI-LACZ, pLENTI -ZIC2, or pBABE rasV12. Cells were grown for 21 days at 37°C in a 5% CO2 incubator. Foci were visualized by Giemsa staining. For assays of anchorage independent growth, 35 mm plastic dishes were first coated with an underlayer of DMEM + 10% FCS containing 0.5% agar. Cells from pools of the stably transfected cell lines pLENTI-LACZ, pLENTI-ZIC2, pBABE rasV12 were suspended in DMEM + 10% FCS containing 0.35% agar, and plated on the bottom layer of agar at a density of either 1×10⁴ cells or 1×10³ cells per 35 mm dish, After growth for 14 days at 37 °C in 5% CO2, colonies were visualized either by bright field microscopy, or after staining with crystal violet.
Statistical Analysis
Tumor tissue collection A and B were analyzed separately. Categorical variables were statistically described using absolute and relative frequencies; continuous variables were statistically described using median as measure of central tendency and range or interquartile range (IQR) as measure of dispersion. We assessed the statistical association between clinical and histopathological characteristics and ZIC2 expression with non parametric tests building univariate linear regression model and reporting T-test value and p-value (after checking for normality); whether more than one clinical features resulted statistically associated with gene expression multivariable model were built. Correlations between ZIC2 value and known prognostic variables (sub-stage, grading, histology) were described with relative and absolute frequencies and analyzed with the χ2 test for association or trend. (21).
Prognosis was evaluated using the following time-to-event endpoints: overall survival (OS) was defined as the time from diagnosis to death from any cause; progression-free survival (PFS) was defined as the time from diagnosis to tumor progression or death from any cause; survivor function were estimated using the Kaplan-Meier method; the log-rank test was used to assess the statistical differences in survival among compared groups; the Contal and O’Quigley method was used to categorize patients into high or low risk groups for OS, and PFS endpoints based on the ZIC2 expression level and to assess the statistical significance of the cutpoint identified (21); the Cox proportional hazards model was used to estimate Hazard Ratio (HR). All tests were two-sided and a p-value < 0.05 was considered statistically significant. Statistical analysis was performed using SAS software (version 9.1; SAS Institute, Inc, Cary NC).
Results
ZIC2 is over-expressed in MAL versus LMP ovarian tumors and cell lines
Gene expression profiling was originally carried out on Research Genetics GeneFilters by hybridizing tumor cDNA to 31,203 genes and expression sequence tags. From pairwise comparison of three MAL and three LMP tumors it was shown that gene expression profiles were significantly more similar within the MAL set and within the LMP set than when the two sets were compared (10, 22). Among 61 genes with higher expression in MAL versus LMP, ZIC2 stood out on grounds of its biological role, and its over-expression in MAL was confirmed by testing 10 additional samples (22).
We next proceeded to validate these preliminary data on large tumor tissue collections, and this was done on two separate sets of tumors (Fig. 1): collection A consisted of 170 tumors and collection B consisted of 62 tumors (23). The clinical and histopathological features of these two sets of tumors are reported in Supplementary Table I.
Figure 1. Schematic workflow.
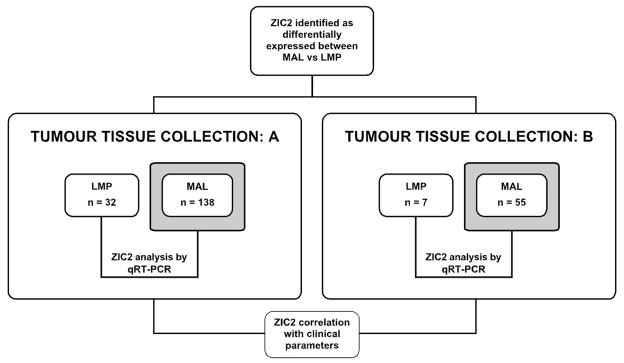
The difference in ZIC2 expression levels between MAL and LMP EOT, originally discovered by GEP analysis on a small sample of tumors (see text), was validated in a seprarate lab in two distinct tumor tissue collections: A and B. ZIC2 expression was measured by qRT-PCR; the figures were then correlated with pathology and with clinical variables, including OS and PFS.
Levels of ZIC2 mRNA measured by qRT-PCR were markedly different in LMP and in MAL samples (Fig. 2 and Supplementary Table III). Indeed, the median value of ZIC2 mRNA was 36.5 times higher in MAL tumors than in LMP tumors in set A (p<0.001), and 41.7 times higher in set B (p=0.008). In set A we were able to stratify patients according to their FIGO stage; we found that ZIC2 over-expression was 13.8 higher in stage III tumors than in stage I tumors ((p<0.001, Fig. 2 and Supplementary Table III). Western Blot analysis, performed in a subset of 32 MAL and 18 LMP tumors, revealed that ZIC2 protein levels were again much higher (about 17-fold) in MAL than in LMP tumors (Fig. 2E, F; and Supplementary table III), mirroring what we have found at the mRNA level. In 6 MAL and 2 LMP tumors we carried out immuno-blot analysis on nuclear and cytoplasmic fractions separately: we found that whenever ZIC2 is expressed the localization of the protein is strictly nuclear (see Fig. 2G).
Figure 2. Analysis of the quantitative expression of ZIC2 in primary tumors and in cell lines.


A, B: Box plot diagrams showing the expression levels of ZIC-2 measured by qRT-PCR in tumors of collection A and in tumors of collection B. Within each box the horizontal line indicates the median. The top edge of the boxes represents the 75th percentile, the bottom edge the 25th percentile (note that the scale on the ordinate is a log scale). The range is shown as a vertical line ending above and below the 75th and 25th percentile values, respectively. C: Tumor samples from collection A divided by clinical stages: there is a significant difference between stage I and stage III tumors. D; ZIC2 expression levels in 14 cell lines: 10 originating from MAL tumors, 2 from LMP tumors (Sbot3.1 and ML46) and two from normal ovarian epithelial cells (HOSE 1 and HOSE 2). Below the bar diagram, the original agarose gel electrophoresis picture is shown. Cyclophilin A (Cyc-A) was used as a housekeeping gene internal control. E: ZIC2 protein analysis by Western Blot on whole cell extracts (40 μg of protein) of a subset of 18 LMP and 32 MAL tumors. F: Box plot diagrams showing the expression levels of ZIC-2 protein measured by densitometry on Western blots analysis in the samples of panel E. In panels A, B, C, F asterisks define the level of significance according to the Mann-Whitney t test: ** for < 0.01; *** for < 0.001.G: The intracellular distribution of ZIC2 was determined by immuno-blot analysis of equivalent amounts of nuclear (N) and cytoplasmic (C) fractions (see Materials and Methods). The enrichment in nuclear fraction was confirmed by immuno-blotting with an antiserum against the nuclear protein histone H2B; β-actin was used instead as a loading control since it is present in both the nucleus and the cytoplasm.
In cell lines from normal ovarian epithelium (HOSE 1, HOSE 2) ZIC2 mRNA was undetectable (Fig. 2C and D). In contrast, ZIC2 is expressed in all of a panel of 10 cell lines that have been established from MAL ovarian cancers: the level of expression is greatly variable over a span of several logs, with Skov-3 having the highest level and A2780 the lowest level; Igrov, Ovar-8, Ovcar-5 and Caov-2 were intermediate. (Fig. 2C and D). Interestingly in the cell lines SBOT3.1 and ML46, to our knowledge the only two cell lines established from LMP tumors, ZIC2 mRNA was undetectable (Fig. 2). These data mirror those obtained in our tumor collections, and they support the notion that ZIC2 may be highly relevant to the biology of EOT, since its pattern of expression appears to be preserved in the transition from primary tumors to cell lines. We don’t yet know the mechanism underlying ZIC2 over-expression in MAL tumors and in cell lines derived from these tumors. In 10 tumor samples we have tested there was no correlation between ZIC2 mRNA levels and the methylation of C residues within the ZIC2 promoter region (data not shown). Overall, these data fully confirm, in two independent tumor tissue collections, the initial evidence that ZIC-2 over-expression discriminates strongly between MAL and LMP tumors.
Over-expression of the ZIC2 protein causes increased proliferation of NIH3T3 cells
In order to define whether ZIC2 over-expression in MAL tumors is an agent of malignant transformation, we proceeded to test this directly in a standard assay system. NIH3T3 mouse fibroblasts were transduced with lentiviral vectors containing the human ZIC2 cDNA; as control we used a vector containing the lacZ gene. After 2 to 3 passages ZIC2 -transduced cells over-expressed ZIC2 and had a higher proliferation rate than control cells (Supplementary Figure 1A): after 6 days the number of cells was more than double that in the control culture and the fraction of BrdU positive S phase cells was higher in ZIC2-transduced cells than in control cells (Supplementary Figure 1B).
Inhibition of ZIC2 decreases the growth of ovarian cancer cell lines
NIH3T3 are an assay system quite remote from EOT. In order to test more directly the impact of ZIC2 on the growth of ovarian cancer cells we selected two of the cell lines in which ZIC2 had intermediate expression (Ovcar-8 and CAOV-2). Three duplex 21-mer synthetic oligonucleotides (siRNA) directed against the untranslated portion of the ZIC2 mRNA were transfected into these cells; a scrambled siRNA was used as control. Based on immuno-blot analysis at 48 hours post-transfection, all three siRNA molecules (siRNAb and siRNAc more than siRNAa) effectively decreased ZIC2 protein levels in Ovcar-8 cells; correspondingly their proliferation was markedly impaired, particularly with siRNA C (Supplementary Figure 1C). Similar results were obtained with the Caov2 cell line (Supplementary Figure 1D). We infer that in both of these two different tumor cell lines ZIC2 is a major determinant of the rate of growth.
Over-expression of ZIC2 induces transformed foci and anchorage independent growth
Having determined that ZIC2-transduced cells have increased growth, whereas ZIC2 inhibition inhibits cell growth, we proceeded to test directly whether ZIC2 is a transforming gene. Mouse embryo fibroblasts (MEF) stably transfected with a ZIC2 vector or with a LACZ control vector were tested for their ability to form foci in monolayer cultures. After 2 to 3 passages there was a 6-fold increase in foci from ZIC2-transduced cells. A similar number of foci was obtained from rasV12-transduced cells (RAS), used as a positive control, although ZIC2 foci were generally smaller than RAS foci (Fig. 3, A and B). The transforming activity of ZIC2 was further tested in NIH3T3 cells in terms of the ability of ZIC2 to induce anchorage independent growth in soft agar (Fig. 3C). The number of colonies in soft agar was approximately 3-fold higher for ZIC2-transduced cells compared to our negative control (LACZ); and it was about one-half compared to the number of colonies obtained with RAS-transfected cells (Fig. 3C). Again, ZIC2 colonies were smaller than RAS colonies. The same result was obtained by plating cells at different density (data not shown). Overall, the data show that over-expression of ZIC2 produces cellular transformation in vitro.
Figure 3. Transforming activity of ZIC2 assayed by foci formation in mouse embryonic fibroblasts (MEF).

A. Representative plates after Giemsa staining of MEF stably transfected with pLenti+LAcZ (LACZ) or pLENTI+ZIC2 (ZIC2 ) plasmid; pBABE+RAS (RAS) was used as positive control. B. Quantitative data from experiments as above carried out in duplicate. C. Number of colonies formed by NHI3T3 cells stably transfected with pLenti+LAcZ (LACZ), pLENTI+ZIC2 (ZIC2 ), or pBABE+RAS (RAS). Numbers are the average of triplicate plates and the experiment has been carried out in duplicate. Bars are the +/- 1 standard deviation.
Zinc Fingers 1 and 2 are required for the transforming activity of ZIC2
The zinc fingers of ZIC2 bind DNA and are involved in the ZIC/GLI interaction (24): therefore one might surmise they are important for the transforming activity of the protein. Some of the ZIC2 mutations causing holoprosencephaly (HPE) have been identified in zinc finger domains (or disrupting them as a result of frameshifts), whereas others are in the region of ZIC2 encoding poly-alanine tracts (see OMIM 603073). Therefore we proceeded to prepare constructs with an expanded polyalanine tract (M-1), and constructs in which one or more individual zinc finger elements had been deleted, or the NLS had been disrupted (M2-M7: supplementary Figure 2A). After cloning these mutant constructs into pLENTIV5/6 and transduction into NIH3T3 cells (supplementary Figure 2B), both foci and colonies in soft agar were counted. All constructs retained transforming activity except M7, in which both zinc finger 1 and zinc finger 2 had been deleted (Supplementary Figure 2C and 2D).
Correlation of ZIC2 expression levels with parameters of clinical outcome
Since the clinical course of LMP is characteristically favorable compared to that of MAL, it is not surprising that we found a marked difference in both OS and PFS between these two group of tumors (Supplementary Figure 3). A further question is whether, within the set of MAL tumors, ZIC2 expression levels correlated with the clinical course of the disease. When we plot ZIC2 levels against time to death or time to progression, several points emerge (Fig. 4). First, there is a wide spread of ZIC2 mRNA levels in stage I patients, whereas stage III patients have very high ZIC2 levels in nearly all cases. Second, since the proportion of the serous histotype was much higher in the stage I group then in the stage III group (Supplementary Table I), we wondered whether the above difference was due to this fact: clearly it is not. However, there is a statistically significant association of ZIC2 expression with clinical histotype: within stage I, between clear cells and mucinous (p= 0.032, Supplementary Table IV); in stage III between serous and endometroid (p= 0.048: Supplementary Table IV). Third, with respect to both OS and PFS there is a clear trend: the patients with the highest levels of ZIC2 are clustered where survival time and time to progression are lowest, and this is true for both stage I and stage III patients.
Figure 4. ZIC2 expression correlates with measures of clinically important end-points.

Each symbol represents an individual patient: squares are for serous histotype, triangles for all other histotypes. Full symbols are for those patients who experienced fatal outcome or relapse; empty symbols are those who were alive and censored (or relapse-free and censored) at the times indicated. ZIC2 mRNA levels are 105 multiplied.
Next we analyzed the data in a way that lends itself to rigorous statistical analysis. We considered, in a Cox model using univariate analysis, ZIC2 mRNA absolute copy number, grading, sub-stage, histotype, chemotherapy and age at diagnosis with respect to clinical variables OS, PFS By using ZIC2 level as a continuous variable (see Material and Methods), we found that stage I patients who expressed high levels of ZIC2 had a significant lower OS than did patients with low ZIC2 expression levels (HR=1.062, 95% CI: 1.001–1.127; p = 0.046: Table IA; for PFS the difference was not statistically significant); and in stage III patients the association was not significant for either OS or PFS (Table IB). All other baseline characteristics analyzed so far as well as chemotherapy resulted associated to OS endpoint,( i.e. stage I patients with clear cells histotype and grade 3 had a worst OS than patients with other characteristics, Table IA). We next sought a statistically significant cutoff point that would maximally discriminate prognosis (Table IC). Kaplan-Meier curves (Fig. 5) built for stage I patients show clearly that patients with ZIC2 expression levels higher that 55 had a shorter OS and PFS than patients with levels lower than 55: these differences were statistically significant (p=0.014 for OS, p= 0.01 for PFS, Table IC). Specifically, this analysis shows an OS at 5 years of 96% versus 75% for patients with ZIC2 expression levels higher and lower that 55, respectively (Fig. 5). A multivariate Cox proportional hazards model was fitted to test the effect of ZIC2 expression levels on survival, taking into account the effect of the previously analyzed demographic characteristics and clinical features. In stage I cohort of patients from tumor tissue collection A, ZIC2 maintained its significance as an independent prognostic factor for OS but not for PFS (p=0.049, Table IA).
Table I. HR estimates for ZIC2 expression levels.
Cox proportional hazards regression analysis of OS, PFS in univariate and multivariate analysis in tumor tissue collection A. Analysis performed in continuum, in stage I patients (A), or in stage III patients (B). C. ZIC2 expression levels were dichotomized (see Materials and Methods), with a cutoff set at 55 for stage I tumors, and at 147 for stage III tumors. p values are log rank test. CI, confidential interval HR is estimated for each 10−2 ZIC2 units increase. Cut-point values are 10−3 multiplied.
| A | ||||||||||
|---|---|---|---|---|---|---|---|---|---|---|
| Tumor Tissue Collection A | ||||||||||
| Stage I | ||||||||||
| Univariate analysis | Multivariate Analysis* | |||||||||
| Endpoint | Variable | Value | HR | 95% CI | χ2 | p | HR | 95% CI | χ2 | p |
| OS | ZIC2* | - | 1.062 | 1.001–1.127 | 3.969 | 0.046 | 1.065 | 1.001–1.133 | 3.884 | 0.049 |
| Age (years) | - | 1.061 | 1.016–1.109 | 7.132 | 0.008 | 1.060 | 1.007–1.116 | 4.887 | 0.027 | |
| Grading | 1,2 | 1 | - | 4.882 | 0.027 | 1 | . | 1.403 | 0.236 | |
| 3 | 3.025 | 1.133–8.073 | 2.074 | 0.620–6.935 | ||||||
| Histotype | Clear cell | 1 | - | 5.079 | 0.024 | 1 | . | 0.442 | 0.506 | |
| Not clear cell | 0.323 | 0.121–0.863 | 0.672 | 0.208–2.171 | ||||||
| Chemotherapy | No | 1 | - | 4.459 | 0.035 | 1 | - | 3.021 | 0.082 | |
| Yes | 8.797 | 1.169–66.193 | 6.114 | 0.794–47.098 | ||||||
| PFS | ZIC2* | - | 1.043 | 0.984–1.106 | 1.978 | 0.160 | 1.036 | 0.976–1.099 | 1.322 | 0.250 |
| Age (years) | - | 1.045 | 1.010–1.081 | 6.559 | 0.010 | 1.046 | 1.005–1.088 | 4.837 | 0.028 | |
| Grading | 1,2 | 1 | - | 5.152 | 0.023 | 1 | - | 1.653 | 0.199 | |
| 3 | 2.506 | 1.134–5.541 | 1.850 | 0.724–4.726 | ||||||
| Histotype | Clear cell | 1 | - | 1.742 | 0.187 | 1 | - | 0.113 | 0.737 | |
| Not clear cell | 0.539 | 0.215–1.350 | 1.201 | 0.412–3.501 | ||||||
| Chemotherapy | No | 1 | - | 6.983 | 0.008 | 1 | - | 5.711 | 0.017 | |
| Yes | 14.894 | 2.009–110.409 | 11.711 | 1.557–88.116 | ||||||
| B | ||||||||||
|---|---|---|---|---|---|---|---|---|---|---|
| Tumor Tissue Collection A | ||||||||||
| Stage III | ||||||||||
| Univariate analysis | Multivariate Analysis* | |||||||||
| Endpoint | Variable | Value | HR | 95% CI | χ2 | p | HR | 95% CI | χ2 | p |
| OS | ZIC2* | - | 1.071 | 0.896–1.280 | 0.565 | 0.452 | 1.014 | 0.823–1.250 | 0.017 | 0.897 |
| Age (years) | - | 1.061 | 1.019–1.105 | 8.208 | 0.004 | 1.062 | 1.017–1.109 | 7.459 | 0.006 | |
| Grading | 1,2 | 1 | - | 1.430 | 0.232 | 1 | - | 0.453 | 0.501 | |
| 3 | 1.896 | 0.664–5.413 | 1.452 | 0.491–4.296 | ||||||
| Histotype | Serous | 1 | - | 1.087 | 0.297 | 1 | - | 0.057 | 0.812 | |
| Not serous | 0.640 | 0.277–1.481 | 1.115 | 0.455–2.729 | ||||||
| PFS | ZIC2* | - | 0.974 | 0.806–1.178 | 0.073 | 0.787 | 0.899 | 0.721–1.120 | 0.900 | 0.343 |
| Age (years) | - | 1.043 | 1.003–1.084 | 4.437 | 0.035 | 1.042 | 1.001–1.086 | 3.865 | 0.049 | |
| Grading | 1,2 | 1 | - | 2.230 | 0.135 | 1 | - | 1.273 | 0.259 | |
| 3 | 2.213 | 0.780–6.276 | 1.865 | 0.632–5.508 | ||||||
| Histotype | Serous | 1 | - | 2.192 | 0.139 | 1 | - | 0.389 | 0.533 | |
| Not serous | 0.535 | 0.233–1.225 | 0.754 | 0.310–1.832 | ||||||
| C | ||||||||||
|---|---|---|---|---|---|---|---|---|---|---|
| Endpoint | Tumor Tissue Collection A | |||||||||
| “Stage I” | “Stage III” | |||||||||
| Cut-point | HR | 95% CI | Chi2 | p | Cut-point # | HR | 95% CI | Chi2 | p | |
| OS | 55 | 3.642 | 1.298–10.223 | 6.028 | 0.014 | 147 | 3.084 | 0.939–10.129 | 3.447 | 0.063 |
| PFS | 55 | 3.277 | 1.334–8.046 | 6.706 | 0.010 | 147 | 1.612 | 0.668–3.887 | 1.129 | 0.288 |
Figure 5. Correlations between ZIC2 expression and measures of clinical outcome are statistically validated.

Kaplan–Meier curves of OS, PFS for all MAL tumors in collection A (left, stage I; right, stage III). Samples were divided into two clusters based on ZIC2 expression levels measured by qRT-PCR, as detailed in the Methods section. p values are log rank test.
Discussion
Gene expression profiling reveals ZIC2 over-expression as a discriminant between MAL versus LMP ovarian tumors
GEP has been used extensively to investigate differences between tumor cells and their putative cell of origin (25, 26). In general these differences are so many that it proves difficult to pinpoint which ones may be important in oncogenesis. In the case of EOT, however, we can take advantage of a rather unique situation, whereby the MAL and LMP tumors, though similar in histopathology and in other respects, have remarkably different clinical behavior, as their respective designations indicate (27). When our work started (10) there were no data on GEP studies in EOTs; since then, three studies have specifically addressed the comparison of MAL and LMP tumors (28, 29). Gilks et al (30) reported that several genes expressed in MAL tumors and regarded as important in ovarian carcinogenesis were, somewhat paradoxically, even more highly expressed in LMP tumors. Meinhold-Herlein et al. (31) observed that, overall, the GEP of LMP tumors was significantly different from that of MAL tumors of high histological grading (G2 or G3); but virtually undistinguishable from that of grade G1 MAL tumors. Marchini et al (19) confirmed the latter finding: at the same time, it was shown that, within MAL tumors, the different histological types clustered separately from each other. In this study we found that, within the MAL group and within the LMP group gene expression profiles were more consistent than between the two groups; and genes with markedly different expression were relatively few (22). The over-expression of ZIC2 in MAL versus LMP was originally uncovered through an analysis of just 3 pairs of tumors but, remarkably, it was fully validated in two separate much larger sets of tumors (232 in total) in a different laboratory, and the extent of over-expression proved impressive (see Fig. 2A–C). One might assume that increased ZIC2 mRNA will likely entail an increase in ZIC2 protein: and this is indeed the case (see Fig 2F).. This result was further strengthened by our findings on cell lines. Although these do not necessarily retain all the characteristics of primary tumors we observed that, strikingly, the two cell lines originating from LMP tumors were the only ones (along with the ovarian epithelium non-tumor cell lines), in which ZIC2 mRNA was altogether undetectable, in spite of the high sensitivity of the RT-PCR technique we used. These findings are consistent with the notion that ZIC2 over-expression may be a crucial determinant of the malignancy of ovarian cancer.
The ZIC gene family
ZIC2 is now known to be over-expressed in several cases of brain tumors (14, 15, 32) and in other tumors (16); and it has been noted recently in a GEP study of oral cancer (33). Interestingly, antibodies against the ZIC2 protein have been demonstrated in five out of 17 patients with small cell lung cancer. Members of the ZIC family of zinc finger transcription factors play a major role in early embryonic development. Although the five ZIC genes are highly homologous, they must fulfill different roles, since spontaneous mutations in humans and targeted inactivation of individual ZIC genes in mice give distinct pathologies. For instance, ZIC1 inactivation causes abnormalities of the cerebellum and of the axial skeleton (34). ZIC2 mutations cause HPE, a congenital malformation of the forebrain due to a transient defect in the organizer region during a stage of development as early as gastrulation: indeed, ZIC2 is expressed already in pluripotent cells in the blastocyst (35). ZIC3 mutations affect left-right asymmetry and can cause congenital heart abnormalities (36). ZIC proteins have significant sequence homology to GLI proteins, transcription factors that are crucial downstream effectors of the sonic hedgehog (SHH) pathway. There is evidence that this pathway may be up-regulated in ovarian cancer compared to the ovarian epithelium (37). The relationship between the ZIC set and the GLI set of proteins is remarkable because the DNA element to which they bind are almost identical (38). In addition, GLI1, GLI2 and GLI3 interact with ZIC1, ZIC2 and ZIC3; specifically, zinc fingers 3–5 of ZIC1 have been shown to bind to zinc fingers 3–5 of GLI1 (39). At the functional level, ZIC proteins can act either as co-activators or as repressors of GLI-mediated trans-activation, and this modulating action depends on cell types (38). Such cell-specific differences may be mediated by interactions with DNA-PK, KU70/80 and PARP proteins (40). Mutations in genes involved in early embryonic development have been well characterized in the case of leukemia: for instance, the HOX and RUNT genes (41). In a very broad sense, it is not surprising that transcription factors with features of master genes, when expressed out of context, can cause uncontrolled cell growth.
Over-expressed ZIC2 behaves as an oncogene
By using classic transformation assays – formation of foci and growth of colonies in soft agar – we found that ZIC2 over-expression is oncogenic-like; conversely, ZIC2 inhibition by siRNAs inhibits proliferation of ovarian cancer cell lines. Thus, expression studies and functional studies converge in suggesting that ZIC2 may play a major role in determining the aggressive behavior of ovarian cancer. That the mechanism of action of ZIC2 in causing invasive growth is mediated by its transcriptional function is corroborated by our finding that transforming activity is abolished by deletion of zinc fingers 1 and 2. However, at the moment we don’t know what causes ZIC2 over-expression. Since it has been shown that in neural progenitor cells p53 inhibits the transcriptional activity of GLI1-GLI2, and conversely loss of p53 activates GLI1 (42), we wondered whether a similar circuit might be relevant to ZIC2 over-expression in EOTs. Out of 45 stage III tumors that were tested, 27 (60%) had p53 mutations (20): there was no significant difference in the distribution of ZIC2 levels between these tumors and the 18 in which no p53 mutation was found. From these data it would appear that the main mechanism of ZIC2 over-expression may be p53-independent; and this has been observed also with respect to regulation of Nanog by GLI1-GLI2 (43), and with respect to regulation of GLI in melanoma cells (Stecca, personal communication). In zebrafish, ZIC2 is regulated by FOXD5 (44). Considering the close relationship between ZIC and GLI genes, it is tempting to surmise that ZIC2 may act through the SHH pathway, because much evidence suggests that in some adult tissues this pathway controls growth and tissue patterning by regulating the stem-cell compartment (24). Recent work by Chan et al. strongly supports this notion: they have shown that in cervical cancer cells over-expressed ZIC2 causes nuclear retention of GLI1 and thus enhances SHH signaling (45).
That the SHH pathway is disturbed in a variety of tumors [particularly in basal cell carcinoma (BCC) (46), but also in melanoma (47) and in pancreatic cancer (48)], is well established. Indeed, somatic mutations of PATCH1, the gene encoding the SHH receptor, and of Smoothened, a protein normally controlled by PATCH1, are highly prevalent in BCC; whereas inherited PATCH1 mutations are responsible for the nevoid basal cell carcinoma, or Gorlin syndrome (46); and in view of the fact that medulloblastoma is part of the Gorlin syndrome spectrum it is interesting that ZIC2 may be highly expressed in this tumor (32). Although the distal part of the SHH pathway is not yet elucidated in detail, there is overlap between the transcriptional targets of the GLI family and of the ZIC family.
The evidence that ZIC2 is a determinant of malignancy in ovarian cancer is not just from in vitro studies of cell lines, but from data on clinical outcomes. We have found that by all major parameters (OS, PFS,) the clinical course of patients correlates with the extent of ZIC2 over-expression. Interestingly, a similar observation has been recently reported with respect to oral squamous cell carcinoma (33).
Conclusion
From this work ZIC2 expression emerges as a strong discriminant between MAL and LMP tumors. In addition, there is a significant correlation between the extent of ZIC2 over-expression and the clinical course of patients with MAL tumors. Overall, these data support the notion that ZIC2 plays a major role in the highly malignant behavior of EOT. Several avenues are being currently explored to target the SHH pathway for therapeutic purposes (24, 49), and one small molecule, vismodegib, is at an advanced pre-clinical stage of development (50). There is now a rationale for including EOT among the tumors that might respond to such molecules.
Supplementary Material
Statement of Significance.
In this manuscript we investigate the molecular basis for the remarkable difference in clinical course between the invasive form of epithelial ovarian cancer (MAL) and that of the so-called low malignant potential (LMP), or borderline tumors. By gene expression profiling we have discovered a markedly increased expression of the transcription factor ZIC2 in MAL versus LMP; and this has been validated quantitatively and statistically in two separate sets of archival material (totaling 232 tumors): the mean ZIC2 mRNA value is about 40 times higher in MAL tumors. Over-expression of ZIC2 was also documented at the protein level, and whenever ZIC2 is over-expressed it is electively localized to the nucleus. We have further shown by transformation assays and by siRNA experiments that over-expressed ZIC2 has features of an oncogene, and that this depends on the integrity of two of the zinc finger domains. We have then gone back full circle to our clinical material, and we have found that in patients with MAL tumors ZIC2 expression levels correlate significantly with early mortality in both univariate and multivariate models. ZIC2 is of special interest because it is expressed in early embryonic development and it is related to the GLI genes in the sonic hedgehog pathway: from our work it now appears that ZIC2 is also a key factor in the biology of ovarian cancer.
Acknowledgments
We are very grateful to Dr N. Auersperg, Dr. Salamanca, Dr. J. Boyd and Dr. L. Dubeau for providing us with cell lines. We thank Dr. Juan Rosai for authoritative views on ovarian cancer; Dr. Barbara Stecca and Dr. Valter Torri for helpful comments on the manuscript; Dr Diane Tabarini and Ms Ellen Bonfiglio for technical and administrative support. Financial support was received from NIH, from the “Nerina and Mario Mattioli” Foundation and from the Italian Association for Cancer Research.
Abbreviations
- BCC
basal cell carcinoma
- BrdU
bromodeossyuridine
- Cyc-A
cyclophilin A
- EOT
epithelial ovarian tumor
- FIGO
International Federation of Gynecology and Obstetrics
- GAPDH
Glyceraldehyde 3-phosphate dehydrogenase
- GEP
gene expression profile
- HPE
holoprosencephaly
- HRs
hazard ratios
- LMP
low malignant potential
- MEF
mouse embryo fibroblasts
- MAL
malignant form
- NLS
nuclear localization signal
- MSKCC
Memorial Sloan Kettering Cancer Center
- OS
overall survival
- PFS
Progression-free survival
- qRT-PCR
quantitative real-time RT–PCR
- SDS-PAGE
SDS polyacrylamide gel electrophoresis
- siRNA
small interfering RNA
Footnotes
Conflict of interest: The authors declare no conflict of interest
References
- 1.Cannistra SA. Cancer of the ovary. N Engl J Med. 2004;351:2519–29. doi: 10.1056/NEJMra041842. [DOI] [PubMed] [Google Scholar]
- 2.Kaku T, Ogawa S, Kawano Y, Ohishi Y, Kobayashi H, Hirakawa T, et al. Histological classification of ovarian cancer. Med Electron Microsc. 2003;36:9–17. doi: 10.1007/s007950300002. [DOI] [PubMed] [Google Scholar]
- 3.Vaughan S, Coward JI, Bast RC, Jr, Berchuck A, Berek JS, Brenton JD, et al. Rethinking ovarian cancer: recommendations for improving outcomes. Nat Rev Cancer. 11:719–25. doi: 10.1038/nrc3144. [DOI] [PMC free article] [PubMed] [Google Scholar]
- 4.Bast RC, Jr, Hennessy B, Mills GB. The biology of ovarian cancer: new opportunities for translation. Nature reviews. 2009;9:415–28. doi: 10.1038/nrc2644. [DOI] [PMC free article] [PubMed] [Google Scholar]
- 5.Network TCGAR. Integrated genomic analyses of ovarian carcinoma. Nature. 2011;474:609–15. doi: 10.1038/nature10166. [DOI] [PMC free article] [PubMed] [Google Scholar]
- 6.Pothuri B, Leitao MM, Levine DA, Viale A, Olshen AB, Arroyo C, et al. Genetic analysis of the early natural history of epithelial ovarian carcinoma. PloS one. 2010;5:e10358. doi: 10.1371/journal.pone.0010358. [DOI] [PMC free article] [PubMed] [Google Scholar]
- 7.Bowtell DD. The genesis and evolution of high-grade serous ovarian cancer. Nat Rev Cancer. 10:803–8. doi: 10.1038/nrc2946. [DOI] [PubMed] [Google Scholar]
- 8.Silva EG, Kurman RJ, Russell P, Scully RE. Symposium: ovarian tumors of borderline malignancy. Int J Gynecol Pathol. 1996;15:281–302. [PubMed] [Google Scholar]
- 9.Zanetta G, Rota S, Chiari S, Bonazzi C, Bratina G, Mangioni C. Behavior of borderline tumors with particular interest to persistence, recurrence, and progression to invasive carcinoma: a prospective study. Journal of clinical oncology. 2001;19:2658–64. doi: 10.1200/JCO.2001.19.10.2658. [DOI] [PubMed] [Google Scholar]
- 10.Poynor EALL, Federici MG, Boyd JA, Hoskins WJ. Use of Microarray Technology in the Investigation of the Genes Important in the Pathogenesis of Epithelial Ovarian Cancer (EOC). Gynecologic Oncology; Thirty-First Annual Meeting of the Society of Gynecologic Oncologists; 2000 2000; San Diego Mariott Hotel, San Diego, California. February 5–9, 2000; 2000. pp. 230–84. [Google Scholar]
- 11.Poynor EA. Microarray analysis of epithelial ovarian cancer. New York: Cornell University; 2005. p. 175. [Google Scholar]
- 12.Grinberg I, Millen KJ. The ZIC gene family in development and disease. Clin Genet. 2005;67:290–6. doi: 10.1111/j.1399-0004.2005.00418.x. [DOI] [PubMed] [Google Scholar]
- 13.Brown LY, Odent S, David V, Blayau M, Dubourg C, Apacik C, et al. Holoprosencephaly due to mutations in ZIC2: alanine tract expansion mutations may be caused by parental somatic recombination. Hum Mol Genet. 2001;10:791–6. doi: 10.1093/hmg/10.8.791. [DOI] [PubMed] [Google Scholar]
- 14.Michiels EM, Oussoren E, Van Groenigen M, Pauws E, Bossuyt PM, Voute PA, et al. Genes differentially expressed in medulloblastoma and fetal brain. Physiol Genomics. 1999;1:83–91. doi: 10.1152/physiolgenomics.1999.1.2.83. [DOI] [PubMed] [Google Scholar]
- 15.Yokota N, Aruga J, Takai S, Yamada K, Hamazaki M, Iwase T, et al. Predominant expression of human zic in cerebellar granule cell lineage and medulloblastoma. Cancer Res. 1996;56:377–83. [PubMed] [Google Scholar]
- 16.Bidus MA, Risinger JI, Chandramouli GV, Dainty LA, Litzi TJ, Berchuck A, et al. Prediction of lymph node metastasis in patients with endometrioid endometrial cancer using expression microarray. Clin Cancer Res. 2006;12:83–8. doi: 10.1158/1078-0432.CCR-05-0835. [DOI] [PubMed] [Google Scholar]
- 17.Woo MM, Salamanca CM, Miller M, Symowicz J, Leung PC, Oliveira C, et al. Serous borderline ovarian tumors in long-term culture: phenotypic and genotypic distinction from invasive ovarian carcinomas. Int J Gynecol Cancer. 2008;18:1234–47. doi: 10.1111/j.1525-1438.2007.01171.x. [DOI] [PubMed] [Google Scholar]
- 18.Trimbos JB, Parmar M, Vergote I, Guthrie D, Bolis G, Colombo N, et al. International Collaborative Ovarian Neoplasm trial 1 and Adjuvant ChemoTherapy In Ovarian Neoplasm trial: two parallel randomized phase III trials of adjuvant chemotherapy in patients with early-stage ovarian carcinoma. J Natl Cancer Inst. 2003;95:105–12. [PubMed] [Google Scholar]
- 19.Marchini S, Mariani P, Chiorino G, Marrazzo E, Bonomi R, Fruscio R, et al. Analysis of gene expression in early-stage ovarian cancer. Clin Cancer Res. 2008;14:7850–60. doi: 10.1158/1078-0432.CCR-08-0523. [DOI] [PubMed] [Google Scholar]
- 20.Marchini S, Marabese M, Marrazzo E, Mariani P, Cattaneo D, Fossati R, et al. DeltaNp63 expression is associated with poor survival in ovarian cancer. Ann Oncol. 2008;19:501–7. doi: 10.1093/annonc/mdm519. [DOI] [PubMed] [Google Scholar]
- 21.Williams BA, Mandrekar JN, Mandrekar SJ, Cha SS, Furth AF. Finding Optimal Cutpoints for Continuous Covariates with Binary and Time-to-Event Outcomes. Rochester, MN: Mayo Clinic; 2006. Jun, [Google Scholar]
- 22.Elizabeth A, Poynor VB, Meltzer Andrew J, Koff Andrew C, Barakat Richard R, Boyd Jeff A. ZIC2 Gene Expression in Epithelial Ovarian Cancer In: Thirty-Fourth Annual Meeting of the Society of Gynecologic. Oncologists. 2003;2003:156–261. [Google Scholar]
- 23.Marchini S, Cavalieri D, Fruscio R, Calura E, Garavaglia D, Nerini IF, et al. Association between miR-200c and the survival of patients with stage I epithelial ovarian cancer: a retrospective study of two independent tumour tissue collections. Lancet Oncol. 2011;12:273–85. doi: 10.1016/S1470-2045(11)70012-2. [DOI] [PubMed] [Google Scholar]
- 24.Ruiz i Altaba A, Sanchez P, Dahmane N. Gli and hedgehog in cancer: tumours, embryos and stem cells. Nat Rev Cancer. 2002;2:361–72. doi: 10.1038/nrc796. [DOI] [PubMed] [Google Scholar]
- 25.Konstantinopoulos PA, Spentzos D, Cannistra SA. Gene-expression profiling in epithelial ovarian cancer. Nat Clin Pract Oncol. 2008;5:577–87. doi: 10.1038/ncponc1178. [DOI] [PubMed] [Google Scholar]
- 26.Gomez-Raposo C, Mendiola M, Barriuso J, Hardisson D, Redondo A. Molecular characterization of ovarian cancer by gene-expression profiling. Gynecol Oncol. 118:88–92. doi: 10.1016/j.ygyno.2010.03.012. [DOI] [PubMed] [Google Scholar]
- 27.Hart WR. Borderline epithelial tumors of the ovary. Mod Pathol. 2005;18 (Suppl 2):S33–50. doi: 10.1038/modpathol.3800307. [DOI] [PubMed] [Google Scholar]
- 28.Sabatier R, Finetti P, Cervera N, Birnbaum D, Bertucci F. Gene expression profiling and prediction of clinical outcome in ovarian cancer. Critical reviews in oncology/hematology. 2009;72:98–109. doi: 10.1016/j.critrevonc.2009.01.007. [DOI] [PubMed] [Google Scholar]
- 29.Gomez-Raposo C, Mendiola M, Barriuso J, Hardisson D, Redondo A. Molecular characterization of ovarian cancer by gene-expression profiling. Gynecologic oncology. 2010;118:88–92. doi: 10.1016/j.ygyno.2010.03.012. [DOI] [PubMed] [Google Scholar]
- 30.Gilks CB, Vanderhyden BC, Zhu S, van de Rijn M, Longacre TA. Distinction between serous tumors of low malignant potential and serous carcinomas based on global mRNA expression profiling. Gynecol Oncol. 2005;96:684–94. doi: 10.1016/j.ygyno.2004.11.039. [DOI] [PubMed] [Google Scholar]
- 31.Meinhold-Heerlein I, Bauerschlag D, Hilpert F, Dimitrov P, Sapinoso LM, Orlowska-Volk M, et al. Molecular and prognostic distinction between serous ovarian carcinomas of varying grade and malignant potential. Oncogene. 2004;24:1053–65. doi: 10.1038/sj.onc.1208298. [DOI] [PubMed] [Google Scholar]
- 32.Aruga J, Nozaki Y, Hatayama M, Odaka YS, Yokota N. Expression of ZIC family genes in meningiomas and other brain tumors. BMC Cancer. 10:79. doi: 10.1186/1471-2407-10-79. [DOI] [PMC free article] [PubMed] [Google Scholar]
- 33.Sakuma K, Kasamatsu A, Yamatoji M, Yamano Y, Fushimi K, Iyoda M, et al. Expression status of Zic family member 2 as a prognostic marker for oral squamous cell carcinoma. J Cancer Res Clin Oncol. 2010;136:553–9. doi: 10.1007/s00432-009-0689-y. [DOI] [PMC free article] [PubMed] [Google Scholar]
- 34.Aruga J, Mizugishi K, Koseki H, Imai K, Balling R, Noda T, et al. Zic1 regulates the patterning of vertebral arches in cooperation with Gli3. Mech Dev. 1999;89:141–50. doi: 10.1016/s0925-4773(99)00220-8. [DOI] [PubMed] [Google Scholar]
- 35.Brown L, Brown S. Zic2 is expressed in pluripotent cells in the blastocyst and adult brain expression overlaps with makers of neurogenesis. Gene Expr Patterns. 2009;9:43–9. doi: 10.1016/j.gep.2008.08.002. [DOI] [PubMed] [Google Scholar]
- 36.Ware SM, Peng J, Zhu L, Fernbach S, Colicos S, Casey B, et al. Identification and functional analysis of ZIC3 mutations in heterotaxy and related congenital heart defects. Am J Hum Genet. 2004;74:93–105. doi: 10.1086/380998. [DOI] [PMC free article] [PubMed] [Google Scholar]
- 37.Bowen NJ, Walker LD, Matyunina LV, Logani S, Totten KA, Benigno BB, et al. Gene expression profiling supports the hypothesis that human ovarian surface epithelia are multipotent and capable of serving as ovarian cancer initiating cells. BMC Med Genomics. 2009;2:71. doi: 10.1186/1755-8794-2-71. [DOI] [PMC free article] [PubMed] [Google Scholar]
- 38.Mizugishi K, Aruga J, Nakata K, Mikoshiba K. Molecular properties of Zic proteins as transcriptional regulators and their relationship to GLI proteins. J Biol Chem. 2001;276:2180–8. doi: 10.1074/jbc.M004430200. [DOI] [PubMed] [Google Scholar]
- 39.Koyabu Y, Nakata K, Mizugishi K, Aruga J, Mikoshiba K. Physical and functional interactions between Zic and Gli proteins. J Biol Chem. 2001;276:6889–92. doi: 10.1074/jbc.C000773200. [DOI] [PubMed] [Google Scholar]
- 40.Ishiguro A, Ideta M, Mikoshiba K, Chen DJ, Aruga J. ZIC2-dependent transcriptional regulation is mediated by DNA-dependent protein kinase, poly(ADP-ribose) polymerase, and RNA helicase A. J Biol Chem. 2007;282:9983–95. doi: 10.1074/jbc.M610821200. [DOI] [PubMed] [Google Scholar]
- 41.Yamagata T, Maki K, Mitani K. Runx1/AML1 in normal and abnormal hematopoiesis. Int J Hematol. 2005;82:1–8. doi: 10.1532/IJH97.05075. [DOI] [PubMed] [Google Scholar]
- 42.Stecca B, Ruiz i Altaba A. A GLI1-p53 inhibitory loop controls neural stem cell and tumour cell numbers. EMBO J. 2009;28:663–76. doi: 10.1038/emboj.2009.16. [DOI] [PMC free article] [PubMed] [Google Scholar]
- 43.Po A, Ferretti E, Miele E, De Smaele E, Paganelli A, Canettieri G, et al. Hedgehog controls neural stem cells through p53-independent regulation of Nanog. EMBO J. 2010;29:2646–58. doi: 10.1038/emboj.2010.131. [DOI] [PMC free article] [PubMed] [Google Scholar]
- 44.Yan B, Neilson KM, Moody SA. foxD5 plays a critical upstream role in regulating neural ectodermal fate and the onset of neural differentiation. Dev Biol. 2009;329:80–95. doi: 10.1016/j.ydbio.2009.02.019. [DOI] [PMC free article] [PubMed] [Google Scholar]
- 45.Chan DW, Liu VW, Leung LY, Yao KM, Chan KK, Cheung AN, et al. Zic2 synergistically enhances Hedgehog signalling through nuclear retention of Gli1 in cervical cancer cells. J Pathol. 225:525–34. doi: 10.1002/path.2901. [DOI] [PubMed] [Google Scholar]
- 46.Bale AE, Yu KP. The hedgehog pathway and basal cell carcinomas. Human molecular genetics. 2001;10:757–62. doi: 10.1093/hmg/10.7.757. [DOI] [PubMed] [Google Scholar]
- 47.Stecca B, Mas C, Clement V, Zbinden M, Correa R, Piguet V, et al. Melanomas require HEDGEHOG-GLI signaling regulated by interactions between GLI1 and the RAS-MEK/AKT pathways. Proceedings of the National Academy of Sciences. 2007;104:5895–900. doi: 10.1073/pnas.0700776104. [DOI] [PMC free article] [PubMed] [Google Scholar]
- 48.Thayer SP, di Magliano MP, Heiser PW, Nielsen CM, Roberts DJ, Lauwers GY, et al. Hedgehog is an early and late mediator of pancreatic cancer tumorigenesis. Nature. 2003;425:851–6. doi: 10.1038/nature02009. [DOI] [PMC free article] [PubMed] [Google Scholar]
- 49.Peukert S, Miller-Moslin K. Small-molecule inhibitors of the hedgehog signaling pathway as cancer therapeutics. ChemMedChem. 2010;5:500–12. doi: 10.1002/cmdc.201000011. [DOI] [PubMed] [Google Scholar]
- 50.Wong H, Alicke B, West KA, Pacheco P, La H, Januario T, et al. Pharmacokinetic-pharmacodynamic analysis of vismodegib in preclinical models of mutational and ligand-dependent Hedgehog pathway activation. Clin Cancer Res. 17:4682–92. doi: 10.1158/1078-0432.CCR-11-0975. [DOI] [PubMed] [Google Scholar]
Associated Data
This section collects any data citations, data availability statements, or supplementary materials included in this article.