Abstract
Mitochondria are multifunctional organelles whose dysfunction leads to neuromuscular degeneration and ageing. The multi-functionality poses a great challenge for understanding the mechanisms by which mitochondrial dysfunction causes specific pathologies. Among the leading mitochondrial mediators of cell death are energy depletion, free radical production, defect in iron-sulfur cluster biosynthesis, the release of pro-apoptotic and non-cell-autonomous signaling molecules, and altered stress signaling 1–5. Here, we identified a novel pathway of mitochondria-mediated cell death. This pathway was named mitochondrial Precursor Over-accumulation Stress (mPOS), characterized by aberrant accumulation of mitochondrial precursors in the cytosol. mPOS can be triggered by clinically relevant mitochondrial damage which is not limited to the core machineries of protein import. We also identified a large network of genes that suppress mPOS, by modulating ribosomal biogenesis, mRNA decapping, transcript-specific translation, protein chaperoning and turnover. In response to mPOS, several ribosome-associated proteins were up-regulated including Gis2 and Nog2, which promote cap-independent translation and inhibit the nuclear export of the 60S ribosomal subunit respectively 6, 7. Gis2 and Nog2 up-regulation promotes cell survival, which may be part of a feedback loop that attenuates mPOS. Our data indicate that mitochondrial dysfunction contributes directly to cytosolic proteostatic stress, and provide an explanation for the enigmatic association between these two hallmarks of degenerative diseases and ageing. The results are relevant to understanding diseases (e.g., spinocerebellar ataxia, amyotrophic lateral sclerosis and myotonic dystrophy) that involve mutations within the anti-degenerative network.
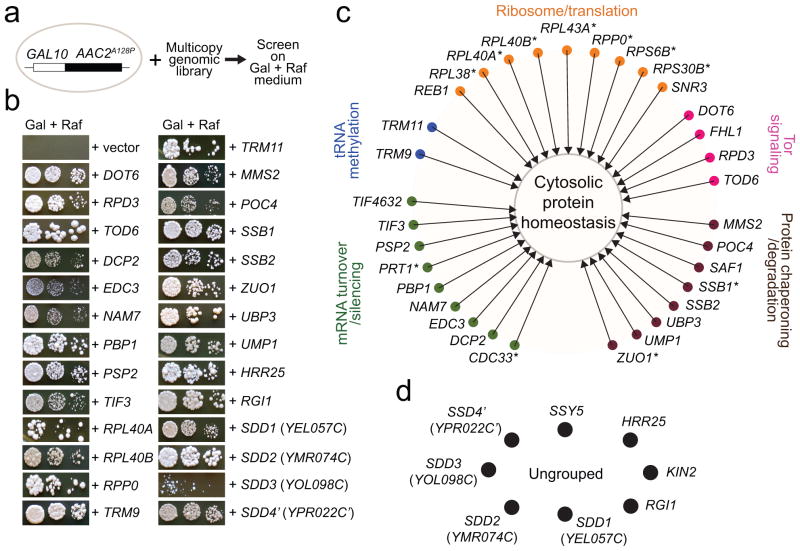
ANT1 encodes adenine nucleotide translocase involved in ATP/ADP exchange across the mitochondrial inner membrane. Mutations in the human ANT1 gene cause autosomal dominant Progressive External Ophthalmoplegia, cardiomyopathy and myopathy 8, 9. In yeast, similar mutations in the orthologous AAC2 gene cause protein misfolding, followed by severe mitochondrial damage and ageing-dependent degenerative cell death 10, 11. We used the dominant AAC2A128P allele to determine how mitochondrial damage causes cell death. We screened for multicopy suppressors that inhibit AAC2A128P-induced cell death (Fig. 1a). From 336 viable transformants, 40 genes capable of suppression were identified (Fig. 1b & Supplementary Table 1). Thirty-two of them fall into one of the five functional categories: Target of Rapamycin (TOR)-signaling, mRNA silencing/turnover, ribosomal function/protein translation, tRNA methylation, and cytosolic protein chaperoning/degradation (Fig. 1c). These anti-degenerative cell death genes belong to a functional network that controls cytosolic protein homeostasis. The remaining eight include the uncharacterized YEL057C, YMR074C, YOL098C and the truncated YPR022C that are named SDD1-4 (Suppressor of Degenerative Death) respectively (Fig. 1d).
Fig. 1. A cytosolic anti-degenerative network that suppresses mitochondria-induced cell death.
(a) Schematic of multicopy suppressor screen. (b) Suppression of AAC2A128P-induced cell death on galactose (Gal) plus raffinose (Raf) medium. (c) The anti-degenerative network that improves cytosolic protein homeostasis and cell survival in AAC2A128P-expressing cells. The symbols * and ’ denote Trm9-skewed and truncated proteins, respectively. (d) Ungrouped anti-degenerative genes.
Among the suppressors are Tod6, Dot6 and Rpd3 that repress ribosomal biogenesis in the TOR-signaling pathway 12. Dcp2 and Edc3 decap mRNAs, silence cap-dependent translation and promote mRNA degradation. Tif4632, Tif3, Cdc33 and Prt1 are translation initiation factors, with Tif4632 also being known to activate cap-independent translation 13. Pbp1 and Psp2 are constituents of P-bodies and stress granules that process and silence mRNAs under stress conditions 14. Nam7 participates in nonsense-mediated mRNA decay. Poc4 and Ump1 promote the assembly and maturation of the proteasome. Ssb1, Ssb2 and Zuo1 are ribosome-associated chaperones.
Interestingly, the suppressors include seven ribosomal proteins and two tRNA methyltransferases, suggesting a link between mitochondrial tress and cytosolic translation. Rpp0 mediates interactions between translational elongation factors and the ribosome and its over-expression cures prions 15. The Rpl40A and Rpl40B paralogs and Rpl38 promote transcript-specific translation in yeast and humans 16, 17. The Trm9 methyltransferase specifically methylates tRNAGLU(UUC) and tRNAARG(UCU), which stimulates the translation of stress-responsive proteins encoded by mRNAs enhanced in these two specific codons 18. Eleven out of the 40 suppressors are Trm9-skewed proteins (starred, Fig. 1c), suggesting that suppression by Trm9 may involve increased translation of these proteins.
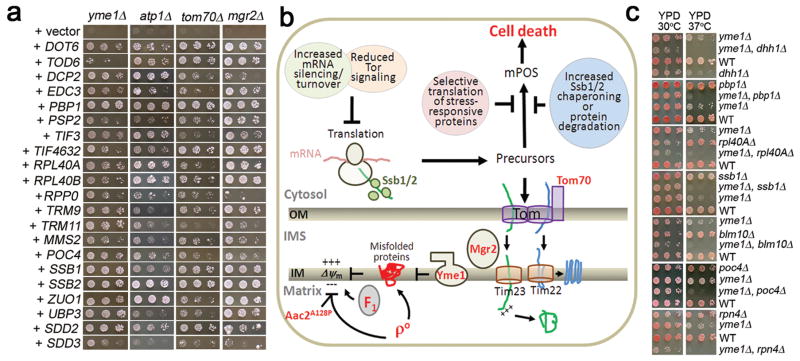
The suppressor genes also promote cell viability in mutants with diverse mitochondrial damage. Deletion of YME1 encoding the i-AAA chaperone/protease on the inner membrane 19, and ATP1 encoding the α-subunit of F1-ATPase, are lethal when mtDNA is eliminated (ρ°) by ethidium bromide. This lethality is mitigated by over-expressing the anti-degenerative genes (Extended Data Fig. 1a).
All of the suppressors are located in the cytosol, suggesting that they prevent cell death via pathways that operate in the cytosol. AAC2A128P expression and mtDNA elimination from the yme1 and atp1 mutants collapse mitochondrial membrane potential Δψm that is critical for protein import 20. We thus hypothesize that mitochondrial damage in these strains affects protein import, leading to the over-accumulation and misfolding of mitochondrial precursors in the cytosol. The resulting stress, which we term mitochondrial Precursor Over-accumulation Stress (mPOS), would then trigger cell death (Extended Data Fig. 1b). The anti-degenerative suppressor genes might reverse mPOS by reducing translation, thus decreasing stress imposed by protein over-accumulation, misfolding and aggregation. Or, they might selectively stimulate translation of stress-resistant proteins, and increase specific chaperoning activity and protein turnover.
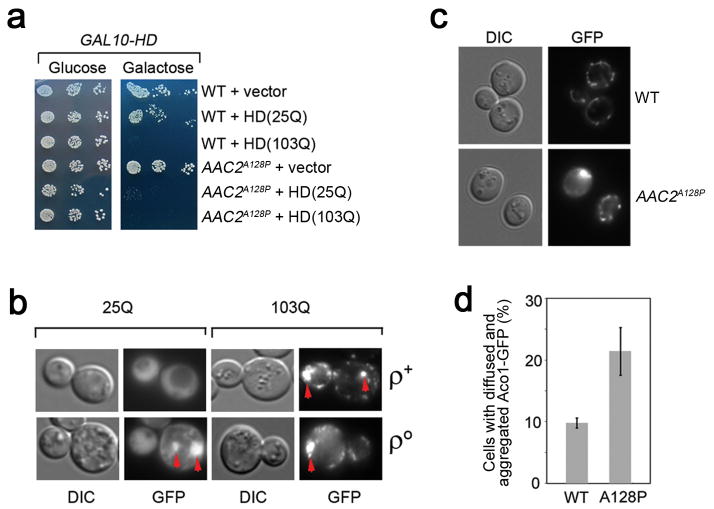
Several lines of evidence support the mPOS hypothesis. First, the anti-degenerative genes suppressed ρ°-lethality in the tom70Δ and mgr2Δ mutants that reduce protein translocation across the outer and inner mitochondrial membrane respectively (Extended Data Fig. 1a). Over-expression of mPOS suppressors PBP1 and SSB1 is known to rescue ρ°-lethality of tim18 mutants defective in the TIM22 protein translocase 21. Second, we detected synthetic growth defects between yme1Δ and disruption mutations in anti-degenerative genes including PBP1, RPL40A, SSB1 and POC4 (Extended Data Fig. 1c). This is consistent with a crosstalk between mitochondrial and cytosolic proteostatic functions. Synthetic growth defects were also observed between yme1Δ and the disruption of genes involved in cytosolic mRNA decay (DHH1) and proteasomal biogenesis (BLM10 and RPN4) (Extended Data Fig. 1c). Third, expression of the aggregation-prone human huntingtin (HD) protein with a polyglutamine track (25Q) was tolerated in the wild-type but not AAC2A128P cells (Extended Data Fig. 2a). Aggregation of HD(25Q) was frequently detected in ρ° but not in ρ+ cells (Extended Data Fig. 2b). Fourth, AAC2A128P-expression increased the accumulation and aggregation of the mitochondrial Aco1 protein in the cytosol (Extended Data Fig. 2c and 2d). Thus, mitochondrial damage aggravates protein aggregation in the cytosol.
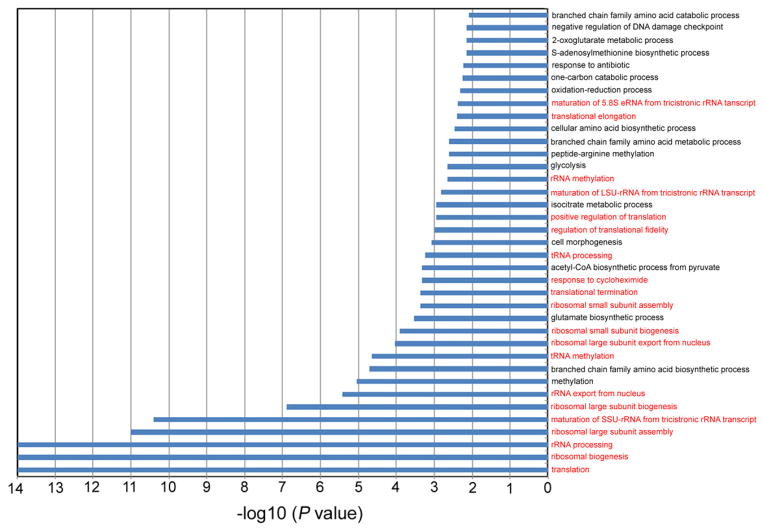
Finally, we used mass spectrometry to compare the cytosolic proteomes from the wild-type and AAC2A128P cells. The AAC2A128P mutant survives poorly at 25°C and has a significantly reduced protein synthesis rate (Extended Data Fig. 3). A total of 1,923 proteins were detected in each strain (Supplementary Table 2). AAC2A128P expression down-regulated 107 proteins by >2 fold, with the majority being metabolic enzymes (Supplementary Table 3). 297 proteins were up-regulated by >1.266 fold (P<0.05) in AAC2A128P cells (Extended Data Fig. 4).
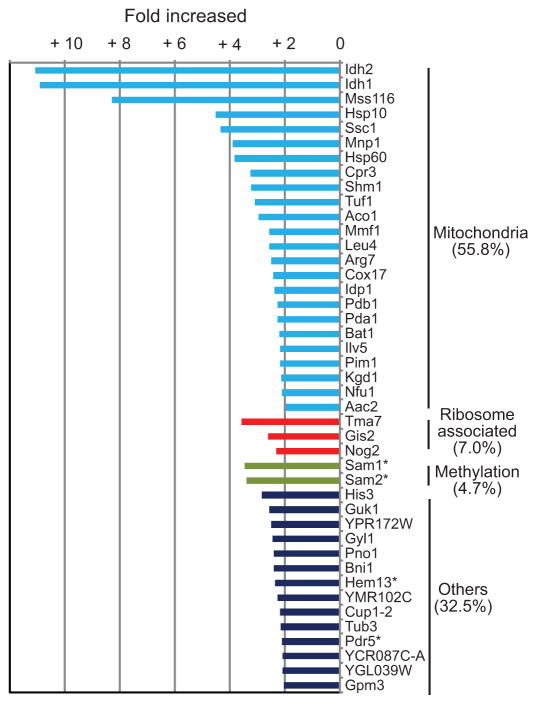
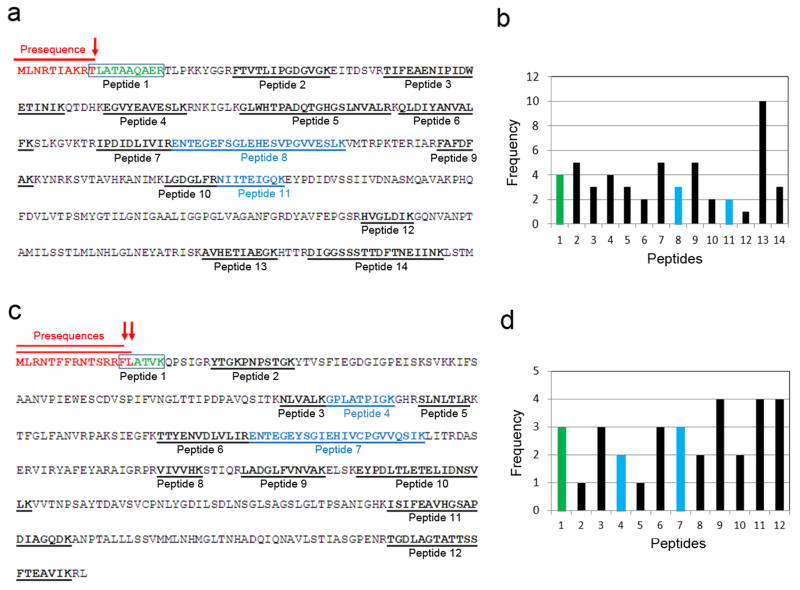
Among the 43 proteins with >2 fold up-regulation, 24 (55.8%) are nuclear-encoded mitochondrial proteins (Fig. 2 and Supplementary Table 4). The cytosolic accumulation of several proteins was confirmed by western-blot (Extended Data Fig. 5a). These proteins are unimported precursors rather than proteolytically matured proteins released from damaged mitochondria, because their presequences are detected by mass spectrometry (Extended Data Fig. 6). Together, these data reveal cytosolic accumulation of mitochondrial precursors, which we propose triggers mPOS.
Fig. 2. Comparison of cytosolic proteomes from AAC2A128P and wild-type cells.
Isobaric Tag for Relative and Absolute Quantitation mass spectrometry (iTRAQ) analysis showing 43 proteins that are upregulated by >2 fold in the cytosol of AAC2A128P cells. * denotes Trm9-skewed non-mitochondrial proteins.
Mitochondrial damage is known to abrogate heat-shock response 22. Consistent with this, we found that mPOS did not up-regulate the major heat shock-inducible Hsp70-type chaperones (e.g., Ssa1, Ssa2, Sse1 and Sse2; Extended Data Fig. 7). Up-regulation of these chaperones would likely exacerbate mPOS by promoting the folding of mitochondrial precursors, which would interfere with import and/or block cytosolic degradation. We also found that the levels of Ssb1 and Ssb2, the holdase-type Hsp70-family chaperones which cotranslationally bind to and stabilise structurally disordered and aggregation-prone nascent polypeptides 23, 24, were not induced in the AAC2A128P mutant (Extended Data Fig. 7 & Supplementary Table 2). However, 1–2 extra copies of SSB1 are sufficient to suppress the heat sensitivity of the yme1Δ mutant (Extended Data Fig. 8). These specific chaperones may maintain the unimported precursors in an unfolded state thereby preventing aggregation. In support of this, we found that the mitochondrial proteins Aco1 and Abf2 are substrates of Ssb1 in the cytosol and that their association with Ssb1 is increased in the AAC2A128P-expressing cells (Extended Data Fig. 5b).
Nineteen non-mitochondrial proteins were up-regulated by >2 fold in AAC2A128P-expressing cells (Fig. 2). We speculated that the three highly conserved ribosome-associated proteins, Gis2, Nog2 and Tma7, may be up-regulated to benefit cell viability. Indeed, over-expression of these genes is sufficient to rescue AAC2A128P-induced cell death (Fig. 3a). GIS2 over-expression also rescued ρ°-lethality of the atp1Δ, mgr2Δ and tom70Δ mutants (Extended Data Fig. 9a). Over-expression of Gis2, Nog2 and Tma7 did not reduce global protein synthesis (Extended Data Fig. 9b). Instead, these proteins likely promote cell survival by stimulating the translation of specific mRNAs. Indeed, Gis2 and its human orthologue ZNF9/CNBP are proposed to stimulate cap-independent translation 6.
Fig. 3. Up-regulation of Gis2 and Nog2 in response to mitochondrial damage promotes cell survival.
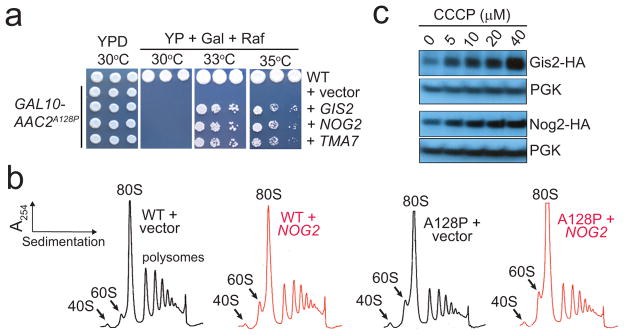
(a) Growth inhibition by AAC2A128P expressed from the GAL10 promoter is suppressed by GIS2, NOG2 and TMA7 on the pRS425 multicopy vector at 33° and 35° but not 30°C. (b) Ribosomal profiles of wild-type (WT) and AAC2A128P (A128P) cells with or without the over-expression of NOG2. (c) Over-accumulation of Gis2-HA and Nog2-HA in response to CCCP treatment. PGK, phosphoglycerate kinase. Full scans of western blots are available in Supplemental Information.
Nog2 inhibits nuclear export of the 60S ribosomal subunit 7. Consistent with this, we found that Nog2 over-expression increased free 60S but not 40S ribosomal subunit, concomitant with a decrease of 80S and polysomes (Fig. 3b). Nuclear retention of 60S and delayed maturation into the 80S in the cytosol may remodel translational programs in favor of cell viability. Decreased availability of 60S is known to benefit the survival of ageing cells 10, 25. The free 60S was also increased by AAC2A128P-expression, which may be at least partially attributed to NOG2 over-expression.
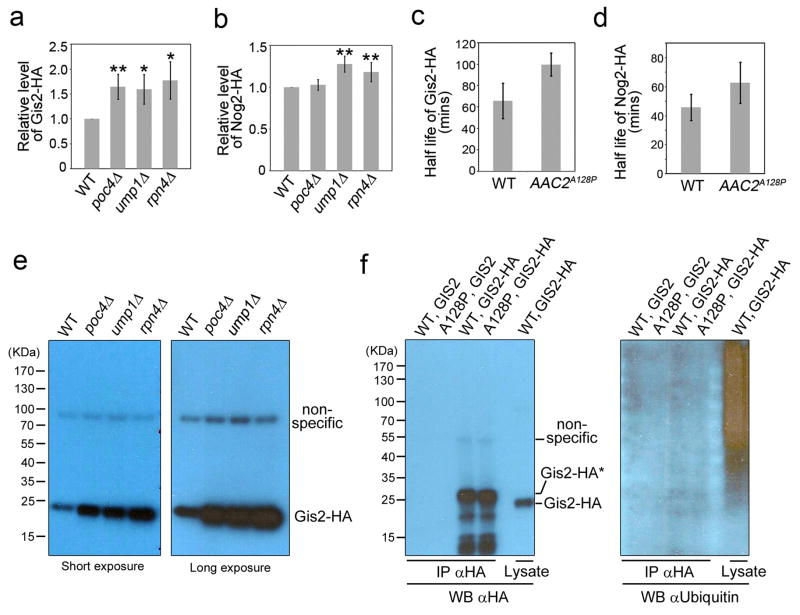
Gis2 and Nog2 can also be induced by the mitochondrial uncoupler carbonyl cyanide m-chlorophenyl hydrazone (CCCP) (Fig. 3c), and by disruption of POC4, UMP1 and RPN4, which affects proteasome biogenesis and assembly (Extended Data Fig. 10a and 10b). Gis2 and Nog2 are intrinsically unstable and are stabilised in AAC2A128P cells (Extended Data Fig. 10c & 10d). Gis2 is not ubiquitinated (Extended Data Fig. 10e & 10f), suggesting that it is degraded in a proteasome-dependent but ubiquitin-independent manner. These data are consistent with the idea that Gis2 and Nog2 help keep the mPOS pathway in check.
In summary, we have identified a novel pathway of mitochondria-induced cell death. This pathway, mPOS, is triggered not only by mutations directly affecting the core protein import machineries, but also by conditions that interfere with mitochondrial inner membrane integrity and function. The mPOS model is consistent with recent findings that mitochondrial dysfunction stabilises cytosolic proteins 26, 27 and reduces the mitochondrial import of signaling proteins 28. Moreover, decreased TOR-signaling, which attenuates the progression of mitochondrial disease 29, may do so via a reduction in protein synthesis. The mPOS pathway could be particularly relevant in cells with high mitochondrial density. In these cells, a subfraction of mitochondria with low Δψm may be sufficient to disturb cytosolic protein homeostasis independent of cell’s bioenergetic state. Finally, we identified a network of anti-degenerative genes that protect cells against mPOS, including Gis2 and Nog2 that are intrinsically up-regulated in response to mitochondrial stress (Fig. 4). The human orthologues of several genes that we identified are involved in neuromuscular degenerative disorders (Supplementary Table 5). In light of this study, we predict that conditions that promote mPOS may contribute to the pathogenesis of these diseases.
Fig. 4. Gis2 and Nog2 up-regulation in response to mitochondrial damage provides a feedback loop to suppress mPOS and promote cell survival.
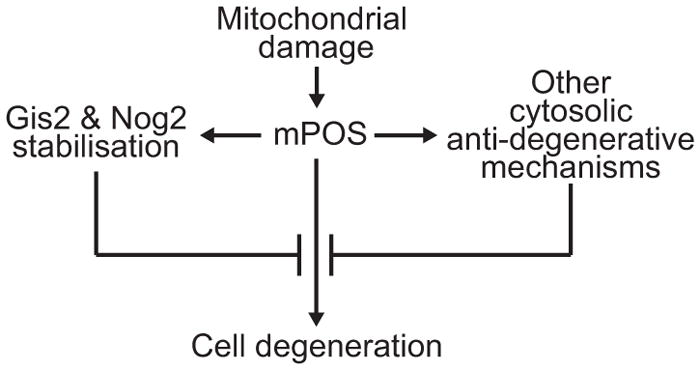
Activation of other pathways in the anti-degenerative network as shown in Fig. 1c and 1d may also benefit cell survival.
METHODS
Media and strains
Yeast complete medium (YP) containing 1% Bacto yeast extract and 2% Bacto peptone is supplemented with 2% glucose (YPD) or 2% galactose plus raffinose (YPGal+Raf) or 2% glycerol (YPGly). Yeast minimal medium (YNBD) contains 0.67% Difco yeast nitrogen base without amino acids and 2% glucose. Supplements essential for auxotrophic strains were added to 20 μg/ml for bases and amino acids except for leucine (30 μg/ml) and lysine (30 μg/ml). For ρ°-lethality test, cells were spotted on YPD supplemented with ethidium bromide (16 μg/ml). When necessary, cells were pre-grown on the ethidium bromide plates before being tested. Unless specified, all the yeast strains used in this study are isogenic to M2915-6A (MATa, ade2, ura3, leu2). M2915-6A/α was derived from M2915-6A by mating type switching. The null alleles for DHH1, PBP1, RPL40A, BLM10, POC4, RPN4, SSB1, SSB2 and UMP1, marked by kan, were transferred from strains of the yeast knockout collection into the M2915-6A background by PCR amplification and one-step gene replacement. YME1 was disrupted by the insertion of LEU2. PG1 (MATα, his3Δ1, leu2Δ0, lys2Δ0, ura3Δ0, trp1::GAL10-AAC2A128P-HIS3) was derived from BY4742 by replacing TRP1 with the GAL10-AAC2A128P-HIS3 cassette by selecting His+ transformants. The strain used for iTRAQ analysis was CY4097 (MATa, ade2, ura3, leu2, trp1Δ::AAC2A128P-URA3, lys2Δ::AAC2A128P-kan). To over-express SSB1, the coding sequence together with its endogenous promoter and 3′ poly(A) tail was first cloned into an integrative pUC-URA3/4 vector. The resulting plasmid DNA was linearized by StuI within URA3, and then integrated into the ura3 locus in M2915-6A. The Ura+ transformants were selected. The correct integration site and the copy number of the integrated SSB1 were determined by Southern-blot analysis.
Screen of anti-degenerative genes
A 2 μm-based yeast multicopy genomic library was transformed into the PG1 strain. Leu2+ transformants were replica-plated onto YPGal medium and 336 positive transformants were identified. The yeast plasmids containing the suppressor loci were rescued from yeast cells and amplified in E. coli. The insert DNA in the suppressor plasmids was sequenced, subcloned, and confirmed by re-transforming into the PG1 strain followed by a phenotypic test.
Protein synthesis assay
Cells were grown in YPD at 30°C overnight and then sub-cultured into synthetic complete medium lacking methionine at OD600 of ~0.3. Cells were then incubated at 25°C for 3 hours. Cell density was determined by measuring the culture at OD600. 1 ml of cell culture was labelled with 5.5 μCi [35S] L-methionine/L-cysteine (EXPRE35S35S Protein Labeling Mix; >1000 Ci/mmol; PerkinElmer NEG072) for 0, 5, 10, 20 and 30 min at 25°C. Labelling was stopped by adding 1/10 volume of 100% TCA to each culture and chilling on ice. After heating at 90°C for 20 min, protein precipitates were collected on GF/C filters (Whatman #1822-025), precipitated again with 10 ml of 10% TCA, washed with 10 ml of 95% ethanol, and then counted in 5 ml of Universol Liquid Scintillation Cocktail (MP Biomedical #882462). The count of each sample was normalized by its cell density.
Preparation of cytosolic proteins
Two independent replicates of the wild type (M2915-6A) and the AAC2A128P strain CY4097 were grown at 30°C for 48 hours in 50 ml of YPD and 100 ml of YNBD supplemented with leucine, lysine, tryptophan and adenine, respectively. The cells were then inoculated into 1 liter of YPD and grown at 22°C for 24 hours. Cells were collected from the 4 independent cultures. A protease inhibitor cocktail free of EDTA and 50 μM MG132 were added to the spheroplasts before cell lysis by homogenization. Mitochondria were eliminated from the cytosol by differential centrifugation according to established procedures 30.
Mass spectrometry analysis
Isobaric Tag for Relative and Absolute Quantitation mass spectrometry (iTRAQ) analysis was performed at Cornell Proteomics and Mass Spectrometry Facility as previously described31. The concentration of cytosolic proteins from two biological replicate samples was determined by Bradford assay using BSA as the calibrant, and further quantified by running on a precast NOVEX 12% Tris/Glycine mini-gel (Invitrogen, Carlsbad, CA) along with a series of E. coli lysates (2, 5, 10, 20 μg/lane). The SDS gel was visualized with colloidal Coomassie blue stain (Invitrogen), and imaged by Typhoon 9400 scanner followed by ImageQuant Software version 5.2 (GE Healthcare). An aliquot (100 μg) of proteins in a total volume of 20 μl was denatured by adding 1 μl of 2% SDS and reduced with 2 μl of 50 mM Tris-(2-carboxyethyl)phosphine (TCEP). Cysteine residues were blocked with 1 μl of 200 mM methyl methanethiosulfonate (MMTS) using the iTRAQ Reagents kit (AB Sciex, Foster City, CA). The proteins were then precipitated with acetone and digested with trypsin. Peptides were labeled with iTRAQ reagents per manufacturer’s instructions (AB Sciex, Foster City, CA). The 114- and 115-tags were used to label the peptides from the control strain (M2915-6A), while the 116- and 117-tags were used to label those from the AAC2A128P-expressing cells. The four samples were then pooled and subjected to fractionation using high pH reverse phase liquid chromatography onto an XTerra MS C18 column (3.5 μm, 2.1x150 mm) from Waters (Milford, MA) as previously reported previously32. Twelve peptide fractions were then analyzed by nanoLC-MS/MS on a LTQ-Orbitrap Velos (Thermo-Fisher Scientific, San Jose, CA) mass spectrometer equipped with nano ion source using high energy collision dissociation (HCD) as previously reported32. The data files acquired were converted into MGF files using Proteome Discoverer 1.3 (PD 1.3, Thermo). Subsequent database search were carried out by Mascot Daemon (version 2.3, Matrix Science, Boston, MA) against the uni-protein database of Saccharomyces cerevisiae (5,882 entries downloaded on Mar 12, 2012) for both protein identification and iTRAQ quantitation. The default Mascot search settings were as follows: one missed cleavage site by trypsin allowed with fixed MMTS modification of cysteine, fixed four-plex iTRAQ modifications on Lys and N-terminal amines and variable modifications of methionine oxidation, deamidation of Asn and Gln residues, and 4-plex iTRAQ on Tyr. The peptide and fragment mass tolerance values were 20 ppm and 0.1 Da, respectively. Only peptides with significant scores at the 99% confidence interval were counted as identified. For quantitation, we used the requirement of two unique peptide hits for each protein. The quantitative protein ratios were weighted and normalized by the median ratio for each set of experiments. The threshold of significance between the proteins from mutant and wild-type cells was further accessed as as previously described 31, 33, 34. The internal error between the biological replicates, defined as the absolute value of the difference between log2(116/114) and log2(117/115) at which 95% of all proteins had no deviation from each other, was calculated to be 0.34 at log2 scale. Relative ratios of ±1.266 were thus deduced as significant difference with a statistic confidence of <0.05.
TAP-Ssb1 pull-down
The wild type strain CY5371 (MATa, met15Δ0, his3Δ0, leu2Δ0, ura3Δ0, SSB1-TAP::HIS3) and the isogenic AAC2A128P-expressing strain CY5171 (MATa, met15Δ0, his3Δ0, leu2Δ0, SSB1-TAP::HIS3, ura3Δ::AAC2A128P::URA3) were grown in 100 ml of YPD at 22oC for 48 hours. The cells were then inoculated into two liters of YPD, and grown at 22oC for 24 hours. Cells were collected by centrifugation, resuspended to 1 g/ml with Buffer Z (20 mM Tris-HCl, pH 8; 150 mM KCl; 1 mM EDTA, pH 8; 10% Glycerol; 1 mM DTT; 1 mM PMSF and protease cocktail), and then passed through microfluidizer 10 times at 18,000 psi. Tween-20 was added to cell lysates to the concentration of 0.1%. Cell lysates were shaken at 4°C for 20 minutes. Cell debris was removed by spinning at 10,000 rpm/4°C/10 minutes. Cell lysates were further purified by centrifugation at 30,000 rpm (Beckman 50.2 ti rotor)/4°C/100 minutes, and then bound to BufferZ (+0.1% Tween-20) equilibrated Rabbit IgG-Agarose (Sigma #A2909) by incubation at 4°C for 3 hours. After binding, the Rabbit IgG-Agarose beads were washed five times with Buffer Z+0.1% Tween-20 to remove the unbound contaminants. TAP-tagged SSB1 and its associated proteins were eluted by incubating with Buffer Z + 0.1% Tween-20+100 u ProTEV Plus (Promega #V610A) at 4°C overnight. The eluates were then subjected to calmodulin binding in Buffer Z + 0.1% Tween-20 + 150 mM NaCl + 1.5 mM MgAcetate + 1 mM Imidizole + 5 mM CaCl2 at 4°C overnight. The beads were then washed five times with the above binding buffer to remove the unbound proteins. The SSB1 tap-tagged and its associated proteins were eluted by incubating with Buffer Z+0.1% Tween-20 + 1.5 mM Mg Acetate + 1 mM Imidizole + 2.5 mM EGTA at 4°C.
Hamagglutinin (HA)-tagging and protein stability measurement
3xHA tag was added to the C-terminus of Gis2 and Nog2 by integration of a PCR product amplifying from a 3HA-KanMX6 cassette. The primers used for tagging GIS2 were GIS2-3HA-KAN-ITFP (5′-taacgaaactggccatatttccaaggattgtccaaaggctCGGATCCCCGGGTTAATTAA-3′) and GIS2-3HA-KAN-ITRP (5′-taagtgattgttcctttgtttttttcagtggatgtttcacGAATTCGAGCTCGTTTAAAC-3′). The GIS2 sequence was shown in lowercase whereas the sequence complementary to the 3HA-KanMX6 cassette was shown in uppercase. The primers used for tagging NOG2 were NOG2-3HA-KAN-ITFP (5′-ggaagaaaaaccaaagaagaaagaagttgagaagacggcaCGGATCCCCGGGTTAATTAA-3′) and NOG2-3HA-KAN-ITRP (5′-tcttaaattaatattatacaccggttgtccgtttttacctGAATTCGAGCTCGTTTAAAC-3′). The NOG2 sequence was shown in lowercase whereas the sequence complementary to the 3HA-KanMX6 cassette was shown in uppercase. To detect the steady state levels of the HA-tagged proteins, the cells were grown at 25°C until all the strains reached OD600=3.5 – 5.0. Cells equivalent to 3 OD600 were collected and subjected to protein extraction. Cell lysates were analyzed by SDS-PAGE and levels of HA-tagged proteins were determined by Western-blot using anti-HA antibody (Covance#MMS-101R). Relative protein levels were quantified by ImageJ. To measure protein stability, cycloheximide was added to the cultures at a concentration of 200 μg/ml, and cells were harvested after incubation at 25°C for 0, 10, 20, 40, 60, 80 and 120 mins.
Co-immunoprecipitation and ubiquitination assay of Gis2
M2915-6A (WT), UPU5-7C (AAC2A128P), CY5738 (GIS2-HA), CY5740 (GIS2-HA, AAC2A128P) were grown in YPD to OD600 3.0. Cells equivalent to 20 OD600 were collected and resuspended in 0.4 ml of lysis buffer (50 mM Tris-HCl, pH7.4, 150 mM NaCl, 25 mM N-ethylmaleimide, 5 mM 2-mercarptoethanol, 50 μM MG132, and complete protease inhibitor cocktail (Roche: 11697498001). Cells were lysed with 0.4 ml of glass beads by using BIOSPEC Mini-Beadbeater-16. The total protein concentration was determined by Quick Start Bradford Protein Assay (Bio-Rad: 500-0201). Equal amounts of cell lysates were bound to 50 μl 50% slurry of monoclonal anti-HA agarose conjugate clone HA-7 (Sigma: A2095) at 4°C for 2 hours. The resin was precipitated by centrifugation and washed five times with lysis buffer. The proteins were eluted with 25 μl 2xSDS sample buffer (125 mM Tris-HCl, pH6.8, 4% SDS, 20% glycerol, 5% 2-mercaptoethanol, 0.005% bromophenol blue), analysed by SDS PAGE and probed with anti-HA (Cell Signaling: 3724S) and anti-Ubiquitin (Thermo Scientific: 701339) antibodies.
Ribosomal profile analysis
M2915-6A (WT) and CY3555 (trp1Δ::AAC2A128P-kan) were transformed with either the multicopy vector pRS426 or pRS426-Nog2. The strains were grown in 100 ml of YNBD + casamino acids supplemented with adenine and tryptophan to OD600 at about 0.8. The culture was added with 5 mg/ml cycloheximide, followed by a rapid swirl and incubation on ice for 10 minutes. The cells were collected by contrifugation at 4°C and washed with lysis buffer (10 mM Tris-HCl, pH7.4, 100 mM NaCl, 30 mM MgCl2, 100 μg/ml cycloheximide, 200 μg/ml heparin, 0.1% diethylpyrocarbonate). The cells were then resuspended in 1 ml of lysis buffer containing 0.4 ml of acid washed, sterile and cold glass beads. The cells were disrupted by BIOSPEC Mini-Beadbeater-16 for 10 times of 30s-beating with a 60s-incubation on ice. The cell lysate was subjected to contrifugation at 5000 g/4°C/5 min and 160,000 g/4°C/10 min. A portion of supernatant with 6 units of absorbance at 260 nm was added to the top of a 12 ml 7%–47% (w/v) continuous sucrose gradient containing 50 mM Tris-HCl, pH7.4, 50 mM NH4Cl, 12 mM MgCl2, and 1mM dithiothreitol. The sucrose gradient was centrifuged at 40,000 rpm/4°C/2.5h in a Beckman SW40Ti rotor. The ribosome profile was analysed with the Density Gradient Fractionation System (Brandel: BR-188-176).
Extended Data
Extended Data Figure 1. Proteostatic crosstalk between mitochondria and the cytosol.
(a) Suppression of ρ°-lethality in the yme1Δ, atp1Δ, tom70Δ and mgr2Δ mutants by anti-degenerative genes on YPD medium supplemented with ethidium bromide that eliminates mtDNA. (b) Schematic depiction of the cytosolic anti-degenerative proteostatic network that suppresses mPOS. (c) Synthetic growth defect between yme1Δ and the disruption of anti-degenerative genes (PBP1, RPL40A, SSB1 and POC4) and other genes affecting cytosolic proteostasis (DHH1, BLM10 and RPN4). Cells were grown on YPD medium and incubated at 37°C.
Extended Data Figure 2. Mitochondrial damage increases protein aggregation in the cytosol.
(a) Synthetic lethality between mitochondrial damage and cytosolic protein misfolding. Growth of AAC2A128P but not wild-type cells is inhibited by expression of GAL10-HD(25Q) on galactose medium, whereas growth of both AAC2A128P and wild-type cells is inhibited by expression of GAL10-HD(103Q). Yeast transformants were serially diluted in water and spotted on minimal glucose or galactose medium. The plates were incubated at 25°C for four days. (b) HD(25Q) forms aggregates in ρ° but not ρ+ cells, whereas HD(103Q) is aggregated in both types of cells. The images are representatives of 200 cells examined for each strain. (c) Increased cytosolic accumulation and aggregation of Aco1-GFP in AAC2A128P-expressing cells. Representative images are from four independent experiments, with a total number of 2,397 and 1,608 cells examined for the wild-type and AAC2A128P strains respectively. (d) Means ± s.d. of the four experiments in (c) (P < 0.001, unpaired Student’s t test).
Extended Data Figure 3. Growth phenotype and relative protein synthesis rate of yeast cells expressing AAC2A128P.
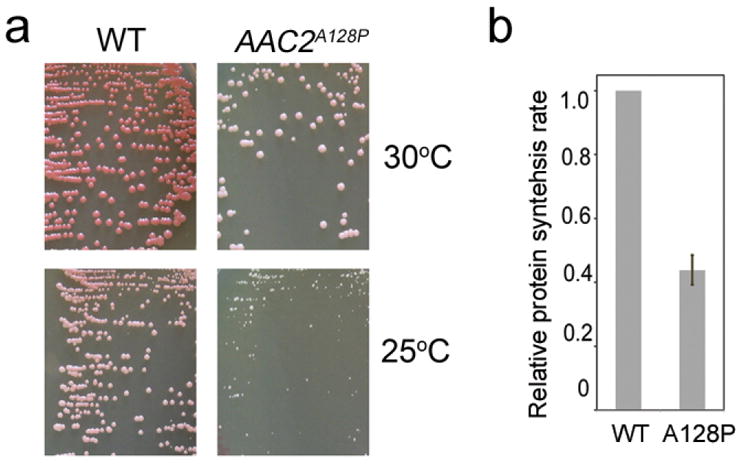
(a) Cells were grown on YPD medium at indicated temperatures for four days. (b) Expression of AAC2A128P reduces global protein synthesis rate which is measured by the incorporation of 35S-Methinine after incubating at 25°C for 5 minutes. Data are means ± s.d. of three independent experiments (P < 0.005, unpaired Student’s t test).
Extended Data Figure 4. Gene ontology analysis of proteins that are up-regulated in the cytosol of AAC2A128P cells.
Colored in red are those involved in ribosomal biogenesis/translation.
Extended Data Figure 5. Increased cytosolic retention and Ssb1 association of mitochondrial precursors in AAC2A128P cells.
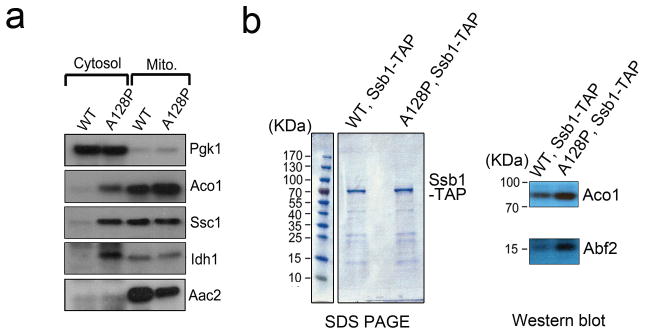
(a) Western-blot showing increased retention of representative mitochondrial proteins (Aco1, Ssc1, Idh1 and Aac2) in the cytosol of AAC2A128P cells. Pgk1, the cytosolic 3-phosphoglycerate kinase, is used as a control. (b) SDS-PAGE (left) and western-blot (right) showing coomassie-stained Ssb1-TAP pulldown products and increased association of Ssb1-TAP with the mitochondrial Aco1 and Abf2 in AAC2A128P cells, respectively. Full scans of blots and gels are available in Supplemental Information.
Extended Data Figure 6. iTRAQ analysis showing the presence of Idh1 and Idh2 precursors in the cytosol of AAC2A128P-expressing cells.
(a) Underlined are Idh1 peptides detected by mass spectrometry. The presequence of Idh1 is shown in red. The cleavage site of mitochondrial peptidase for Idh1 maturation is indicated by the red arrow. Boxed is the peptide 1 detected by mass spectrometry after trypsinization. Peptide 1 encompasses the last threonine residue of the presequence, suggesting that it is derived from the Idh1 precursor instead of its mature form. (b) Frequency of Idh1 peptides identified by mass spectrometry. (c) Underlined are Idh2 peptides detected by mass spectrometry. The presequences of Idh2 are shown in red. The cleavage sites of mitochondrial peptidase for Idh2 maturation are indicated by the red arrows. Boxed is the peptide 1 detected by mass spectrometry after trypsinization. Peptide 1 encompasses the last 1–2 residues of the presequence, suggesting that it is derived from the Idh1 precursor instead of its mature form. (d) Frequency of Idh2 peptides identified by mass spectrometry.
Extended Data Figure 7. Western blot showing the expression levels of TAP-tagged Ssa1, Ssa2, Sse1, Sse2, Ssb1 and Ssb2 in wild type and AAC2A128P cells.
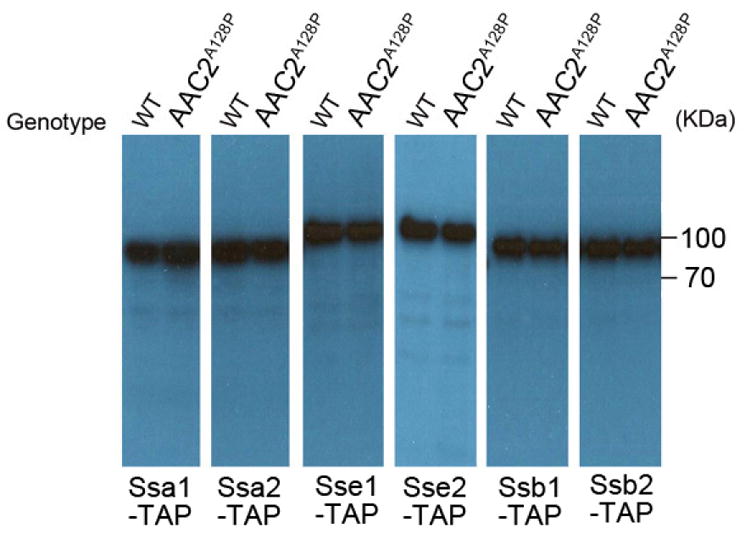
Equal amounts of lysates from cells grown at 25°C were analyzed using an antibody against protein A in the TAP-tag. Full scans of blots are available in Supplemental Information.
Extended Data Figure 8. The heat sensitivity of the yme1Δ mutant is suppressed by one and two extra copies of SSB1 integrated into the genome.

Cells were diluted in water, spotted on YPD plates and incubated at the indicated temperatures for three days.
Extended Data Figure 9. Suppression of ρ°-lethality in atp1Δ, mgr2Δ and tom70Δ mutants by over-expression of GIS2 and protein synthesis rate in cells over-expressing GIS2, NOG2 and TMA7.
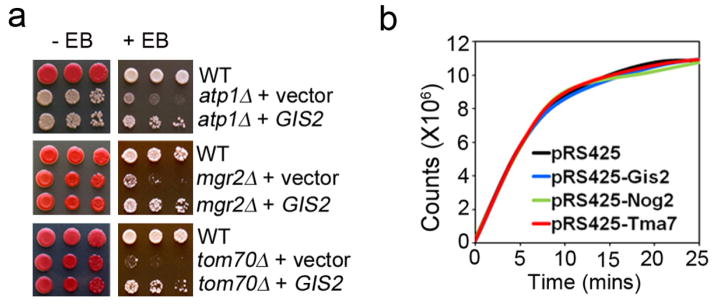
(a) Ethidium bromide (EB) sensitivity test. Yeast transformants were diluted in water and spotted on YPD with or without ethidium bromide. The plates were incubated at 30°C for four days. GIS2 was over-expressed from the multicopy vector pRS425. (b) In vivo protein synthesis assay. The incorporation of 35S-methionine in the wild-type cells over-expressing GIS2, NOG2 and TMA7 on a multicopy vector was measured at 25°C.
Extended Data Figure 10. Stability of Gis2-HA and Nog2-HA.
(a) and (b) Relative steady state levels of Gis2-HA and Nog2-HA in proteasomal mutants. Data are means ± s.d. of 3 and 5 independent experiments for Gis2-HA and Nog2-HA, respectively (*, P<0.05; **, P<0.01; unpaired Student’s t test). (c) and (d) Half life of Gis2-HA and Nog2-HA in the wild-type (WT) and AAC2A128P (A128P) cells. Data are means ± s.d. of three experiments (P<0.05 for Gis2-HA and P = 0.15 for Nog2-HA, unpaired Student’s t test). (e) Western blot analysis showing no evidence of Gis2-HA ubiquitination in the poc4Δ, ump1Δ and rpn4Δ cells. The ump1Δ and rpn4Δ cells are temperature sensitive because of defective proteasomal function. Cells were grown at the non-permissive temperature (37°C) before being lysed for protein extraction and SDS-PAGE. (f) Gis2-HA was immunoprecipitated from the wild-type (WT) and AAC2A128P (A128P) cells and analysed by western blot using antibodies against HA (left panel) and ubiquitin (right panel). Note that the IP-purified full length Gis2-HA migrates slower than the protein in the cell lysate, likely due to posttranslational modification during immunoprecipitation. The cryptic modification is unrelated to ubiquitination, based on the lack of reactivity with the anti-ubiquitin antibody.
Supplementary Material
Acknowledgments
We thank M. Mollapour, W. Decatur (Schmitt lab) and the Kane lab for help in the ubiquitination and ribosomal analysis experiments, S. Hanes for critical reading of the manuscript, S. Zhang (Cornell Proteomics and Mass Spectrometry Facility) for processing the iTRAQ data. This work was supported by the NIH grants R01AG023731 and R21AG047400.
Footnotes
Online Content Methods, along with any additional Extended Data display items and Source Data, are available in the online version of the paper; references unique to these sections appear only in the online paper.
Author Contributions X.W. performed most of the experiments described in the study. X.J.C. conceived the project, guided the experiments, constructed yeast strains and performed genetic analysis. X.J.C. and X.W. wrote the manuscript.
The authors declare no competing financial interests.
References
- 1.Wallace DC. A mitochondrial paradigm of metabolic and degenerative diseases, aging, and cancer: a dawn for evolutionary medicine. Annu Rev Genet. 2005;39:359–407. doi: 10.1146/annurev.genet.39.110304.095751. [DOI] [PMC free article] [PubMed] [Google Scholar]
- 2.Veatch JR, McMurray MA, Nelson ZW, Gottschling DE. Mitochondrial dysfunction leads to nuclear genome instability via an iron-sulfur cluster defect. Cell. 2009;137:1247–1258. doi: 10.1016/j.cell.2009.04.014. [DOI] [PMC free article] [PubMed] [Google Scholar]
- 3.Wang X. The expanding role of mitochondria in apoptosis. Genes Dev. 2001;15:2922–2933. [PubMed] [Google Scholar]
- 4.Durieux J, Wolff S, Dillin A. The cell-non-autonomous nature of electron transport chain-mediated longevity. Cell. 2011;144:79–91. doi: 10.1016/j.cell.2010.12.016. [DOI] [PMC free article] [PubMed] [Google Scholar]
- 5.Pan Y, Schroeder EA, Ocampo A, Barrientos A, Shadel GS. Regulation of yeast chronological life span by TORC1 via adaptive mitochondrial ROS signaling. Cell Metab. 2011;13:668–678. doi: 10.1016/j.cmet.2011.03.018. [DOI] [PMC free article] [PubMed] [Google Scholar]
- 6.Gerbasi VR, Link AJ. The myotonic dystrophy type 2 protein ZNF9 is part of an ITAF complex that promotes cap-independent translation. Mol Cell Proteomics. 2007;6:1049–1058. doi: 10.1074/mcp.M600384-MCP200. [DOI] [PubMed] [Google Scholar]
- 7.Matsuo Y, et al. Coupled GTPase and remodelling ATPase activities form a checkpoint for ribosome export. Nature. 2014;505:112–116. doi: 10.1038/nature12731. [DOI] [PMC free article] [PubMed] [Google Scholar]
- 8.Kaukonen J, et al. Role of adenine nucleotide translocator 1 in mtDNA maintenance. Science. 2000;289:782–785. doi: 10.1126/science.289.5480.782. [DOI] [PubMed] [Google Scholar]
- 9.Palmieri L, et al. Complete loss-of-function of the heart/muscle-specific adenine nucleotide translocator is associated with mitochondrial myopathy and cardiomyopathy. Hum Mol Genet. 2005;14:3079–3088. doi: 10.1093/hmg/ddi341. [DOI] [PubMed] [Google Scholar]
- 10.Wang XW, Zuo XM, Kucejova B, Chen XJ. Reduced cytosolic protein synthesis suppresses mitochondrial degeneration. Nature Cell Biology. 2008;10:1090–1097. doi: 10.1038/ncb1769. [DOI] [PMC free article] [PubMed] [Google Scholar]
- 11.Liu Y, Wang X, Chen XJ. Misfolding of mutant adenine nucleotide translocase in yeast supports a novel mechanism of Ant1-induced muscle diseases. Mol Biol Cell. 2015;26:1985–1994. doi: 10.1091/mbc.E15-01-0030. [DOI] [PMC free article] [PubMed] [Google Scholar]
- 12.Huber A, et al. Sch9 regulates ribosome biogenesis via Stb3, Dot6 and Tod6 and the histone deacetylase complex RPD3L. EMBO J. 2011;30:3052–3064. doi: 10.1038/emboj.2011.221. [DOI] [PMC free article] [PubMed] [Google Scholar]
- 13.Gilbert WV, Zhou K, Butler TK, Doudna JA. Cap-independent translation is required for starvation-induced differentiation in yeast. Science. 2007;317:1224–1227. doi: 10.1126/science.1144467. [DOI] [PubMed] [Google Scholar]
- 14.Balagopal V, Parker R. Polysomes, P bodies and stress granules: states and fates of eukaryotic mRNAs. Curr Opin Cell Biol. 2009;21:403–408. doi: 10.1016/j.ceb.2009.03.005. [DOI] [PMC free article] [PubMed] [Google Scholar]
- 15.Kryndushkin DS, Smirnov VN, Ter-Avanesyan MD, Kushnirov VV. Increased expression of Hsp40 chaperones, transcriptional factors, and ribosomal protein Rpp0 can cure yeast prions. J Biol Chem. 2002;277:23702–23708. doi: 10.1074/jbc.M111547200. [DOI] [PubMed] [Google Scholar]
- 16.Lee AS, Burdeinick-Kerr R, Whelan SP. A ribosome-specialized translation initiation pathway is required for cap-dependent translation of vesicular stomatitis virus mRNAs. Proc Natl Acad Sci USA. 2013;110:324–329. doi: 10.1073/pnas.1216454109. [DOI] [PMC free article] [PubMed] [Google Scholar]
- 17.Xue S, et al. RNA regulons in Hox 5′ UTRs confer ribosome specificity to gene regulation. Nature. 2015;517:33–38. doi: 10.1038/nature14010. [DOI] [PMC free article] [PubMed] [Google Scholar]
- 18.Begley U, et al. Trm9-catalyzed tRNA modifications link translation to the DNA damage response. Mol Cell. 2007;28:860–870. doi: 10.1016/j.molcel.2007.09.021. [DOI] [PMC free article] [PubMed] [Google Scholar]
- 19.Thorsness PE, White KH, Fox TD. Inactivation of YME1, a member of the ftsH-SEC18-PAS1-CDC48 family of putative ATPase-encoding genes, causes increased escape of DNA from mitochondria in Saccharomyces cerevisiae. Mol Cell Biol. 1993;13:5418–5426. doi: 10.1128/mcb.13.9.5418. [DOI] [PMC free article] [PubMed] [Google Scholar]
- 20.Chacinska A, Koehler CM, Milenkovic D, Lithgow T, Pfanner N. Importing mitochondrial proteins: machineries and mechanisms. Cell. 2009;138:628–644. doi: 10.1016/j.cell.2009.08.005. [DOI] [PMC free article] [PubMed] [Google Scholar]
- 21.Dunn CD, Jensen RE. Suppression of a defect in mitochondrial protein import identifies cytosolic proteins required for viability of yeast cells lacking mitochondrial DNA. Genetics. 2003;165:35–45. doi: 10.1093/genetics/165.1.35. [DOI] [PMC free article] [PubMed] [Google Scholar]
- 22.Rikhvanov EG, et al. Do mitochondria regulate the heat-shock response in Saccharomyces cerevisiae? Curr Genet. 2005;48:44–59. doi: 10.1007/s00294-005-0587-z. [DOI] [PubMed] [Google Scholar]
- 23.Chiabudini M, Conz C, Reckmann F, Rospert S. Ribosome-associated complex and Ssb are required for translational repression induced by polylysine segments within nascent chains. Mol Cell Biol. 2012;32:4769–4779. doi: 10.1128/MCB.00809-12. [DOI] [PMC free article] [PubMed] [Google Scholar]
- 24.Willmund F, et al. The cotranslational function of ribosome-associated Hsp70 in eukaryotic protein homeostasis. Cell. 2013;152:196–209. doi: 10.1016/j.cell.2012.12.001. [DOI] [PMC free article] [PubMed] [Google Scholar]
- 25.Steffen KK, et al. Yeast life span extension by depletion of 60S ribosomal subunit is mediated by Gcn4. Cell. 2008;133:292–302. doi: 10.1016/j.cell.2008.02.037. [DOI] [PMC free article] [PubMed] [Google Scholar]
- 26.Merkwirth C, et al. Loss of prohibitin membrane scaffolds impairs mitochondrial architecture and leads to tau hyperphosphorylation and neurodegeneration. PLoS Genet. 2012;8:e1003021. doi: 10.1371/journal.pgen.1003021. [DOI] [PMC free article] [PubMed] [Google Scholar]
- 27.Segref A, et al. Pathogenesis of human mitochondrial diseases is modulated by reduced activity of the ubiquitin/Proteasome system. Cell Metabolism. 2014;19:642–652. doi: 10.1016/j.cmet.2014.01.016. [DOI] [PubMed] [Google Scholar]
- 28.Nargund AM, Pellegrino MW, Fiorese CJ, Baker BM, Haynes CM. Mitochondrial import efficiency of ATFS-1 regulates mitochondrial UPR activation. Science. 2012;337:587–590. doi: 10.1126/science.1223560. [DOI] [PMC free article] [PubMed] [Google Scholar]
- 29.Johnson SC, et al. mTOR inhibition alleviates mitochondrial disease in a mouse model of Leigh syndrome. Science. 2013;342:1524–1528. doi: 10.1126/science.1244360. [DOI] [PMC free article] [PubMed] [Google Scholar]
- 30.Diekert K, de Kroon AIPM, Kispal G, Lill R. Isolation and subfractionation of mitochondria from the yeast Saccharomyces cerevisiae. In: Pon LA, Schon EA, editors. Mitochondrion. Academic Press; San Diego: 2001. pp. 41–44. [DOI] [PubMed] [Google Scholar]
- 31.Yang Y, et al. Evaluation of different multidimensional LC-MS/MS pipelines for isobaric tags for relative and absolute quantitation (iTRAQ)-based proteomic analysis of potato tubers in response to cold storage. J Proteome Res. 2011;10:4647–4660. doi: 10.1021/pr200455s. [DOI] [PubMed] [Google Scholar]
- 32.Yang QS, et al. Quantitative proteomic analysis reveals that antioxidation mechanisms contribute to cold tolerance in plantain (Musa paradisiaca L.; ABB Group) seedlings. Mol Cell Proteomics. 2012;11:1853–1869. doi: 10.1074/mcp.M112.022079. [DOI] [PMC free article] [PubMed] [Google Scholar]
- 33.Redding AM, Mukhopadhyay A, Joyner DC, Hazen TC, Keasling JD. Study of nitrate stress in Desulfovibrio vulgaris Hildenborough using iTRAQ proteomics. Briefings Funct. Genomics Proteomics. 2006;5:133–143. doi: 10.1093/bfgp/ell025. [DOI] [PubMed] [Google Scholar]
- 34.Gan CS, Chong PK, Pham TK, Wright PC. Technical, experimental and biological variations in isobaric tags for relative and absolute quantitation (iTRAQ) J Proteome Res. 2007;6:821–827. doi: 10.1021/pr060474i. [DOI] [PubMed] [Google Scholar]
Associated Data
This section collects any data citations, data availability statements, or supplementary materials included in this article.


