Abstract
Monaural spectral features are important for human sound-source localization in sagittal planes, including front-back discrimination and elevation perception. These directional features result from the acoustic filtering of incoming sounds by the listener’s morphology and are described by listener-specific head-related transfer functions (HRTFs). This article proposes a probabilistic, functional model of sagittal-plane localization that is based on human listeners’ HRTFs. The model approximates spectral auditory processing, accounts for acoustic and non-acoustic listener specificity, allows for predictions beyond the median plane, and directly predicts psychoacoustic measures of localization performance. The predictive power of the listener-specific modeling approach was verified under various experimental conditions: The model predicted effects on localization performance of band limitation, spectral warping, non-individualized HRTFs, spectral resolution, spectral ripples, and high-frequency attenuation in speech. The functionalities of vital model components were evaluated and discussed in detail. Positive spectral gradient extraction, sensorimotor mapping, and binaural weighting of monaural spatial information were addressed in particular. Potential applications of the model include predictions of psychophysical effects, for instance, in the context of virtual acoustics or hearing assistive devices.
I. INTRODUCTION
Human listeners use monaural spectral features to localize sound sources, particularly when binaural localization cues are absent (Agterberg et al., 2012) or ambiguous (Macpherson and Middlebrooks, 2002). Ambiguity of binaural cues usually arises along the polar dimension on sagittal planes, i.e., when estimating the vertical position of the source (e.g., Vliegen and Opstal, 2004) and when distinguishing between front and back (e.g., Zhang and Hartmann, 2010). Head-related transfer functions (HRTFs) describe the acoustic filtering of the torso, head, and pinna (Møller et al., 1995) and thus the monaural spectral features.
Several psychoacoustic studies have addressed the question of which monaural spectral features are relevant for sound localization. It is well known that the amplitude spectrum of HRTFs is most important for localization in sagittal planes (e.g., Kistler and Wightman, 1992), whereas the phase spectrum of HRTFs affects localization performance only for very specific stimuli with large spectral differences in group delay (Hartmann et al., 2010). Early investigations attempted to identify spectrally local features like specific peaks and/or notches as localization cues (e.g., Blauert, 1969; Hebrank and Wright, 1974). Middlebrooks (1992) could generalize those attempted explanations in terms of a spectral correlation model. However, the actual mechanisms of the auditory system used to extract localization cues remained unclear.
Neurophysiological findings suggest that mammals decode monaural spatial cues by extracting spectral gradients rather than center frequencies of peaks and notches. May (2000) lesioned projections from the dorsal cochlear nucleus (DCN) to the inferior colliculus of cats and demonstrated by behavioral experiments that the DCN is crucial for sagittal-plane sound localization. Reiss and Young (2005) investigated in depth the role of the cat DCN in coding spatial cues and provided strong evidence for sensitivity of the DCN to positive spectral gradients. As far as we are aware of, however, the effect of positive spectral gradients on sound localization has not yet been explicitly tested or modeled for human listeners.
In general, existing models of sagittal-plane localization for human listeners can be subdivided into functional models (e. g., Langendijk and Bronkhorst, 2002) and machine learning approaches (e.g., Jin et al., 2000). The findings obtained with the latter are difficult to generalize to signals, persons, and conditions for which the model has not been extensively trained in advance. Hence, the present study focuses on a functional model where model parameters correspond to physiologically and/or psychophysically inspired localization parameters in order to better understand the mechanisms underlying spatial hearing in the polar dimension. By focusing on the effect of temporally static modifications of spectral features, we assume the incoming sound (the target) to originate from a single target source and the listeners to have no prior expectations regarding the direction of this target.
The first explicit functional models of sound localization based on spectral shape cues were proposed by Middlebrooks (1992), Zakarauskas and Cynader (1993), as well as Hofman and Opstal (1998). Based on these approaches, Langendijk and Bronkhorst (2002) proposed a probabilistic extension to model their results from localization experiments. All these models roughly approximate peripheral auditory processing in order to obtain internal spectral representations of the incoming sounds. Furthermore, they follow a template-based approach, assuming that listeners create an internal template set of their specific HRTFs as a result of a monaural learning process (Hofman et al., 1998; van Wanrooij and van Opstal, 2005). The more similar the representation of the incoming sound compared to a specific template, the larger the assumed probability of responding at the polar angle that corresponds to this template. Langendijk and Bronkhorst (2002) demonstrated good correspondence between their model predictions and experimental outcomes for individual listeners by means of likelihood statistics.
Recently, we proposed a method to compute psychoacoustic performance measures of confusion rates, accuracy, and precision from the output of a probabilistic localization model (Baumgartner et al., 2013). In contrast to earlier approaches, this model considered a non-acoustic, listener-specific factor of spectral sensitivity that has been shown to be essential for capturing the large inter-individual differences of localization performance (Majdak et al., 2014). However, the peripheral part of auditory processing has been considered without positive spectral gradient extraction, and the model has been able to predict localization responses only in proximity of the median plane but not for more lateral targets. Thus, in the present study, we propose a model that additionally considers positive spectral gradient extraction and allows for predictions beyond the median plane by approximating the motor response behavior of human listeners.
In Sec. II, the architecture of the proposed model and its parameterization are described in detail. In Sec. III, the model is evaluated under various experimental conditions probing localization with single sound sources at moderate intensities. Finally, in Sec. IV the effects of particular model stages are evaluated and discussed.
II. MODEL DESCRIPTION
Figure 1 shows the structure of the proposed sagittal-plane localization model. Each block represents a processing stage of the auditory system in a functional way. First, the spectral auditory processing of an incoming target sound is approximated in order to obtain the target’s internal spectral representation. Then, this target representation is compared to a template set consisting of equivalently processed internal representations of the HRTFs for the given sagittal plane. This comparison process is the basis of the spectro-to-spatial mapping. Finally, the impact of monaural and binaural perceptual factors as well as aspects of sensorimotor mapping are considered in order to yield the polar-angle response prediction.
FIG. 1.

Structure of the sagittal-plane localization model. Numbers in brackets correspond to equations derived in the text.
A. Spectral auditory processing
1. Acoustic filtering
In the model, acoustic transfer characteristics are captured by listener-specific directional transfer functions (DTFs), which are HRTFs with the direction-independent characteristics removed for each ear (Middlebrooks, 1999a). DTFs usually emphasize high-frequency components and are commonly used for sagittal-plane localization experiments with virtual sources (Middlebrooks, 1999b; Langendijk and Bronkhorst, 2002; Goupell et al., 2010; Majdak et al., 2013c).
In order to provide a formal description, the space is divided into Nϕ mutually exclusive lateral segments orthogonal to the interaural axis. The segments are determined by the lateral centers ϕk ∈ [−90°, 90°) from the right- to the left-hand side. In other words, all available DTFs are clustered into Nϕ sagittal planes. Further, let θi,k ∈ [−90°, 270°), from front below to rear below, for all k = 1,…,Nϕ and i = 1,…,Nθ[k] denote the polar angles corresponding to the impulse responses, ri,k,ζ[n], of a listener’s set of DTFs. The channel index, ζ ∈ {L, R}, represents the left and right ear, respectively. The linear convolution of a DTF with an arbitrary stimulus, x[n], yields a directional target sound,
| (1) |
2. Spectral analysis
The target sound is then filtered using a gammatone filterbank (Lyon, 1997). For stationary sounds at a moderate intensity, the gammatone filterbank is an established approximation of cochlear filtering (Unoki et al., 2006). In the proposed model, the frequency spacing of the auditory filter bands corresponds to one equivalent rectangular bandwidth. The corner frequencies of the filterbank, fmin = 0.7 kHz and fmax = 18 kHz, correspond to the minimum frequency thought to be affected by torso reflections (Algazi et al., 2001) and, in approximation, the maximum frequency of the hearing range, respectively. This frequency range is subdivided into Nb = 28 bands. G[n,b] denotes the impulse response of the bth auditory filter. The long-term spectral profile, in dB, of the stationary but finite sound, ξ[n], with length Nξ is given by
| (2) |
for all b = 1,…,Nb. With ξ[n] = tj,k,ζ[n] and ξ[n] = ri,k,ζ[n] for the target sound and template, respectively, Eq. (2) yields the corresponding spectral profiles, and .
3. Positive spectral gradient extraction
In cats, the DCN is thought to extract positive spectral gradients from spectral profiles. Reiss and Young (2005) proposed a DCN model consisting of three units, namely, DCN type IV neurons, DCN type II interneurons, and wideband inhibitors. The DCN type IV neurons project from the auditory nerve to the inferior colliculus, the DCN type II interneurons inhibit those DCN type IV neurons with best frequencies just above the type II best frequencies, and the wideband units inhibit both DCN type II and IV units, albeit the latter to a reduced extent. In Reiss and Young (2005), this model explained most of the measured neural responses to notched-noise sweeps.
Inspired by this DCN functionality, for all b = 2,…,Nb, we consider positive spectral gradient extraction in terms of
| (3) |
Hence, with and we obtain the internal representations and , respectively. In relation to the model from Reiss and Young (2005), the role of the DCN type II interneurons is approximated by computing the spectral gradient and the role of the wideband inhibitors by restricting the selection to positive gradients. Interestingly, Zakarauskas and Cynader (1993) already discussed the potential of a spectral gradient metric in decoding spectral cues. However, in 1993, they had no neurophysiological evidence for this decoding strategy and did not consider the restriction to positive gradients.
B. Spatial mapping
1. Comparison process
Listeners are able to map the internal target representation to a direction in the polar dimension. In the proposed model, this mapping is implemented as a comparison process between the target representation and each template. Each template refers to a specific polar angle in the given sagittal plane. In the following, this polar angle is denoted as the polar response angle, because the comparison process forms the basis of subsequent predictions of the response behavior.
The comparison process results in a distance metric, , as a function of the polar response angle and is defined as L1-norm, i.e.,
| (4) |
Since sagittal-plane localization is considered to be a monaural process (van Wanrooij and van Opstal, 2005), the comparisons are processed separately for the left and right ear in the model. In general, the smaller the distance metric, the more similar the target is to the corresponding template. If spectral cues show spatial continuity along a sagittal plane, the resulting distance metric is a smooth function of the polar response angle. This function can also show multiple peaks due to ambiguities of spectral cues, for instance between front and back.
2. Similarity estimation
In the next step, the distance metrics are mapped to similarity indices that are considered to be proportional to the response probability. The mapping between the distance metric and the response probability is not fully understood yet, but there is evidence that in addition to the directional information contained in the HRTFs, the mapping is also affected by non-acoustic factors like the listener’s specific ability to discriminate spectral envelope shapes (Andéol et al., 2013).
Langendijk and Bronkhorst (2002) modeled the mapping between distance metrics and similarity indices by somewhat arbitrarily using a Gaussian function with zero mean and a listener-constant standard deviation (their S = 2) yielding best predictions for their tested listeners. Baumgartner et al. (2013) pursued this approach while considering the standard deviation of the Gaussian function as a listener-specific factor of spectral sensitivity (called uncertainty parameter). Recent investigations have shown that this factor is essential to represent a listener’s general localization ability, much more than the listener’s HRTFs (Majdak et al., 2014). Varying the standard deviation of a Gaussian function scales both its inflection point and its slope. In order to better distinguish between those two parameters in the presently proposed model, the mapping between the distance metric and the perceptually estimated similarity, , is modeled as a two-parameter function with a shape similar to the single-sided Gaussian function, namely, a sigmoid psychometric function,
| (5) |
where Γ denotes the degree of selectivity and Sl denotes the listener-specific sensitivity. Basically, the lower Sl, the higher the sensitivity of the listener to discriminate internal spectral representations. The strength of this effect depends on Γ. A small Γ corresponds to a shallow psychometric function and means that listeners estimate spectral similarity rather gradually. Consequently, a small Γ reduces the effect of Sl. In contrast, a large Γ corresponds to a steep psychometric function and represents a rather dichotomous estimation of similarity, strengthening the effect of Sl.
3. Binaural weighting
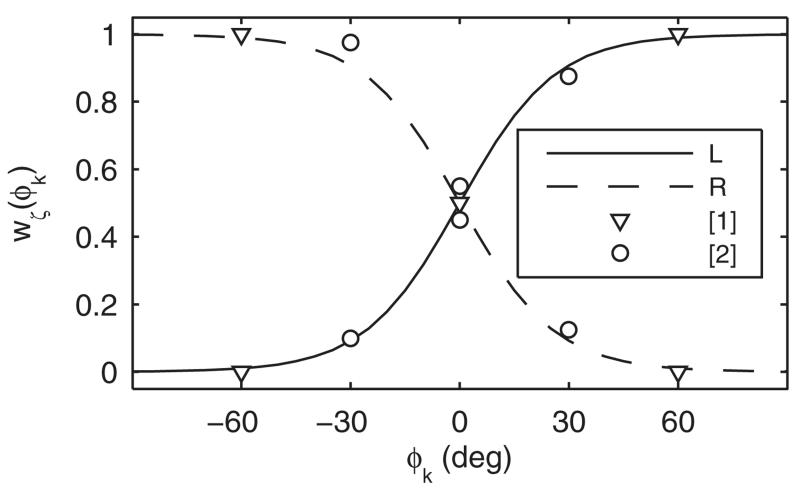
Up to this point, spectral information is analyzed separately for each ear. When combining the two monaural outputs, binaural weighting has to be considered. Morimoto (2001) showed that while both ears contribute equally in the median plane, the contribution of the ipsilateral ear increases monotonically with increasing lateralization. The contribution of the contralateral ear becomes negligible at magnitudes of lateral angles beyond 60°. Macpherson and Sabin (2007) further demonstrated that binaural weighting depends on the perceived lateral location, and they quantified the relative contribution of each ear at a ±45° lateral angle.
In order to determine the binaural weighting as a continuous function of the lateral response angle, ϕk, we attempted to fit a somehow arbitrarily chosen sigmoid function, wL(ϕk) = (1 + e−ϕk/Φ)−1 and wR(ϕk) = 1 − wL(ϕk) for the left and right ears, respectively, to the anchor points from the two experiments described above. The lower the choice of the binaural weighting coefficient, Φ, the larger the relative contribution of the ipsilateral ear becomes. Figure 2 shows that choosing Φ = 13° yields a weighting consistent with the outcomes of the two underlying studies (Morimoto, 2001; Macpherson and Sabin, 2007). The weighted sum of the monaural similarity indices finally yields the overall similarity index,
| (6) |
FIG. 2.
Binaural weighting function best fitting results from Morimoto (2001) labeled as [1] and Macpherson and Sabin (2007) labeled as [2] in a least squared error sense.
4. Sensorimotor mapping
When asked to respond to a target sound by pointing, listeners map their auditory perception to a motor response. This mapping is considered to result from several subcortical (King, 2004) and cortical (Bizley et al., 2007) processes. In the proposed model, the overall effect of this complex multi-layered process is condensed by means of a scatter that smears the similarity indices along the polar dimension. Since we have no evidence for a specific overall effect of sensorimotor mapping on the distribution of response probabilities, using a Gaussian scatter approximates multiple independent neural and motor processes according to the central limit theorem. The scatter, ε, is defined in the body-centered frame of reference (elevation dimension; Redon and Hay, 2005). The projection of a scatter constant in elevation into the auditory frame of reference (polar dimension) yields a scatter reciprocal to the cosine of the lateral angle. Hence, the more lateral the response, the larger the scatter becomes in polar dimension. In the model, the motor response behavior is obtained by a circular convolution between the vector of similarity indices and a circular normal distribution, ρ(x; μ, κ), with location μ = 0 and a concentration, κ, depending on ε:
| (7) |
The operation in Eq. (7) requires the polar response angle being regularly sampled. Thus, spline interpolation is applied before if regular sampling is not given.
5. Normalization to probabilities
In order to obtain a probabilistic prediction of the response behavior, is assumed to be proportional to the listener’s response probability for a certain polar angle. Thus, we scale the vector of similarity indices such that its sum equals one; this yields a probability mass vector (PMV) representing the prediction of the response probability,
| (8) |
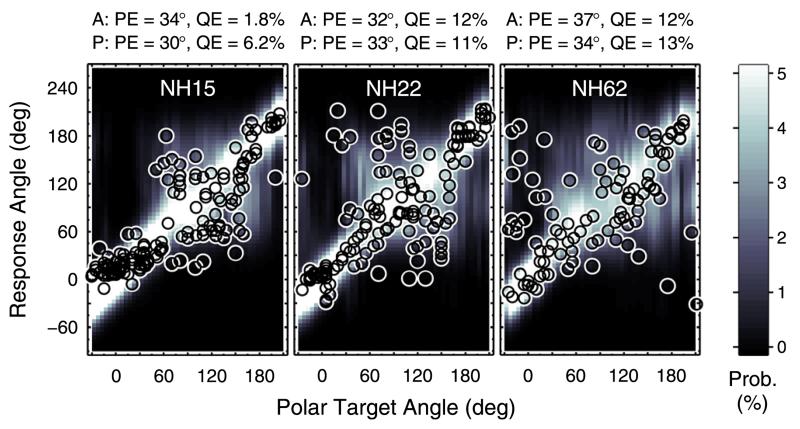
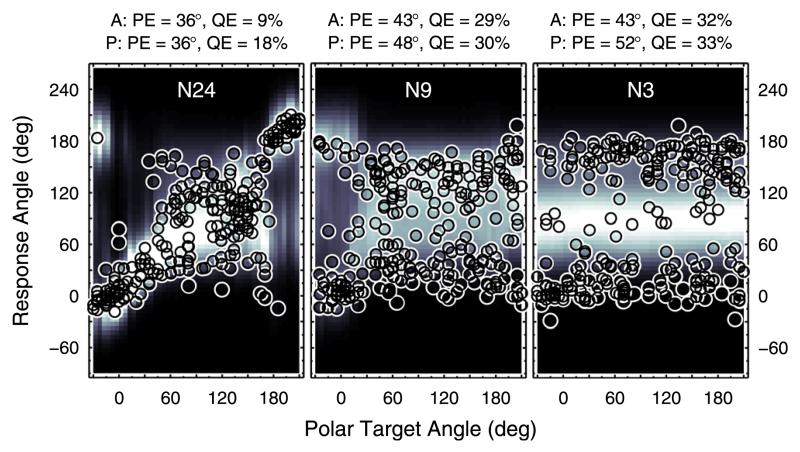
Examples of such probabilistic predictions are shown in Fig. 3 for the median plane. For each polar target angle, predicted PMVs are illustrated and encoded by brightness. Actual responses from the three listeners are shown as open circles.
FIG. 3.
(Color online) Prediction examples. Actual responses and response predictions for three exemplary listeners when listening to median-plane targets in the baseline condition. Actual response angles are shown as open circles. Probabilistic response predictions are encoded by brightness according to the color bar to the right. A: Actual. P: Predicted.
C. Psychoacoustic performance measures
Given a probabilistic response prediction, psychoacoustic performance measures can be calculated by means of expectancy values. In the context of sagittal-plane localization, those measures are often subdivided into measuring either local performance, i.e., accuracy and precision for responses close to the target position, or global performance in terms of localization confusions. In order to define local polar-angle responses, let denote the set of indices corresponding to local responses, θi,k, to a target positioned at ϑj,k. Hereafter, we use the quadrant error rate (Middlebrooks, 1999b), denoted as QE, to quantify localization confusions; it measures the rate of non-local responses in terms of
| (9) |
Within the local response range, we quantify localization performance by evaluating the polar root-mean-square error (Middlebrooks, 1999b), denoted as PE, which describes the effects of both accuracy and precision. The expectancy value of this metric in degrees is given by
| (10) |
Alternatively, any type of performance measure can also be retrieved by generating response patterns from the probabilistic predictions. To this end, for each target angle, random responses are drawn according to the corresponding PMV. The resulting patterns are then treated in the same way as if they would have been obtained from real psychoacoustic localization experiments. On average, this procedure yields the same results as computing the expectancy values.
In Fig. 3, actual (A:) and predicted (P:) PE and QE are listed for comparison above each panel. Non-local responses, for instance, were more frequent for NH22 and NH62 than for NH15, thus yielding larger QE. The model parameters used for these predictions were derived as follows.
D. Parameterization
The sagittal-plane localization model contains three free parameters, namely, the degree of selectivity, Γ, the sensitivity, Sl, and the motor response scatter, ε. These parameters were optimized in order to yield a model with the smallest prediction residue, e, between modeled and actual localization performance.
The actual performance was obtained in experiments (Goupell et al., 2010; Majdak et al., 2010; Majdak et al., 2013b; Majdak et al., 2013c) with human listeners localizing Gaussian white noise bursts with a duration of 500 ms. The targets were presented across the whole lateral range in a virtual auditory space. The listeners, 23 in total and called the pool, had normal hearing (NH) and were between 19 and 46 yrs old at the time of the experiments.
For model predictions, the data were pooled within 20°-wide lateral segments centered at ϕk = 0°, ±20°, ±40°, etc. The aim was to account for changes of spectral cues, binaural weighting, and compression of the polar angle dimension with increasing magnitude of the lateral angle. If performance predictions were combined from different segments, the average was weighted relative to the occurrence rates of targets in each segment.
Both modeled and actual performance was quantified by means of QE and PE. Prediction residues were calculated for these performance measures. The residues were pooled across listeners and lateral target angles in terms of the root mean square weighted again by the occurrence rates of targets. The resulting residues are called the partial prediction residues, eQE and ePE.
The optimization problem can be finally described as
| (11) |
with the joint prediction residue,
The chance rates, QE(c) and PE(c), result from pj,k[θi,k] = 1/Nθ[k] and represent the performance of listeners randomly guessing the position of the target. Recall that the sensitivity, Sl, is considered a listener-specific parameter, whereas the remaining two parameters, Γ and ε, are considered identical for all listeners. Sl was optimized on the basis of targets in the proximity of the median plane (±30°) only, because most of the responses were within this range, because listeners’ responses are usually most consistent around the median plane, and in order to limit the computational effort.
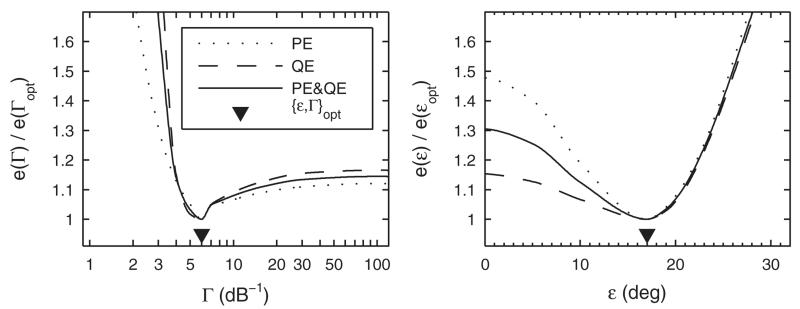
Figure 4 shows the joint and partial prediction residues scaled by the minimum residues as functions of either Γ or ε. When Γ was varied systematically (left panel), ε and Sl were optimal in terms of yielding minimum e for each tested Γ. The joint prediction residue was minimum at Γopt = 6 dB−1. For Γ < Γopt, the functions for both eQE and ePE steeply decrease, but for Γ < Γopt, the increase is less steep, especially for eQE. For ε (right panel), Γ was fixed to the optimum, Γopt = 6 dB−1, and only Sl was optimized for each tested ε. In this case, the functions are more different for the two error types. On the one hand, ePE as a function of ε showed a distinct minimum. On the other hand, eQE as a function of ε showed less effect for ε < 17°, because for small ε, non-local responses were relatively rare in the baseline condition. The joint metric was minimum at εopt = 17°. This scatter is similar to the unimodal response scatter of 17° observed by Langendijk and Bronkhorst (2002).
FIG. 4.
Model parameterization. Partial (ePE, eQE) and joint (e) prediction residues as functions of the degree of selectivity (Γ) and the motor response scatter (ε). Residue functions are normalized to the minimum residue obtained for the optimal parameter value. See text for details.
In conclusion, the experimental data was best described by the model with the parameters set to Γ = 6 dB−1, ε = 17°, and Sl according to Table I. Table I also lists the actual and predicted performance for all listeners within the lateral range of ±30°. On average across listeners, this setting leads to prediction residues of eQE = 1.7% and ePE = 2.4°, and the correlations between actual and predicted listener-specific performance are rQE = 0.97 and rPE = 0.84. The same parameter setting was used for all evaluations described in Sec. III.
TABLE I.
Listener-specific sensitivity, Sl, calibrated on the basis of N baseline targets in proximity of the median plane (±30°) with Γ = 6 dB−1 and ε = 17°. Listeners are listed by ID. Actual and predicted QE and PE are shown pairwise (Actual ∣ Predicted).
| ID | N | Sl | QE (%) | PE (deg) |
|---|---|---|---|---|
| NH12 | 1506 | 0.26 | 2.19 ∣ 3.28 | 27.7 ∣ 26.9 |
| NH14 | 140 | 0.58 | 5.00 ∣ 4.42 | 25.5 ∣ 26.1 |
| NH15 | 996 | 0.55 | 2.51 ∣ 5.76 | 33.3 ∣ 30.0 |
| NH16 | 960 | 0.63 | 5.83 ∣ 8.00 | 31.9 ∣ 28.9 |
| NH17 | 364 | 0.76 | 7.69 ∣ 8.99 | 33.8 ∣ 32.1 |
| NH18 | 310 | 1.05 | 20.0 ∣ 20.0 | 36.4 ∣ 36.4 |
| NH21 | 291 | 0.71 | 9.62 ∣ 10.0 | 34.0 ∣ 33.3 |
| NH22 | 266 | 0.70 | 10.2 ∣ 10.3 | 33.6 ∣ 33.4 |
| NH33 | 275 | 0.88 | 17.1 ∣ 17.8 | 35.7 ∣ 34.4 |
| NH39 | 484 | 0.86 | 10.7 ∣ 12.0 | 37.4 ∣ 35.5 |
| NH41 | 264 | 1.02 | 18.9 ∣ 17.7 | 37.1 ∣ 39.7 |
| NH42 | 300 | 0.44 | 3.67 ∣ 6.20 | 30.0 ∣ 27.1 |
| NH43 | 127 | 0.44 | 1.57 ∣ 6.46 | 34.0 ∣ 28.0 |
| NH46 | 127 | 0.46 | 3.94 ∣ 4.78 | 28.5 ∣ 27.5 |
| NH53 | 164 | 0.52 | 1.83 ∣ 3.42 | 26.5 ∣ 24.9 |
| NH55 | 123 | 0.88 | 9.76 ∣ 12.6 | 38.1 ∣ 33.4 |
| NH57 | 119 | 0.97 | 19.3 ∣ 16.8 | 28.0 ∣ 33.4 |
| NH58 | 153 | 0.21 | 1.96 ∣ 2.75 | 24.5 ∣ 23.8 |
| NH62 | 282 | 0.98 | 11.3 ∣ 13.2 | 38.6 ∣ 35.5 |
| NH64 | 306 | 0.84 | 9.48 ∣ 9.68 | 33.5 ∣ 33.1 |
| NH68 | 269 | 0.76 | 11.9 ∣ 11.7 | 32.4 ∣ 32.9 |
| NH71 | 104 | 0.76 | 9.62 ∣ 9.32 | 33.1 ∣ 33.5 |
| NH72 | 304 | 0.79 | 10.9 ∣ 12.6 | 38.0 ∣ 35.3 |
III. MODEL EVALUATION
Implicitly, the model evaluation has already begun in Sec. II, where the model was parameterized for the listener-specific baseline performance, showing encouraging results. In the present section, we further evaluate the model on predicting the effects of various HRTF modifications. First, predictions are presented for effects of band limitation, spectral warping (Majdak et al., 2013c), and spectral resolution (Goupell et al., 2010) on localization performance. For these studies, listener-specific DTFs, actual target positions, and the corresponding responses were available for all participants. Further, the pool (see Sec. II D) was used to model results of localization studies for which the listener-specific data were not available. In particular, the model was evaluated for the effects of non-individualized HRTFs (Middlebrooks, 1999b), spectral ripples (Macpherson and Middlebrooks, 2003), and high-frequency attenuation in speech localization (Best et al., 2005). Finally, we discuss the capability of the model for target-specific predictions.
A. Effect of band limitation and spectral warping
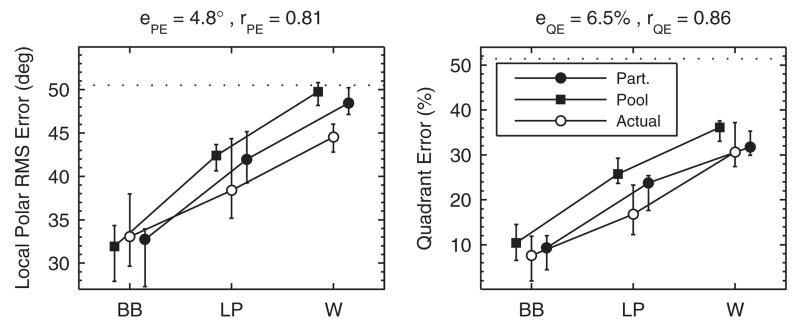
Majdak et al. (2013c) tested band limitation and spectral warping of HRTFs, motivated by the fact that stimulation in cochlear implants (CIs) is usually limited to frequencies up to about 8 kHz. This limitation discards a considerable amount of spectral information for accurate localization in sagittal planes. From an acoustical point of view, all spectral features can be preserved by spectrally warping the broadband DTFs into this limited frequency range. It is less clear, however, whether this transformation also preserves the perceptual salience of the features. Majdak et al. (2013c) tested the performance of localizing virtual sources within a lateral range of ±30° for the DTF conditions broad-band (BB), low-pass filtered (LP), and spectrally warped (W). In the LP condition the cutoff frequency was 8.5 kHz and in the W condition the frequency range from 2.8 to 16 kHz was warped to 2.8 to 8.5 kHz. On average, the 13 NH listeners performed best in the BB and worst in the W condition–see their Fig. 6 (pre-training). In the W condition, the overall performance even approached chance rate.
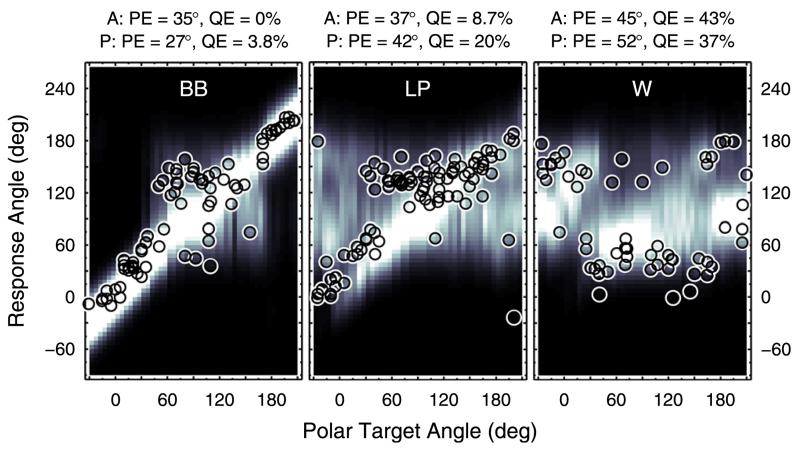
Model predictions were first evaluated on the basis of the participants’ individual DTFs and target positions. For the median plane, Fig. 5 shows the actual response patterns and the corresponding probabilistic response predictions for an exemplary listener in the three experimental conditions. Resulting performance measures are shown above each panel. The similarity between actual and predicted performance is reflected by the visual correspondence between actual responses and bright areas. For predictions considering also lateral targets, Fig. 6 summarizes the performance statistics of all participants. The large correlation coefficients and small prediction residues observed across all participants are in line with the results observed for the exemplary listener. However, there is a noteworthy discrepancy between actual and predicted local performance in the W condition. It seems that in this condition the actual listeners managed to access spatial cues, which were not considered in the model and allowed them to respond a little more accurately than predicted. For instance, interaural spectral differences might be potential cues in adverse listening conditions (Jin et al., 2004).
FIG. 5.
(Color online) Effect of band limitation and spectral warping. Actual responses and response predictions for listener NH12 in the BB, LP, and W condition from Majdak et al. (2013c). Data were pooled within ±15° of lateral angle. All other conventions are as in Fig. 3.
FIG. 6.
Effect of band limitation and spectral warping. Listeners were tested in conditions BB, LP, and W. Actual: Experimental results from Majdak et al. (2013c). Part.: Model predictions for the actual eight participants based on the actually tested target positions. Pool: Model predictions for our listener pool based on all possible target positions. Symbols and whiskers show median values and inter-quartile ranges, respectively. Symbols were horizontally shifted to avoid overlaps. Dotted horizontal lines represent chance rate. Correlation coefficients, r, and prediction residues, e, specify the correspondence between actual and predicted listener-specific performance.
Figure 6 also shows predictions for the listener pool. The predicted performance was only slightly different from that based on the participants’ individual DTFs and target positions. Thus, modeling on the basis of our listener pool seems to result in reasonable predictions even if the participants’ listener-specific data are unknown. However, the comparison is influenced by the fact that the actual participants are a rather large subset of the pool (13 of 23).
B. Effect of spectral resolution
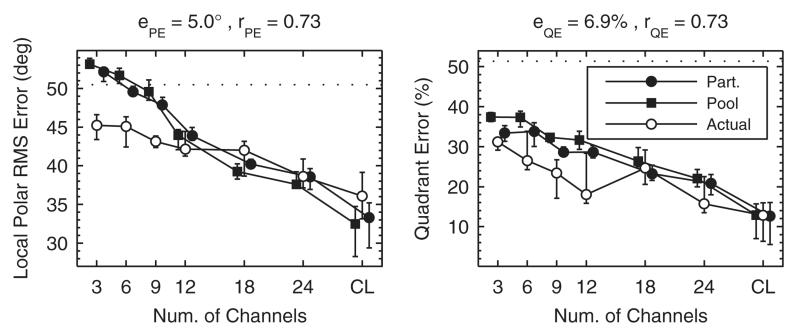
The localization model was also evaluated on the effect of spectral resolution as investigated by Goupell et al. (2010). This investigation was also motivated by CI listening, because typical CIs suffer from a poor spectral resolution within the available bandwidth due to the spread of electric stimulation. Goupell et al. (2010) simulated CI processing at NH listeners, because CI listeners are hard to test as they usually show large inter-individual differences in pathology. For the CI sound simulation, the investigators used a Gaussian-enveloped tone vocoder. In their experiment I, they examined localization performance in the median lateral range (±10°) with the number of vocoder channels as independent variable. To this end, they divided the frequency range from 0.3 to 16 kHz into 3, 6, 9, 12, 18, or 24 channels equally spaced on a logarithmic frequency scale. As a result, the listeners performed worse, the less channels were used—see their Fig. 3.
Our Fig. 7 shows corresponding model predictions for an exemplary listener in three of the seven conditions. Figure 8 shows predictions pooled across listeners for all experimental conditions. Both the listener-specific and pooled predictions showed a systematic degradation in localization performance with a decreasing number of spectral channels, similar to the actual results. However, at less than nine channels, the predicted local performance approached chance rate whereas the actual performance remained better. Thus, it seems that listeners were able to use additional cues that were not considered in the model.
FIG. 7.
(Color online) Effect of spectral resolution in terms of varying the number of spectral channels of a channel vocoder. Actual responses and response predictions for exemplary listener NH12. Results for 24, 9, and 3 channels are shown. All other conventions are as in Fig. 3.
FIG. 8.
Effect of spectral resolution in terms of varying the number of spectral channels of a channel vocoder. Actual experimental results are from Goupell et al. (2010). CL: Stimulation with broad-band click trains represents an unlimited number of channels. All other conventions are as in Fig. 6.
The actual participants from the present experiment, tested on spectral resolution, were a smaller subset of our pool (8 of 23) than in the experiment from Sec. III A (13 of 23), tested on band limitation and spectral warping. Nevertheless, predictions on the basis of the pool and unspecific target positions were again similar to the predictions based on the participants’ data. This strengthens the conclusion from Sec. III A that predictions are reasonable even when the participants’ listener-specific data are not available.
C. Effect of non-individualized HRTFs
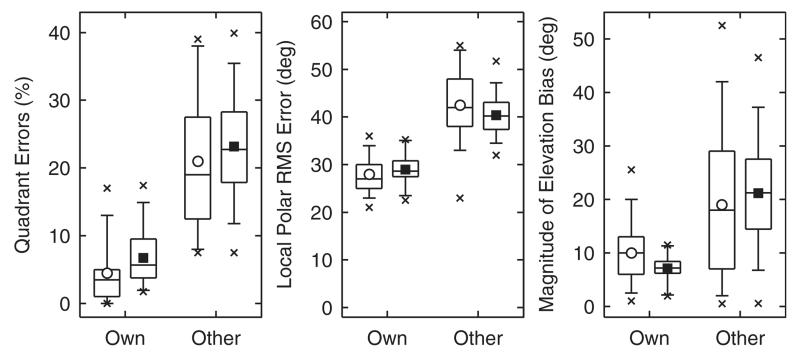
In this section, the model is applied to predict the effect of listening with non-individualized HRTFs, i.e., localizing sounds spatially filtered by the DTFs of another subject. Middlebrooks (1999b) tested 11 NH listeners localizing Gaussian noise bursts with a duration of 250 ms. The listeners were tested with targets spatially encoded by their own set of DTFs and also by up to 4 sets of DTFs from other subjects (21 cases in total). Targets were presented across the whole lateral range, but for the performance analysis in the polar dimension, only targets within the lateral range of ±30° were considered. Performance was measured by means of QE, PE, and the magnitude of elevation bias in local responses. For the bias analysis, Middlebrooks (1999b) excluded responses from upper-rear quadrants with the argumentation that there the lack of precision overshadowed the overall bias. In general, the study found degraded localization performance for non-individualized HRTFs.
Using the model, the performance of each listener of our pool was predicted for the listener’s own set of DTFs and for the sets from all other pool members. As the participants were not trained to localize with the DTFs from others, the target sounds were always compared to the listener’s own internal template set of DTFs. The predicted magnitude of elevation bias was computed as the expectancy value of the local bias averaged across all possible target positions outside the upper-rear quadrants. Figure 9 shows the experimental results replotted from Middlebrooks (1999b) and our model predictions. The statistics of predicted performance represented by means, medians, and percentiles appear to be quite similar to the statistics of the actual performance.
FIG. 9.
Effect of non-individualized HRTFs in terms of untrained localization with others’ instead of their own ears. Statistics summaries with open symbols represent actual experimental results replotted from Fig. 13 of Middlebrooks (1999b), statistics with filled symbols represent predicted results. Horizontal lines represent 25th, 50th, and 75th percentiles, the whiskers represent 5th and 95th percentiles, and crosses represent minima and maxima. Circles and squares denote mean values.
D. Effect of spectral ripples
Studies considered in Secs. III A–III C probed localization by using spectrally flat source signals. In contrast, Macpherson and Middlebrooks (2003) probed localization by using spectrally rippled noises in order to investigate how ripples in the source spectra interfere with directional cues. Ripples were generated within the spectral range of 1 to 16 kHz with a sinusoidal spectral shape in the log-magnitude domain. Ripple depth was defined as the peak-to-trough difference and ripple density as the period of the sinusoid along the logarithmic frequency scale. They tested six trained NH listeners in a dark, anechoic chamber. Targets were 250 ms long and presented via loudspeakers. Target positions ranged across the whole lateral dimension and within a range of ±60° elevation (front and back). Localization performance around the median plane was quantified by means of polar error rates. The definition of polar errors relied on an ad hoc selective, iterative regression procedure: First, regression lines for responses to baseline targets were fitted separately for front and back; then, responses farther than 45° away from the regression lines were counted as polar errors.
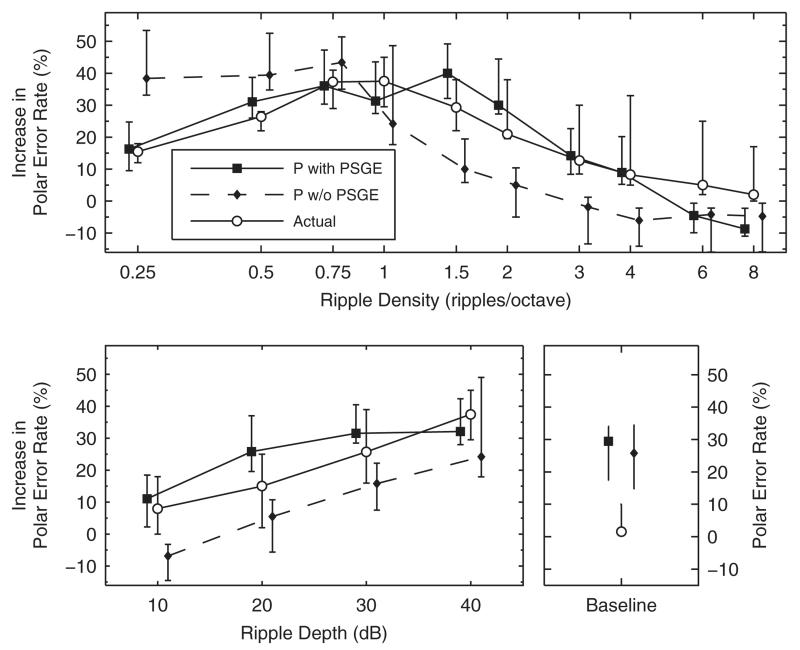
When the ripple depth was kept constant at 40 dB and the ripple density was varied between 0.25 and 8 ripples/octave, participants performed worst at densities around 1 ripple/octave—see their Fig. 6. When the ripple density was kept constant at 1 ripple/octave and the ripple depth was varied between 10 and 40 dB, consistent deterioration with increasing depth was observed—see their Fig. 9. Our Fig. 10 summarizes their results pooled across ripple phases (0 and π), because Macpherson and Middlebrooks (2003) did not observe systematic effects of the ripple phase across listeners. Polar error rates were evaluated relative to listener-specific baseline performance. The statistics of these listener-specific baseline performance are shown in the bottom right panel of Fig. 10.
FIG. 10.
Effect of spectral ripples. Actual experimental results (circles) are from Macpherson and Middlebrooks (2003). Predicted results (filled circles) were modeled for our listener pool (squares). Either the ripple depth of 40 dB (top) or the ripple density of 1 ripple/octave (bottom) was kept constant. Ordinates show the listener-specific difference in error rate between a test and the baseline condition. Baseline performance is shown in the bottom right panel. Symbols and whiskers show median values and inter-quartile ranges, respectively. Symbols were horizontally shifted to avoid overlaps. Diamonds show predictions of the model without positive spectral gradient extraction (P w/o PSGE), see Sec. IVA.
The effect of spectral ripples was modeled on the basis of our listener pool. The iteratively derived polar error rates were retrieved from the probabilistic response predictions by generating virtual response patterns. The model predicted moderate performance for the smallest densities tested, worst performance for ripple densities between 0.5 and 2 ripples/octave, and best performance for the largest densities tested. Further, the model predicted decreasing performance with increasing ripple depth. Thus, the model seems to qualitatively predict the actual results.
The baseline performance of the listeners tested by Macpherson and Middlebrooks (2003) were much better than those predicted for our pool members. It seems that in the free field scenario the trained listeners could use spatial cues that might have been absent in the virtual auditory space considered for the model parameterization (see Sec. II D). Moreover, the localization performance might be degraded by potential mismatches between free-field stimuli filtered acoustically and virtual auditory space stimuli created on the basis of measured HRTFs.
E. Effect of high-frequency attenuation in speech
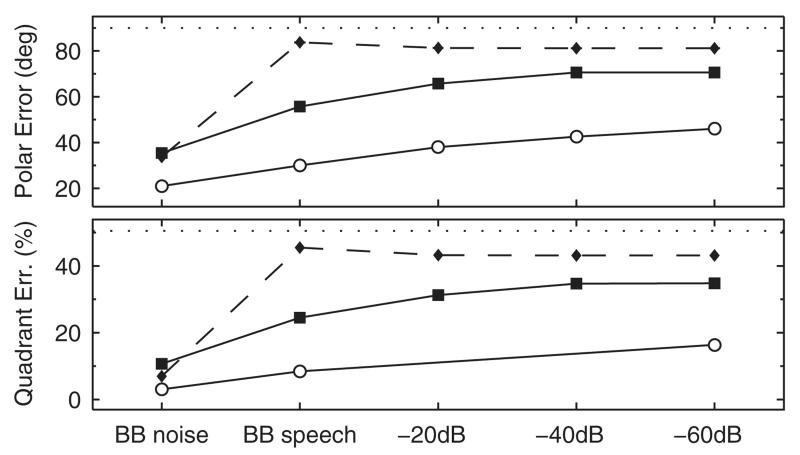
Best et al. (2005) tested localization performance for monosyllabic words from a broad-band (0.3 to 16 kHz) speech corpus. The duration of those 260 words ranged from 418 to 1005 ms with an average duration of 710 ms. The speech samples were attenuated by either 0, −20, −40, or −60 dB in the stop band. Broad-band noise bursts with a duration of 150 ms served as baseline targets. They tested five NH listeners in a virtual auditory space. All those listeners had prior experience in sound-localization experiments and were selected in terms of achieving a minimum performance threshold. Localization performance was quantified by means of absolute polar angle errors and QE, albeit QE only for a reduced set of conditions. The results showed gradually degrading localization performance with increasing attenuation of high-frequency content above 8 kHz—see their Fig. 10.
Corresponding model predictions were performed for the median plane by using the same speech stimuli. Absolute polar angle errors were computed by expectancy values. Figure 11 compares the model predictions with the actual results. The predictions represent quite well the relative effect of degrading localization performance with increasing attenuation.
FIG. 11.
Effect of high-frequency attenuation in speech localization. Actual experimental results are from Best et al. (2005). Absolute polar angle errors (top) and QE (bottom) were averaged across listeners. Circles and squares show actual and predicted results, respectively. Diamonds with dashed lines show predictions of the model without positive spectral gradient extraction—see Sec. IV A. Dotted horizontal lines represent chance rate.
The overall offset between their actual and our predicted performance probably results from the discrepancy in baseline performance; the listeners from Best et al. (2005) showed a mean QE of about 3% whereas the listeners from our pool showed about 9%. Another potential reason for prediction residues might be the fact that the stimuli were dynamic and the model integrates the spectral information of the target sound over its full duration. This potentially smears the spectral representation of the target sound and, thus, degrades its spatial uniqueness. In contrast, listeners seem to evaluate sounds in segments of a few milliseconds (Hofman and Opstal, 1998) allowing them to base their response on the most salient snapshot.
F. Target-specific predictions
The introduced performance measures assess the model predictions by integrating over a specific range of directions. However, it might also be interesting to evaluate the model predictions in a very local way, namely, for each individual trial obtained in an experiment. Thus, in this section we evaluate the target-specific predictions, i.e., the correspondence between the actual responses and the predicted response probabilities underlying those responses on a trial-by-trial basis. In order to quantify the correspondence, we used the likelihood analysis (Langendijk and Bronkhorst, 2002).
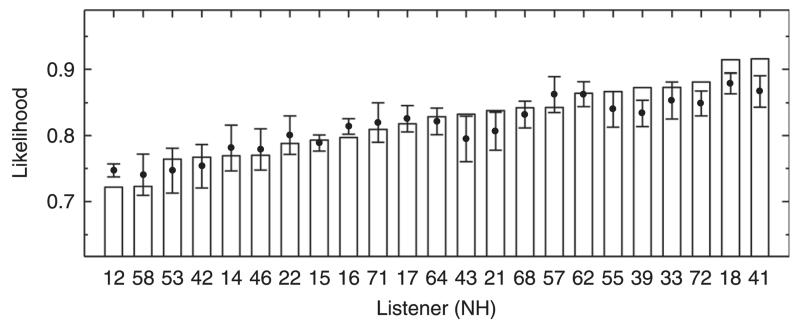
The likelihood represents the probability that a certain response pattern occurs given a model prediction [see Langendijk and Bronkhorst, 2002, their Eq. (1)]. In our evaluation, the likelihood analysis was used to investigate how well an actual response pattern fits to the model predictions compared to fits of response patterns generated by the model itself. In the comparison, two likelihoods are calculated for each listener. First, the actual likelihood was the log-likelihood of actual responses. Second, the expected likelihood was the average of 100 log-likelihoods of random responses drawn according to the predicted PMVs. The average accounted for the randomness in the model-based generation of response patterns from independently generated patterns. Finally, both actual and expected likelihoods were normalized by the chance likelihood in order to obtain likelihoods independent of the number of tested targets. The chance likelihood was calculated for actual responses given the same probability for all response angles, i.e., given a model without any directional information. Hence, expected likelihoods can range from 0 (model of unique response) to 1 (non-directional model). The actual likelihoods should be similar to the expected likelihoods, and the more consistent the actual responses are across trials, the smaller actual likelihoods can result.
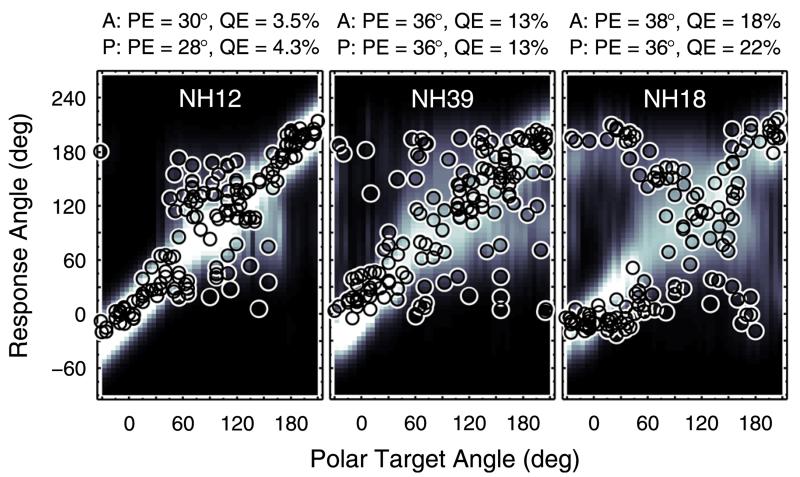
Figure 12 shows the likelihood statistics for all listeners of the pool tested in the baseline condition. Expected likelihoods are shown by means of tolerance intervals with a confidence level of 99% (Langendijk and Bronkhorst, 2002). For 15 listeners, the actual likelihoods were within the tolerance intervals of the expected likelihoods, indicating valid target-specific predictions; examples were shown in Fig. 3. For eight listeners, the actual likelihoods were outside the tolerance intervals indicating a potential issue in the target-specific predictions. From the PMVs of those latter eight listeners, three types of issues can be identified. Figure 13 shows examples for each of the three types in terms of PMVs and actual responses from exemplary listeners. NH12 and NH16, listeners of the first type (left panel), responded too seldom at directions for which the model predicted a high probability. A smaller motor response scatter, ε, might be able to better represent such listeners, suggesting listener-specific ε. On the other hand, NH39, NH21, and NH72, listeners of the second type (center panel), responded too often at directions for which the model predicted a low probability. These listeners actually responded quite inconsistently, indicating some procedural uncertainty or inattention during the localization task, an effect not captured by the model. NH18, NH41, and NH43, listeners of the third type, responded quite consistently for most of the target angles, but for certain regions, especially in the upper-front quadrant, actual responses clearly deviate from high probability regions.
FIG. 12.
Listener-specific likelihood statistics used to evaluate target-specific predictions for the baseline condition. Bars show actual likelihoods, dots show mean expected likelihoods, and whiskers show tolerance intervals with 99% confidence level of expected likelihoods.
FIG. 13.
(Color online) Exemplary baseline predictions. Same as Fig. 3 but for listeners where actual likelihoods were outside the tolerance intervals. See text for details.
The reasons for such deviations are unclear, but it seems that the spectro-to-spatial mapping is incomplete or misaligned somehow.
In summary, for about two-thirds of the listeners, the target-specific predictions were similar to actual localization responses in terms of likelihood statistics. For one-third of the listeners, the model would gain from more individualization, e.g., a listener-specific motor response scatter and the consideration of further factors, e.g., a spatial weighting accounting for a listener’s preference of specific directions.
In general, it is noteworthy that the experimental data we used here might not be appropriate for the current analysis. One big issue might be, for instance, that the participants were not instructed where to point when they were uncertain about the position. Some listeners might have used the strategy to point simply to the front and others might point to a position randomly chosen from case to case. The latter strategy is most consistent with the model assumption. Further, the likelihood analysis is very strict. A few actual responses being potentially outliers can have a strong impact on the actual likelihood, even in cases where most of the responses are in the correctly predicted range. Our performance measures considering a more global range of directions seem to be more robust to such outliers.
IV. EVALUATION AND DISCUSSION OF PARTICULAR MODEL COMPONENTS
The impact of particular model components on the predictive power of the model is discussed in the following. Note that modifications of the model structure require a new calibration of the model’s internal parameters. Hence, the listener-specific sensitivity, Sl, was recalibrated according to the parameterization criterion in Eq. (11) in order to assure optimal parameterization also for modified configurations.
A. Positive spectral gradient extraction
Auditory nerve fibers from the cochlea form synapses in the cochlear nucleus for the first time. In the cat DCN, tonotopically adjacent fibers are interlinked and form neural circuits sensitive to positive spectral gradients (Reiss and Young, 2005). This sensitivity potentially makes the coding of spectral spatial cues more robust to natural macroscopic variations of the spectral shape. Hence, positive spectral gradient extraction should be most important when localizing spectrally non-flat stimuli like, for instance, rippled noise bursts (Macpherson and Middlebrooks, 2003) or speech samples (Best et al., 2005).
To illustrate the role of the extraction stage in the proposed model, both experiments were modeled with and without the extraction stage. In the condition without extraction stage, the L1-norm was replaced by the standard deviation (Middlebrooks, 1999b; Langendijk and Bronkhorst, 2002; Baumgartner et al., 2013) because overall level differences between a target and the templates should not influence the distance metric. With the extraction stage, overall level differences are ignored by computing the spectral gradient. Figure 10 shows the effect of ripple density for model predictions either with or without extraction stage. The model without extraction stage (dashed lines) predicted the worst performance for densities smaller or equal than 0.75 ripples/octave and a monotonic performance improvement with increasing density. This deviates from the actual results from Macpherson and Middlebrooks (2003) and the predictions obtained by the model with extraction stage, both showing improved performance for macroscopic ripples below 1 ripple/octave. This deviation is supported by the correlation coefficient calculated for the 14 actual and predicted median polar error rates. The coefficient decreased from 0.89 to 0.73 when removing the extraction stage. Figure 11 shows a similar comparison for speech samples. The model with extraction stage predicted a gradual degradation with increasing attenuation of high frequency content, whereas the model without extraction stage failed to predict this gradual degradation; predicted performance was close to chance performance even for the broad-band speech. Thus, the extraction of positive spectral gradients seems to be an important model component in order to obtain plausible predictions for various spectral modifications.
Band limitation in terms of low-pass filtering is also a macroscopic modification of the spectral shape. Hence, the extraction stage should have a substantial impact on modeling localization performance for low-pass filtered sounds. In Baumgartner et al. (2013), a model was used to predict the experimental results for band-limited sounds from Majdak et al. (2013c) For that purpose, the internal bandwidth considered in the comparison process was manually adjusted according to the actual bandwidth of the stimulus. This means that prior knowledge of stimulus characteristics was necessary to parameterize the model. In the proposed model, the extraction stage is supposed to automatically account for the stimulus bandwidth. To test this assumption, model predictions for the experiment from Majdak et al. (2013c) were performed by using four different model configurations: With or without extraction stage and with or without manual bandwidth adjustment. Table II lists the resulting partial prediction residues. Friedman’s analysis of variance was used to compare the joint prediction residues, e, between the four model configurations. The configurations were separately analyzed for each experimental condition (BB, LP, and W). The differences were significant for the LP (χ2 = 19.43, p < 0.001) condition, but not significant for the BB (χ2 = 5.77, p = 0.12) and W (χ2 = 2.82, p = 0.42) conditions. The Tukey’s honestly significant difference post hoc test showed that in the LP condition the model without extraction stage and without bandwidth adjustment performed significantly worse than all other model configurations (p < 0.05). In contrast, the model with the extraction stage and without manual adjustment yielded results similar to the models with adjustment (p ≫ 0.05). This shows the relevance of extracting positive spectral gradients in a sagittal-plane localization model in terms of automatic bandwidth compensation.
TABLE II.
The effects of model configurations on the prediction residues. PSGE: Model with or without positive spectral gradient extraction. MBA: Model with or without manual bandwidth adjustment to the stimulus bandwidth. Prediction residues (ePE, eQE) between actual and predicted PE and QE are listed for acute performance with the BB, LP, and W conditions of the experiments from Majdak et al. (2013c)
| BB |
LP |
W |
|||||
|---|---|---|---|---|---|---|---|
| PSGE | MBA | e PE | e QE | e PE | e QE | e PE | e QE |
| Yes | no | 3.4° | 2.9% | 4.5° | 7.6% | 6.2° | 7.7% |
| Yes | yes | 3.4° | 2.9% | 5.6° | 7.8% | 4.8° | 7.4% |
| No | no | 2.1° | 2.8% | 10.1° | 23.9% | 5.3° | 12.6% |
| No | yes | 2.1° | 2.8% | 3.9° | 7.7% | 5.3° | 8.1% |
B. Sensorimotor mapping
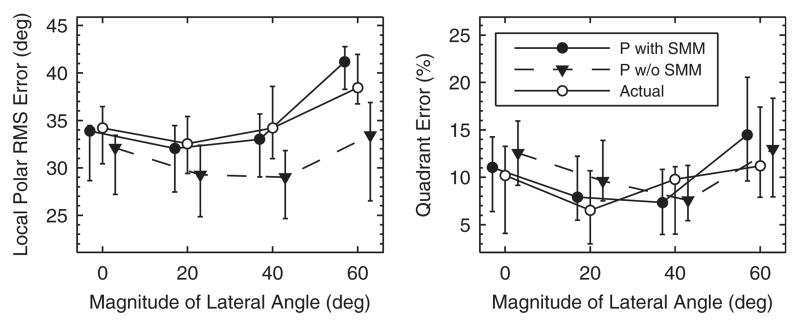
The sensorimotor mapping stage addresses the listeners’ sensorimotor uncertainty in a pointing task. For instance, two spatially close DTFs might exhibit quite large spectral differences. However, even though the listener might perceive the sound at two different locations, he/she would unlikely be able to consistently point to two different directions because of a motor error in pointing the direction. In general, this motor error also increases in the polar dimension with increasing magnitude of the lateral angle.
The importance of the sensorimotor mapping stage is demonstrated by comparing baseline predictions with and without response scatter, i.e., ε = 17° and ε = 0°, respectively. Baseline performance was measured as a function of the lateral angle and results were pooled between the left- and right-hand side. Figure 14 shows that the actual performance was worse at the most lateral angles. The performance predicted with the model including the mapping stage followed this trend. The exclusion of the mapping stage, however, degraded the prediction accuracy; prediction residues rose from ePE = 3.4° to ePE = 5.5° and eQE = 3.4% to eQE = 3.9%, and correlation coefficients dropped from rPE = 0.72 to rPE = 0.64 or stayed the same in the case of QE (rQE = 0.81). Figure 14 further shows that the exclusion particularly degraded the local performance predictions for most lateral directions. Hence, the model benefits from the sensorimotor mapping stage especially for predictions beyond the median plane.
FIG. 14.
Baseline performance as a function of the magnitude of the lateral response angle. Symbols and whiskers show median values and interquartile ranges, respectively. Open symbols represent actual and closed symbols predicted results. Symbols were horizontally shifted to avoid overlaps. Triangles show predictions of the model without the sensorimotor mapping stage (P w/o SMM).
C. Binaural weighting
Several studies have shown that the monaural spectral information is weighted binaurally according to the perceived lateral angle (Morimoto, 2001; Hofman and Van Opstal, 2003; Macpherson and Sabin, 2007). It remained unclear, however, whether the larger weighting of the ipsilateral information is beneficial in terms of providing more spectral cues or whether it is simply the larger gain that makes the ipsilateral information more reliable. We investigated this question by performing baseline predictions for various binaural weighting coefficients, Φ. Three different values of Φ were compared, namely, Φ = 13° according to the optimal binaural weighting coefficient found in Sec. II D, and Φ → ±0° meaning that only the ipsilateral resp. contralateral information is considered.
Table III shows the prediction residues, correlation coefficients, and predicted average performance for the three configurations. The differences between configurations are surprisingly small for all parameters. The negligible differences of residues and correlations show that realistic binaural weighting is rather irrelevant for accurate model predictions, because the ipsi- and contralateral ear seem to contain similar spatial information. The small differences in average performance also indicate that, if at all, the contralateral path provides only little less spectral cues than the ipsilateral path. Consequently, a larger ipsilateral weighting seems to be beneficial mostly in terms of larger gain.
TABLE III.
Performance predictions for binaural, ipsilateral, and contralateral listening conditions. The binaural weighting coefficient, Φ, was varied in order to represent the three conditions: Binaural: Φ = 13°; ipsilateral: Φ → +0°; contralateral: Φ → −0°. Prediction residues (ePE, eQE) and correlation coefficients (rPE, rQE) between actual and predicted results are shown together with predicted average performance ().
| e PE | e QE | r PE | r QE | |||
|---|---|---|---|---|---|---|
| Binaural | 3.4° | 3.4% | 0.72 | 0.81 | 32.6° | 9.4% |
| Ipsilateral | 3.4° | 3.4% | 0.72 | 0.80 | 32.5° | 9.2% |
| Contralateral | 3.3° | 4.7% | 0.71 | 0.77 | 32.6° | 10.6% |
V. CONCLUSIONS
A sagittal-plane localization model was proposed and evaluated under various experimental conditions, testing localization performance for single, motionless sound sources with high-frequency content at moderate intensities. In total, predicted performance correlated well with actual performance, but the model tended to underestimate local performance in very challenging experimental conditions. Detailed evaluations of particular model components showed that (1) positive spectral gradient extraction is important for localization robustness to spectrally macroscopic variations of the source signal, (2) listeners’ sensorimotor mapping is relevant for predictions especially beyond the median plane, and (3) contralateral spectral features are only marginally less pronounced than ipsilateral features. The prediction results demonstrated the potential of the model for practical applications, for instance, to assess the quality of spatial cues for the design of hearing assistive devices or surround-sound systems (Baumgartner et al., 2013).
However, there are several limitations of the current model. To name a few, the model cannot explain phase effects on elevation perception (Hartmann et al., 2010). Also the effects of dynamic cues like those resulting from moving sources or head rotations were not considered (Vliegen et al., 2004; Macpherson, 2013). Furthermore, the gammatone filterbank used to approximate cochlear filtering is linear and thus, the present model cannot account for known effects of sound intensity (Vliegen and Opstal, 2004). Future work will also need to be done in the context of modeling dynamic aspects of plasticity due to training (Hofman et al., 1998; Majdak et al., 2010, 2013c) or the influence of cross-modal information (Lewald and Getzmann, 2006).
The present model concept can serve as a starting point to incorporate those features. The first steps, for instance, toward modeling effects of sound intensity, have already been taken (Majdak et al., 2013a). Reproducibility is inevitable in order to reach the goal of a widely applicable model. Thus, the implementation of the model (baumgartner2014) and the modeled experiments (exp_baumgartner2014) are provided in the Auditory Modeling Toolbox (Søndergaard and Majdak, 2013).
ACKNOWLEDGMENTS
We thank Virginia Best and Craig Jin for kindly providing their speech data. We also thank Katherine Tiede for proofreading and Christian Kasess for fruitful discussions on statistics. This research was supported by the Austrian Science Fund (FWF, projects P 24124 and M 1230).
Footnotes
PACS number(s): 43.66.Qp, 43.66.Ba, 43.66.Pn [JFC]
References
- Agterberg MJ, Snik AF, Hol MK, Wanrooij MMV, Opstal AJV. Contribution of monaural and binaural cues to sound localization in listeners with acquired unilateral conductive hearing loss: Improved directional hearing with a bone-conduction device. Hear. Res. 2012;286:9–18. doi: 10.1016/j.heares.2012.02.012. [DOI] [PubMed] [Google Scholar]
- Algazi VR, Avendano C, Duda RO. Elevation localization and head-related transfer function analysis at low frequencies. J. Acoust. Soc. Am. 2001;109:1110–1122. doi: 10.1121/1.1349185. [DOI] [PubMed] [Google Scholar]
- Andéol G, Macpherson EA, Sabin AT. Sound localization in noise and sensitivity to spectral shape. Hear. Res. 2013;304:20–27. doi: 10.1016/j.heares.2013.06.001. [DOI] [PubMed] [Google Scholar]
- Baumgartner R, Majdak P, Laback B. Assessment of sagittal-plane sound localization performance in spatial-audio applications. In: Blauert J, editor. The Technology of Binaural Listening. Springer; Berlin-Heidelberg: 2013. Chap. 4. [Google Scholar]
- Best V, Carlile S, Jin C, van Schaik A. The role of high frequencies in speech localization. J. Acoust. Soc. Am. 2005;118:353–363. doi: 10.1121/1.1926107. [DOI] [PubMed] [Google Scholar]
- Bizley JK, Nodal FR, Parsons CH, King AJ. Role of auditory cortex in sound localization in the mid-sagittal plane. J. Neurophysiol. 2007;98:1763–1774. doi: 10.1152/jn.00444.2007. [DOI] [PMC free article] [PubMed] [Google Scholar]
- Blauert J. Sound localization in the median plane. Acta Acust. Acust. 1969;22:205–213. [Google Scholar]
- Goupell MJ, Majdak P, Laback B. Median-plane sound localization as a function of the number of spectral channels using a channel vocoder. J. Acoust. Soc. Am. 2010;127:990–1001. doi: 10.1121/1.3283014. [DOI] [PMC free article] [PubMed] [Google Scholar]
- Hartmann WM, Best V, Leung J, Carlile S. Phase effects on the perceived elevation of complex tones. J. Acoust. Soc. Am. 2010;127:3060–3072. doi: 10.1121/1.3372753. [DOI] [PMC free article] [PubMed] [Google Scholar]
- Hebrank J, Wright D. Spectral cues used in the localization of sound sources on the median plane. J. Acoust. Soc. Am. 1974;56:1829–1834. doi: 10.1121/1.1903520. [DOI] [PubMed] [Google Scholar]
- Hofman M, Van Opstal J. Binaural weighting of pinna cues in human sound localization. Exp. Brain Res. 2003;148:458–470. doi: 10.1007/s00221-002-1320-5. [DOI] [PubMed] [Google Scholar]
- Hofman PM, Opstal AJV. Spectro-temporal factors in two-dimensional human sound localization. J. Acoust. Soc. Am. 1998;103:2634–2648. doi: 10.1121/1.422784. [DOI] [PubMed] [Google Scholar]
- Hofman PM, van Riswick JGA, van Opstal AJ. Relearning sound localization with new ears. Nature Neurosci. 1998;1:417–421. doi: 10.1038/1633. [DOI] [PubMed] [Google Scholar]
- Jin C, Corderoy A, Carlile S, van Schaik A. Contrasting monaural and interaural spectral cues for human sound localization. J. Acoust. Soc. Am. 2004;115:3124–3141. doi: 10.1121/1.1736649. [DOI] [PubMed] [Google Scholar]
- Jin C, Schenkel M, Carlile S. Neural system identification model of human sound localization. J. Acoust. Soc. Am. 2000;108:1215–1235. doi: 10.1121/1.1288411. [DOI] [PubMed] [Google Scholar]
- King AJ. The superior colliculus. Curr. Biol. 2004;14:R335–R338. doi: 10.1016/j.cub.2004.04.018. [DOI] [PubMed] [Google Scholar]
- Kistler DJ, Wightman FL. A model of head-related transfer functions based on principal components analysis and minimum-phase reconstruction. J. Acoust. Soc. Am. 1992;91:1637–1647. doi: 10.1121/1.402444. [DOI] [PubMed] [Google Scholar]
- Langendijk EHA, Bronkhorst AW. Contribution of spectral cues to human sound localization. J. Acoust. Soc. Am. 2002;112:1583–1596. doi: 10.1121/1.1501901. [DOI] [PubMed] [Google Scholar]
- Lewald J, Getzmann S. Horizontal and vertical effects of eye-position on sound localization. Hear. Res. 2006;213:99–106. doi: 10.1016/j.heares.2006.01.001. [DOI] [PubMed] [Google Scholar]
- Lyon RF. All-pole models of auditory filtering. In: Lewis ER, Long GR, Lyon RF, Narins PM, Steele CR, Hecht-Poinar E, editors. Diversity in Auditory Mechanics. World Scientific Publishing; Singapore: 1997. pp. 205–211. [Google Scholar]
- Macpherson EA. Cue weighting and vestibular mediation of temporal dynamics in sound localization via head rotation. POMA. 2013;19:050131. [Google Scholar]
- Macpherson EA, Middlebrooks JC. Listener weighting of cues for lateral angle: The duplex theory of sound localization revisited. J. Acoust. Soc. Am. 2002;111:2219–2236. doi: 10.1121/1.1471898. [DOI] [PubMed] [Google Scholar]
- Macpherson EA, Middlebrooks JC. Vertical-plane sound localization probed with ripple-spectrum noise. J. Acoust. Soc. Am. 2003;114:430–445. doi: 10.1121/1.1582174. [DOI] [PubMed] [Google Scholar]
- Macpherson EA, Sabin AT. Binaural weighting of monaural spectral cues for sound localization. J. Acoust. Soc. Am. 2007;121:3677–3688. doi: 10.1121/1.2722048. [DOI] [PubMed] [Google Scholar]
- Majdak P, Baumgartner R, Laback B. Acoustic and non-acoustic factors in modeling listener-specific performance of sagittal-plane sound localization. Front Psychol. 2014;5:319. doi: 10.3389/fpsyg.2014.00319. doi:10.3389/fpsyg.2014.00319. [DOI] [PMC free article] [PubMed] [Google Scholar]
- Majdak P, Baumgartner R, Necciari T, Laback B. Sound localization in sagittal planes: Modeling the level dependence. poster presented at the 36th Mid-Winter Meeting of the ARO; Baltimore, MD. [Last viewed June 13, 2014]. 2013a. http://www.kfs.oeaw.ac.at/doc/public/ARO2013.pdf. [Google Scholar]
- Majdak P, Goupell MJ, Laback B. 3-D localization of virtual sound sources: Effects of visual environment, pointing method, and training. Atten. Percept. Psycho. 2010;72:454–469. doi: 10.3758/APP.72.2.454. [DOI] [PMC free article] [PubMed] [Google Scholar]
- Majdak P, Masiero B, Fels J. Sound localization in individualized and non-individualized crosstalk cancellation systems. J. Acoust. Soc. Am. 2013b;133:2055–2068. doi: 10.1121/1.4792355. [DOI] [PubMed] [Google Scholar]
- Majdak P, Walder T, Laback B. Effect of long-term training on sound localization performance with spectrally warped and band-limited head-related transfer functions. J. Acoust. Soc. Am. 2013c;134:2148–2159. doi: 10.1121/1.4816543. [DOI] [PubMed] [Google Scholar]
- May BJ. Role of the dorsal cochlear nucleus in the sound localization behavior of cats. Hear. Res. 2000;148:74–87. doi: 10.1016/s0378-5955(00)00142-8. [DOI] [PubMed] [Google Scholar]
- Middlebrooks JC. Narrowband sound localization related to external ear acoustics. J. Acoust. Soc. Am. 1992;92:2607–2624. doi: 10.1121/1.404400. [DOI] [PubMed] [Google Scholar]
- Middlebrooks JC. Individual differences in external-ear transfer functions reduced by scaling in frequency. J. Acoust. Soc. Am. 1999a;106:1480–1492. doi: 10.1121/1.427176. [DOI] [PubMed] [Google Scholar]
- Middlebrooks JC. Virtual localization improved by scaling non-individualized external-ear transfer functions in frequency. J. Acoust. Soc. Am. 1999b;106:1493–1510. doi: 10.1121/1.427147. [DOI] [PubMed] [Google Scholar]
- Møller H, Sørensen MF, Hammershøi D, Jensen CB. Head-related transfer functions of human subjects. J. Audio Eng. Soc. 1995;43:300–321. [Google Scholar]
- Morimoto M. The contribution of two ears to the perception of vertical angle in sagittal planes. J. Acoust. Soc. Am. 2001;109:1596–1603. doi: 10.1121/1.1352084. [DOI] [PubMed] [Google Scholar]
- Redon C, Hay L. Role of visual context and oculomotor conditions in pointing accuracy. Neuro Report. 2005;16:2065–2067. doi: 10.1097/00001756-200512190-00020. [DOI] [PubMed] [Google Scholar]
- Reiss LAJ, Young ED. Spectral edge sensitivity in neural circuits of the dorsal cochlear nucleus. J. Neurosci. 2005;25:3680–3691. doi: 10.1523/JNEUROSCI.4963-04.2005. [DOI] [PMC free article] [PubMed] [Google Scholar]
- Søndergaard P, Majdak P. The auditory modeling toolbox. In: Blauert J, editor. The Technology of Binaural Listening. Springer; Berlin-Heidelberg: 2013. Chap. 2. [Google Scholar]
- Unoki M, Irino T, Glasberg B, Moore BCJ, Patterson RD. Comparison of the roex and gammachirp filters as representations of the auditory filter. J. Acoust. Soc. Am. 2006;120:1474–1492. doi: 10.1121/1.2228539. [DOI] [PMC free article] [PubMed] [Google Scholar]
- van Wanrooij MM, van Opstal AJ. Relearning sound localization with a new ear. J. Neurosci. 2005;25:5413–5424. doi: 10.1523/JNEUROSCI.0850-05.2005. [DOI] [PMC free article] [PubMed] [Google Scholar]
- Vliegen J, Opstal AJV. The influence of duration and level on human sound localization. J. Acoust. Soc. Am. 2004;115:1705–1713. doi: 10.1121/1.1687423. [DOI] [PubMed] [Google Scholar]
- Vliegen J, Van Grootel TJ, Van Opstal AJ. Dynamic sound localization during rapid eye-head gaze shifts. J. Neurosci. 2004;24:9291–9302. doi: 10.1523/JNEUROSCI.2671-04.2004. [DOI] [PMC free article] [PubMed] [Google Scholar]
- Zakarauskas P, Cynader MS. A computational theory of spectral cue localization. J. Acoust. Soc. Am. 1993;94:1323–1331. [Google Scholar]
- Zhang PX, Hartmann WM. On the ability of human listeners to distinguish between front and back. Hear. Res. 2010;260:30–46. doi: 10.1016/j.heares.2009.11.001. [DOI] [PMC free article] [PubMed] [Google Scholar]


