Abstract
Objective
This research explores participatory evidence-based teaching methods in a health science course to see if a relationship emerged between the level of student participation and course performance, the type of participation and course performance, or the amount of participation and course performance and level of demonstrated learning.
Methods
Level of student participation was dichotomous (100% or <100%), and differences between groups on a knowledge test were compared using an unpaired t test. Type of participation was also dichotomous (in class or out), and differences in course performance on the knowledge test were compared using the unpaired t test. Amount of participation and course performance and level of demonstrated learning were also tested after the knowledge test was measured using a matrix based upon Bloom's taxonomy.
Results
Students who participated 100% of the time scored 6% higher on average than students with less than 100% participation (t[183] = 3.55, p = .0005, d = 0.52). There was no difference between groups when assessing for differences in course performance by type of participation. Students with 100% participation scored higher on the short answer question section of the examination (t[183] = 4.58, p = .0001, d = 0.68), but there was no difference on the multiple choice question part of the examination.
Conclusion
Full participation in the course was related to higher examination scores and higher scores on examination questions assessing higher levels in the cognitive domain.
Key Indexing Terms: Chiropractic, Education, Teaching
INTRODUCTION
Health science educational institutions are challenged to meet the demands of contemporary learners within a traditional professional learning environment.1 At our institution the application of evidence-based teaching (EBT) strategies within a learning-centered framework is being explored as one means to meet this challenge.2,3 Evidence-based teaching entails the use of empirically validated pedagogical tools and techniques that promote student learning.4
Learning is an active process of making sense of what has been taught. Active student participation involves more than just listening; it refers to when students must read, write, discuss, create, or be engaged in solving problems.5 Stowell and Nelson provide evidence that learning and performance may be improved by increasing active student participation.6 In the traditional lecture environment, opportunities for student interaction and active participation are limited, resulting largely in a passive student learning environment, which research is suggesting is not evidence based.6 In recent years, many instructors have tried to increase active student participation in their lectures by incorporating strategies such as traditional question and answer periods, use of paper response cards, or the more contemporary use of electronic audience response systems (ARS).7
A significant limitation of these methods is that they are targeted only to those students who attend class. In an ideal learning context, students would attend all classes in an environment that promotes active learning. However, students are not always able to attend class, and sometimes the environment does not promote active learning. To meet the needs of learners within an EBT context, instructors may need to optimize active participation within and perhaps beyond the classroom to enhance learning. To examine if such optimization is necessary, this retrospective study explores 2 self-selected forms of student participation and their association with course performance. Two different types of participation, 1 within and 1 beyond the classroom, are compared to academic performance and levels of demonstrated learning in an undergraduate health science educational setting. The authors sought to determine if a relationship emerged between (1) level of participation and course performance, (2) type of participation (in class or out) and course performance, (3) amount of participation, course performance, and level of demonstrated learning.
METHODS
This study was a retrospective review of data from a 3rd-year chiropractic program applied science course and was approved by the research and ethics review board at Canadian Memorial Chiropractic College (REB approval no. 1108X05). Five 2-hour lectures were delivered over an 8-week period at the beginning of the academic year and 2 lab hours toward the end of the academic year. The lecture content was assessed with a written examination. The lab was formatively assessed, and students received a complete or incomplete for their attendance. For the purpose of this study, the focus was on the examination of the lecture component only. An evaluation plan was implemented in the 2011–2012 academic year in which 15% of the total grade was allocated for participation. Marks were awarded for participation either in class, via an ARS, or by submitting an assignment related to the session content within 2 weeks of each session not attended. Students were allowed the freedom to self-select their method and level of participation for the duration of the course with no coercion. The marks for the entire class (n = 185) were retrospectively analyzed to determine if there was a relationship between the type and level of student participation and the level of performance on the final written exam. The exam consisted of 2 sections: 34 multiple choice questions (MCQ) worth 34 points and a series of clinical vignettes with 5 short answer questions (SAQ) that required handwritten responses less than 1 page each for a total of 34 points.
To evaluate the level of student participation and its relation to exam performance, 2 groups were formed and their performance compared using unpaired t tests. One group consisted of the students who earned 100% for participation marks, and the 2nd group consisted of the students who earned less than 100% for participation marks. All t tests were performed using QuickCalcs unpaired t test calculator (GraphPad Software, La Jolla, CA).
To evaluate the type of student participation and its relation to exam performance we controlled for the level of participation by examining only the students that participated 100% of the time. This group was further subdivided into 2 groups and their performance compared using unpaired t tests. One group consisted of the students who participated entirely in class, and the other group consisted of the students who participated using a mixture of the in-class and assignment methods.
To examine the level of demonstrated learning, the exam questions were objectively measured utilizing a matrix based on Bloom's revised taxonomy.8 The amount of student participation between 2 subgroups was compared to the ratings on the MCQ and SAQ sections to understand the level of demonstrated learning for each section. The same groups used to compare the amount of student participation and its relation to exam performance were used for this comparison.
RESULTS
Level of Participation and Course Performance
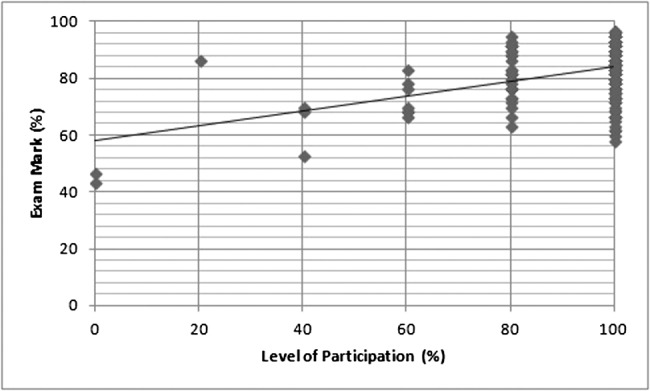
Of the 185 students, 144 earned 100% participation marks, and 41 earned less than 100% for participation. A scatter plot of participation marks is presented in Figure 1. Students who participated 100% of the time, through in-class or out-of-class assignments, outperformed those who participated 80% of the time or less. Students who participated 100% of the time scored 6.1% higher on average than students with less than 100% participation (t[183] = 3.55, p = .0005, d = 0.52). Table 1 shows the results by type of participation and performance.
Figure 1.

Level of participation and exam mark in percentages.
Table 1.
Level of Participation and Course Performance
|
Participation Level |
No. |
Mean |
Standard Deviation |
p
Value |
| MCQ | ||||
| 100% | 144 | 79.12 | 8.94 | .182 |
| 80% and less | 41 | 76.95 | 9.93 | |
| SAQ | ||||
| 100% | 144 | 89.21 | 12.49 | <.0001 |
| 80% and less | 41 | 77.95 | 18.04 | |
| Total mark | ||||
| 100% | 144 | 83.46 | 8.86 | .0005 |
| 80% and less | 41 | 77.38 | 12.11 |
MCQ indicates multiple choice questions; SAQ, short answer questions.
Type of Participation and Course Performance
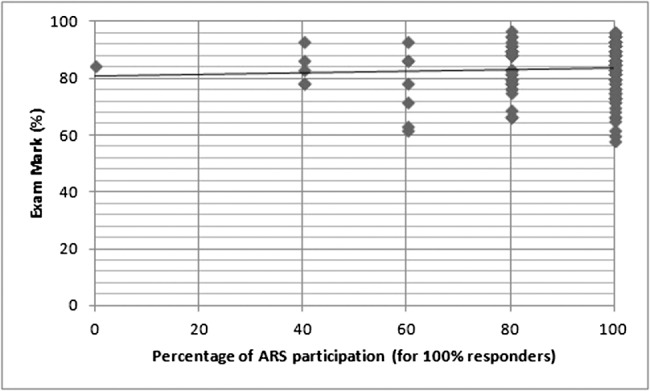
Of the 185 students enrolled, 144 students received 100% participation marks: 95 students participated entirely in class, and 49 students participated using a mixture of the in-class and assignment methods (Fig. 2). In reviewing the total exam marks we found that there was an insignificant difference (0.8%) between the in-class participants and students who used a mixture of in-class participation and assignments (t[142] = 0.53, p = .61, d = 0.09). There was also no significant difference in performance between in-class participants and the mixed-methods participants when breaking down the type of knowledge test. When looking at just the MCQ section, the difference in performance between in-class participants and mixed-methods students was not significant (1.8%, t[142] = 1.12, p = .25, d = 0.19), with similar results found for the SAQ (0.5%, t[142] = 0.24, p = .81, d = 0.04. See Table 2 for a summary of the results.
Figure 2.

Type of participation in percentage of audience response system use and exam mark.
Table 2.
Type of Participation and Course Performance
|
In Class |
Out of Class |
No. |
Mean |
Standard Deviation |
p
Value |
| MCQ | |||||
| 100% | 0% | 95 | 79.74 | 8.66 | .242 |
| 80% and less | 20% and more | 49 | 77.92 | 9.42 | |
| SAQ | |||||
| 100% | 0% | 95 | 89.03 | 12.92 | .810 |
| 80% and less | 20% and more | 49 | 89.56 | 11.75 | |
| Total mark | |||||
| 100% | 0% | 95 | 83.73 | 8.93 | .606 |
| 80% and less | 20% and more | 49 | 82.93 | 8.79 |
MCQ indicates multiple choice questions; SAQ, short answer questions.
Level of Participation, Course Performance, and Level of Demonstrated Learning
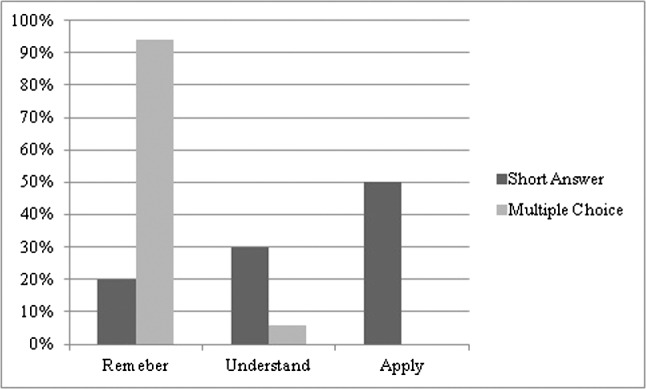
The final exam questions were analyzed and the tested level of learning categorized in relation to Bloom's revised taxonomy.8 The analysis demonstrated that the MCQs tested only the lowest levels of learning that relate to more basic recall of information (“remember” 94% and “understand” 6%). The SAQs tested higher levels of learning at the “application” level (50%) and tested the lower levels of learning to “understand” (30%) and “remember” (20%) to a lesser extent (Fig. 3).
Figure 3.

Exam questions broken down by the level of learning tested on the final exam.
Using the same participation grouping as previously described (100% participation vs. <100%), when breaking the total exam mark down further, there was a larger difference in the SAQ compared to the MCQ sections. The SAQ section had statistical significance, with the 100% participators scoring 11.26% higher (t[183] = 4.58, p = .0001, d = 0.68); however, the MCQ section was not significant, with 100% participators scoring only 2.17% higher (t[183] = 1.34, p =.18, d = 0.20). Table 3 provides data pertaining to the type of assessment, level of learning tested, and performance by group.
Table 3.
Level of Participation, Course Performance, and Level of Demonstrated Learning
|
Type of Question |
Participation Level/Student Performance |
% of Test Questions at Level of Bloom |
|||
|
100% Participation |
≤80% Participation |
Remember |
Understand |
Apply |
|
| MCQ | 79.1% | 77.0% | 94% | 6% | 0% |
| SAQ | 89.2% | 78.0% | 20% | 30% | 50% |
MCQ indicates multiple choice questions; SAQ, short answer questions.
DISCUSSION
Level of Participation and Course Performance
The overall participation of students indicates that as their participation decreases, so does performance on the final exam. With the exception of 1 outlier, findings were consistent and support current EBT research.9 This is congruent with current research in which active participation has been found to increase students' learning performance.7,10
The goal of participation is to engage students in learning course material. Our data suggest that learning occurs beyond attendance in the classroom. It is believed that having a highly structured and timed assignment process helped learners stay up-to-date on material presented in class due to the submission dates for the assignments. This approach created a very active, learner-centered environment in which learners were able to self-direct their approach to engaging with course materials, opting for what met their learning styles, preferences, and other demands on their time.11 This approach also allowed the teacher to better support student learning by presenting multiple approaches to actively participating in learning. In using such an approach, faculty members need to explore ways to shift teaching practice to be less reliant on traditional transmittal methods.
Type of Participation and Course Performance
For those students participating 100% of the time, the type of participation did not seem to have an effect on their performance, as both groups performed equally well. This may mean that active participation in a course may be more important for student success than just attending class. Participation in a class utilizing an ARS to respond to questions that reinforced content and checked understanding allowed learners to actively engage with course materials. Those who chose not to attend but who completed the assigned homework related to course content were also able to engage actively with course materials. In both cases it is believed that the EBT strategies utilized, including homework, practice, reinforcement, and checking for understanding, promoted more active engagement in the course.9 This shows that students do not necessarily have to be in class in order to learn.12
Level of Participation, Course Performance, and Level of Demonstrated Learning
In this study the amount of active participation through in-class use of ARS or through out-of-class assignments resulted equally in higher-level student learning. When comparing the different sections of the exam, statistically significant lower test scores were seen only in the SAQs and the total exam mark sections. Conversely, there was no statistical difference found between the multiple choice marks for the groups. It is believed that this can be attributed to the higher levels of understanding tested by the SAQ. As such, these data suggest that the amount of participation is positively related to attaining higher levels of understanding, with those participating more demonstrating higher levels of learning. This, too, is supported by current EBT research.9
Limitations
This study has a number of limitations that may impact its generalizability. One class and 1 population of undergraduate students alone were utilized at only 1 teaching institution. The researchers were focused on the student lens; however, further exploration of this construct would need to include the faculty perspective, particularly as it relates to any challenges for faculty in assessing additional student work. Further research is needed to explore other samples of students in different educational contents in a controlled prospective study to determine if the same relationship can be found. As this study was retrospective and there was no attempt to control for a number of variables, conclusions about cause and effect cannot be made.
CONCLUSION
Higher levels of student participation in the course, regardless of whether learners were in class or outside of class, related positively to exam performance and the achievement of higher levels of learning. This provides further support to the literature related to the efficacy of EBT methods9 and creates a stronger call for the need to apply EBT strategies to contemporary practice.2 Seeking effective ways by which learners can increase active participation and engagement with course learning may help learners develop a deeper understanding of complex curriculum content.
ACKNOWLEDGMENTS
We would like to thank Dominic Giuliano, DC Joyce Springate, RN, EdD and Roshni Mehrabi, DC for their contributions to this work.
FUNDING AND CONFLICTS OF INTEREST
No external funding was provided for this study, and there are no conflicts of interest to declare.
Footnotes
Concept development: DS, LH. Design: DS, LH. Supervision: DS, LH. Data collection/processing: DS, LH. Analysis/interpretation: SD, DS, LH. Literature search: SD, DS, LH. Writing: SD, DS, LH. Critical review: SD, DS, LH. Research ethics board proposal: SD, DS; Conference presentation: SD, DS.
References
- 1.Howard L. Walking the talk: applying adult education principles to influence change. Brigham S, editor. Proceedings of Canadian Association for Studies in Adult Education (CASAE) 2012 Conference. Kitchener, ON: Wilfred Laurier University and University of Waterloo; 2012:165–172. In. ed. [Google Scholar]
- 2.Groccia J, Buskist W. Need for evidence-based teaching. N Dir Teach Learn. 2011;2011(128):5–11. doi: 10.1002/tl.463. [Google Scholar]
- 3.Tagg J. Changing minds in higher education: students change, so why can't colleges? Plann High Educ. 2007;37:15–22. [Google Scholar]
- 4.Dunn D, Saville B, Baker S, Marek P. Evidence-based teaching: tools and techniques that promote learning in the psychology classroom. Aust J Psychol. 2013;65(1):5–13. [Google Scholar]
- 5.Morgan S, Martin L, Howard B, Mihalek PH. Active learning: what is it and why should I use it? Dev Bus Simul Experiential Learn. 2015;32:219–223. [Google Scholar]
- 6.Stowell J, Nelson J. Benefits of electronic audience response systems on student participation, learning, and emotion. Teach Psychol. 2007;34:253–258. [Google Scholar]
- 7.Dirk K. “I hope it's just attendance”: what does participation mean to freshman composition students and instructors? Composition Stud. 2010;38(1):88–107. [Google Scholar]
- 8.Krathwohl D. A revision of Bloom's taxonomy: an overview. Theory Pract. 2002;41(4):212–218. [Google Scholar]
- 9.Petty G. Evidence-Based Teaching: A Practical Approach. 2nd ed. Cheltenham, UK: Nelson Thornes;; 2009. [Google Scholar]
- 10.Shaw R. A study of the relationships among learning styles, participation types, and performance in programming language learning supported by online forums. Comput Educ. 2012;58(1):11–120. [Google Scholar]
- 11.Amin Z, Eng KH. Basics in Medical Education. 2nd ed. Singapore: World Scientific Publishing Co.;; 2009. [Google Scholar]
- 12.Clair KSL. A case against compulsory class attendance policies in higher education. Innov High Edu. 1999;23(3):171–180. [Google Scholar]


