Abstract
Osteocytes reside as 3-dimensionally networked cells in the lacunocanalicular structure of bones, and function as the master regulators of homeostatic bone remodeling. We report here, for the first time to our best knowledge, the use of a biomimetic approach to reconstruct the 3D osteocyte network with physiological relevant microscale dimensions. In this approach, biphasic calcium phosphate microbeads were assembled with murine early osteocytes (MLO-A5) to provide an initial mechanical framework for 3D network formation and maintenance during long-term perfusion culture in a microfluidic chamber. The microbead size of 20–25 μm was used to: (1) facilitate a single cell to be placed within the interstitial space between the microbeads, (2) mitigate the proliferation of the entrapped cell due to its physical confinement in the interstitial site, and (3) control cell-to-cell distance to be 20–25 μm as observed in murine bones. The entrapped cells formed a 3D cellular network by extending and connecting their processes through openings between the microbeads within 3 days of culture. The entrapped cells produced significant mineralized extracellular matrix to fill up the interstitial spaces, resulting in the formation of a dense tissue structure during the course of 3-week culture. We found that the time-dependent osteocytic transitions of the cells exhibited trends consistent with in vivo observations, particularly with high expression of Sost gene, which is a key osteocyte-specific marker for the mechanotransduction function of osteocytes. In contrast, cells cultured in 2D well-plates did not replicate in vivo trends. These results provide an important new insight in building physiologically relevant in vitro bone tissue models.
Introduction
Osteocytes are the most abundant cells (>90%) that reside in mineralized extracellular matrix cavities (“lacunae”) in bones. As illustrated in Fig. 1a for their characteristic dimensions in cortical bones, osteocytes are interconnected by extending tens of dendritic processes through smaller channels (“canaliculi”) in all directions and forming gap junctions. The extracellular spaces between the osteocyte cell surface and the lacunar and canalicular walls are filled with matrix proteins such as proteoglycans [1] and glycosamino-glycans [2] with an effective pore size of ~10 nm [3]. Osteocytes in this 3-dimensional (3D) cellular network are known to function as master regulators of homeostatic bone remodeling [4,5]. They have also been implicated for regulative contributions in metabolic demands for minerals [6] and hematopoiesis [7].
Fig. 1.

Illustrations of: (a) 3D osteocyte network in lacunocanalicular structure and (b) biomimetic assembly of 3D osteocyte network guided by closely packed BCP microbeads.
The 3D lacunocanalicular network is hierarchically assembled into bone remodeling units (“osteons”) which are: (1) in a cylindrical shape with a radius of ~250 μm and a length of several mm and (2) separated by osteonic and perforating canals which contain blood capillaries and nerves. Osteoblasts (bone forming cells) reside at the osteon canal surface. Interstitial fluid is believed to drain through perforating canals and then to lymphatic capillaries present at the outer surface of bones (i.e., “periosteum”) [1] since there is no clear evidence to suggest the presence of lymphatic capillaries within bone tissues [8]. Due to the very small canaliculi and matrix pore dimensions, it is thought that: (1) the lacunocanalicular structure is basically impermeable to pressure-driven perfusion and (2) the movement of lacunar and canalicular fluids and the mass transfer of molecules occur as a result of compressive mechanical loading of cortical bones which behave as “poroelastic sponges.”
The extracellular matrix (ECM) nature of the perilacular and canalicular spaces, therefore, influences: (1) mechanical load-induced perfusion, (2) flow-induced shear on cell membrane surfaces, and (3) mechano-sensing and -transduction actions by osteocytes [4,6,9]. It has been estimated from in vivo observations that 0.5 Hz cyclic end-compression of a mouse tibia results in the peak canalicular fluid velocity of 60 μm/s and the peak shear stress of up to 5 Pa on the membrane surface of osteocyte cell processes [3]. An in vitro study [10] has also shown that the intracellular calcium response of osteocytic cells (MLO-A5) can be up-regulated in the wall shear stress range of 5 to 40 Pa during 2D culture in a simple flow cell configuration.
Osteocytes maintain osteoblasts in quiescent states by releasing signaling molecules such as sclerostin and Dickkopf1-related protein 1 (Dkk1) [11,12]. In response to cyclic mechanical loading, production of these molecules by osteocytes becomes down-regulated and consequently activates osteoblastic development for new bone formation. For example, a mouse ulna loading study [13] has elegantly shown that higher strain regions of the ulna bone result in less production of sclerostin and therefore increased local osteogenesis at those locations within a period of 7 days. This regulatory mechanism is clinically important as a major target for new drug developments, for example, sclerostin and Dkk1 antibodies [14] for treatment of osteoporosis with over 10 million patients [15] and osteolytic lesions caused by bone metastases which result in 350,000 deaths every year in the U.S. [16].
Despite these important understandings, a significant challenge remains for in vivo studies of osteocytes due to: (1) in vivo and ex vivo difficulties in accessing and characterizing osteocyte networks deeply embedded in the hard bone matrices and (2) in vitro challenges in culturing primary osteocytes while maintaining their physiological functions [17,18]. Importantly, there has been a very limited effort in replicating the 3D network structure of osteocytes in vitro. Osteoblasts by themselves during in vitro culture cannot be transformed into 3D-networked osteocytes with physiologically relevant dimensions, even when osteoblast culture is aided by biomaterial scaffolds for 3D culture [18,19], dynamic flow and/or perfusion in bioreactors [20,21], and application of mechanical loading [22]. For example, Boukhechba et al. [18] showed that primary human osteoblasts cultured with biphasic calcium phosphate (BCP) particles differentiated significantly towards osteocyte-like phenotype with down-regulated osteoblastic-specific markers and up-regulated osteocytic markers, in comparison to those cultured in 2D. However, the 3D culture of these cells produced random cell aggregates between interstitial spaces of 40–80 μm BCP particles and therefore did not produce an ordered 3D cellular network.
We have also previously found [20] that 3D ossified tissue can be grown by self-organization of osteoblasts in microfluidic chambers within several weeks of culture. However, even after 9 weeks of culture, the ossified tissue structure grown from primary and cell-line mouse osteoblasts did not develop into 3D-networked osteocytes. Also, the tissue structure was not sufficiently rigid for mechanical loading. Mulcahy et al. [23] reported that 3D culture of osteocyte-like murine cell line (MLO-Y4) with Matrigel can be used to form a 3D osteocytic network by a biomimetic self-burial process. The average cell-to-cell distance in the resulting structure was ~100 μm, and therefore could not be controlled to mimic the physiologically relevant dimension of ~20–30 μm in mouse bones as illustrated in Fig. 1a. This is an important issue since it has been reported that the intercellular dimension is important in cell-cell signaling for osteocyte process growth and mechanotransduction sensitivity [4,5]. Also, with increasing culture time in the gel culture study, osteocytes were free to proliferate and eventually destroy the initially ordered cellular network over a period of 28 days [23].
These observations led us to explore, in this study, a biomimetic approach to assemble osteocytes with microbeads within the physical confine of a microfluidic culture chamber to emulate the physiological relevant microscale dimensions of 3D lacunocanalicular structure which can be subjected to long-term perfusion culture. As illustrated in Fig. 1b, our approach utilizes BCP microbeads ranging from 20–25 μm to: (1) spatially distribute osteocyte cell bodies into the interstitial spaces between the microbeads with one cell occupying each interstitial site while allowing them to develop processes and gap junctions with neighboring cells with the physiologically relevant lacuna and interlacunar dimensions and (2) provide a mechanically stable framework to maintain the microscale geometry and dimensions of the 3D cellular network during perfusion culture.
For the densely packed face-centered cubic and hexagonal close-packed structures of microbeads, cells are expected to be trapped in the vacant octahedral interstitial sites of the structure. For these structures, the diameter (d′) of the octahedral vacancies and the distance between the vacant sites (d) are:
| Eq. 1 |
| Eq. 2 |
where D is the diameter of microbeads. Therefore, for osteocytes with a typical diameter of 8–10 μm, microbeads with diameters of 20~25 μm were chosen to: (1) allow a single cell to be placed within the interstitial site that is sufficiently large (d′=8–10 μm), but too small for occupation by more than one cell, (2) mitigate the proliferation of the cell placed in the interstitial site due to the physical confinement of the interstitial site, and (3) control the cell-to-cell distance to 20–25 μm. BCP is chosen as the microbead material since BCP is known to facilitate mineral deposition by early and late osteoblastic cells due to controlled release of calcium ions [20,24]. With this biomimetic approach, our goal for this investigation was to study the 3D morphological development, ECM production, and differentiation of murine early osteocytes (MLO-A5). MLO-A5 is a Sost gene-expressing and sclerostin-producing cell line which has been widely for in vitro mechanotransduction studies of osteocytes.
Results
Microfluidic 3D Culture
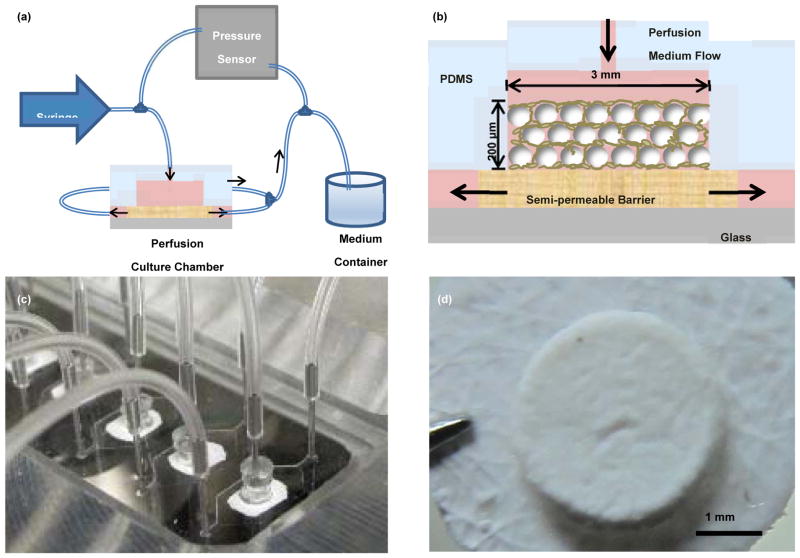
Figs. 2a and 2b schematically illustrate of the polydimethylsiloxane (PDMS)-based microfluidic culture system and chamber, respectively, used in this study. A solution containing MLO-A5 cells and BCP microbeads at a 1:1 ratio was placed into each chamber to form ~200 μm-thick tissue samples. The samples were cultured up to 21 days using an osteogenic culture medium at the perfusion flow rate of 1 μL/min. As shown in Fig. 2d, a mechanically integrated structure of MLO-A5 cells and microbeads was obtained after 3 days of culture.
Fig. 2.
Illustrations of (a) microfluidic perfusion setup and (b) biomimetic assembly in the microfluidic chamber, (c) Picture of the microfluidic chambers, and (d) a 3D tissue sample removed at Day 3.
Cell Viability
After culture, the tissue samples were dismantled by trypsin and the released cells were collected for flow cytometry. As shown in Figs. 3a and b, healthy cells showed strong red and weak green fluorescence (81±2.4% of the cells). Dead and injured cells showed reduced red and strong green fluorescence (15.7±3.7%). Also, some debris of the BCP microbeads was detected with negative green and red fluorescence (~3%).
Fig. 3.
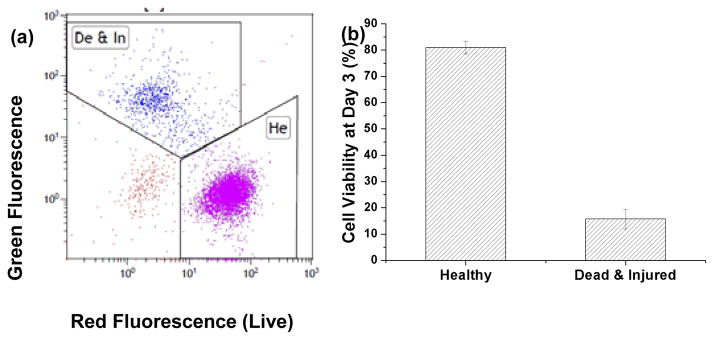
flow cytometry data of (a) live/dead stained cells harvested from 3D tissue samples cultured for 3 days showing (b) cell viability of more than 80%.
Measured Pressure Drop and Estimated Porosity
The culture medium flow rate of 1 μL/min was used, resulting in an average residence time of ~30 s through the ~200 μm thick tissue samples to mimic interstitial flow from Haversian canals to the deepest regions of osteons. As shown in Fig. 4a, ΔP across the perfusion chambers increase from 9±0.3 Pa in empty chambers to 17±5 Pa and 19±4 Pa in the chambers with or without cells at Day 1, respectively. ΔP across the cultured 3D tissue increased to 58±16 Pa at Day 3 and 1.5±0.3×10³ at Day 10. Porosity (ε) was then estimated using the modified Kozeny-Carman equation (Eqs. 3 and 4) [25]:
| Eq. 3 |
| Eq. 4 |
where ΔP is the pressure drop across the thickness of the structure (Δx≈200μm), D is the mean diameter of the microbeads (22.5 μm), μ is the viscosity of the medium, v0 is the superficial velocity, Q is the volumetric velocity of culture medium, and A is the cross-sectional area of the culture chamber. Using these equations, porosity (ε) was estimated to decrease from 0.25 in BCP only chambers to 0.23, 0.16 and 0.07 in the chambers cultured with the 3D tissue at Day 1, 3 and 10, respectively (Fig. 4b).
Fig. 4.
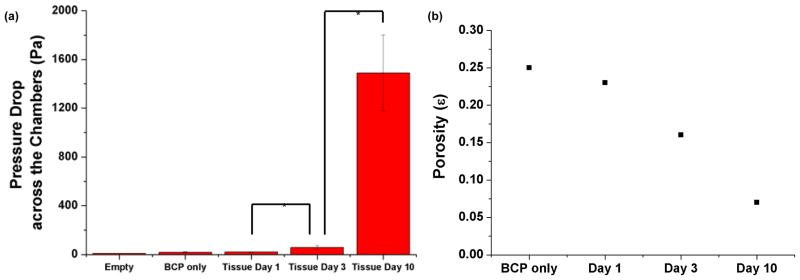
(a) Measured pressure drop increase and (b) estimated porosity decrease as a function of culture time. The average pressure drop values in (a) and Eqs. 3 and 4 were used to estimate the porosity values in (b). *P<0.05
3D Osteocyte Network Formation
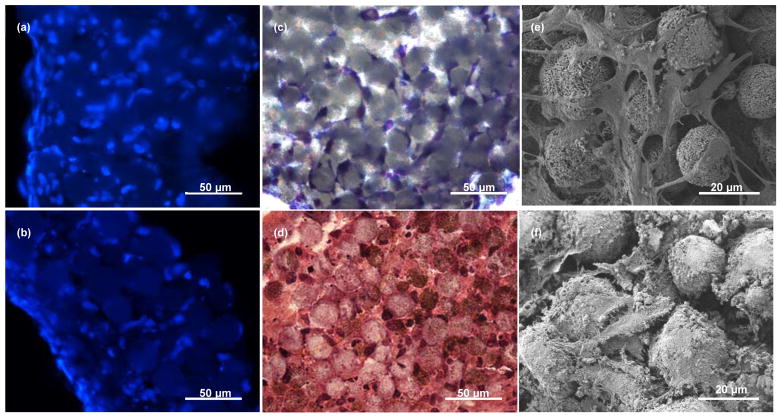
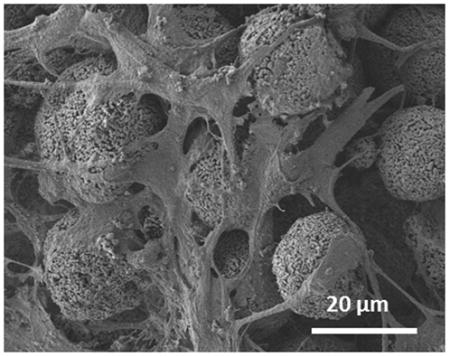
Histological analysis of the 3D tissues stained with 4′,6-diamidino-2-phenylindole (DAPI) showed that cells occupied interstitial sites of microbeads, and were distributed throughout the 200 μm-thick samples (Fig. 5a). The interstitial occupancy by the cells was estimated to be ~80% based on cross-sectional images. The cross-sectional view with toluidine blue staining (Fig. 5c) and the top scanning electron microscopic (SEM) view (Fig. 5e) showed that the osteocyte-like cells attached to the microbeads, grew processes, extended their processes to neighboring cells, and become connected. Taken together, the results show that the 3D cellular network could be formed upon 3 days of culture.
Fig. 5.
(a) and (b) 20-μm thick cross-sections of the tissues stained with DAPI (blue) showing cell nuclei at Day 3 and Day 21, respectively; (c) cross-section of the tissues stained with toluidine blue showing the formation of 3D cellular network at Day 3, (d) cross-section of the tissues stained with H&E showing mineralized ECM production at Day 21; (e) top view SEM image showing 3D cellular network and gap junction formation at Day 3 and (f) top view SEM image showing ECM production and mineralization at Day 21.
3D Tissue Characteristics after 21-day Culture
Over the 21-day culture period, the cells produced significant amounts of ECM as previously observed [26] and became further embedded, as shown by hematoxylin and eosin staining (Fig. 5d) and SEM imaging (Fig. 5f). Also, the SEM image showed that the cells became more elongated and stellate in their shape and formed tens processes per cell (Fig. 5f), exhibiting characteristic morphological features of osteocytes. Furthermore, the cells that were embedded in the interstitial space did not proliferate since most interstitial sites were occupied by single cells (Fig. 5b).
The microcomputed tomography (microCT) images (Fig. 6) of the tissue samples confirmed that tissues were mineralizing and became denser and more connective over time. As summarized in Table 1, the bone volume ratio (BV/TV) at Day 10 and Day 21 were 10% and 17% greater than at Day 3, respectively. Also, all other calculated parameters in Table 1 showed similar and consistent trends with respect to increased density and connectivity of the tissue samples.
Fig. 6.
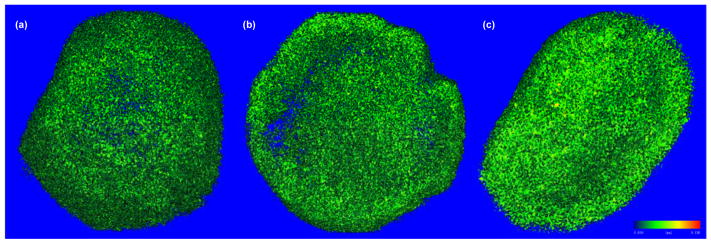
MicroCT images of the tissues obtained at the threshold of 0.5 g/cm3at: (a) Day 3, (b) Day 10, and (c) Day 21, showing the increasing degree of mineralization with culture time.
Table 1.
MicroCT results for 3D tissue samples.
| Day 3 | Day 10 | Day 21 | |
|---|---|---|---|
| BV/TV (n.a.) | 0.132±0.0371 | 0.229±0.0238* | 0.294±0.0173* |
| TMD (mg) | 673±2.27 | 687±6.55* | 700±2.03* |
| Tb.N (1/mm) | 31.0±5.70 | 41.0±4.15 | 47.0±0.566* |
| Tb.Th (mm) | 0.00910±0.0003 | 0.0104±0.0007* | 0.0110±0.0004* |
| Tb.Sp (mm) | 0.0334±0.0067 | 0.0246±0.0030 | 0.0208±0.0004* |
| Conn-Dens. (1/mm3) | 25594±13624 | 57742±10091* | 83023±2994* |
| SMI (n.a.) | 3.10±0.244 | 2.44±0.251* | 1.86±0.206* |
P<0.05 with Day 3 sample as control.
Osteocytic Developments
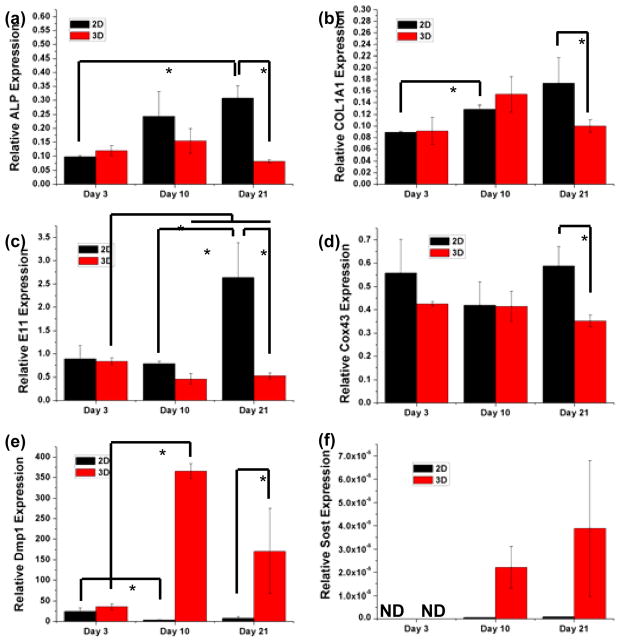
Osteoblast-specific genes (Alpl and Col1a1) osteoblast-to-osteocyte transition genes (E11 and Dmp1), gap-junction component protein gene (Cox43), and mature osteocyte-specific gene (Sost), were examined as a function of culture time. As shown in Figs. 7a and b, both Alpl and Col1a1 gene expressions increased with time in 2D well plate cultures while gene expressions in the 3D tissues did not show similar trends. Despite having similar expression levels at Day 3 in comparison to 2D cultures, Alpl and Col1a1 expressions in 3D tissues were significantly down-regulated by factors of 3.7 and 1.7, respectively, after 21 days.
Fig. 7.
Relative gene expressions of osteoblast and osteocyte-specific markers measured by quantitative PCR as a function of culture time and in comparison to 2D culture. *P<0.05
The expressions of early osteocyte-specific genes (E11 and Cox43) showed remarkable differences between 2D and 3D cultures (Figs. 7c and d). Specifically, during the 21-day culture period, E11 was up-regulated in 2D but down-regulated in 3D, which rendered a 2D vs. 3D expression ratio of 5.1 at Day 21. The expression of Cox43, a gene that encodes Gap junction alpha-1 protein (Gja1), did not show significant difference between 2D and 3D by Day 10. However, at Day 21, its expression was significantly lower in 3D than in 2D. The expression of Dmp1, another osteocyte-specific marker, started at similar levels between 2D and 3D at Day 3, but the expression was strongly enhanced in 3D with time whereas the cells significantly lost this expression in 2D. As a result, the Dmp1 expression in 3D was 21-times higher than that in 2D by Day 21 (Fig. 7e).
The late osteocyte-specific gene expression, Sost, was not detected in both 2D and 3D at Day 3 (Fig. 7f). At Day 10 and 21, the Sost expression remained very low or undetectable in 2D. In contrast, the expression significantly increased with time in 3D culture with the expression elevated by two orders of magnitude by Day 21.
Discussion
In this study, we were able to form a 3D osteocytic cellular network by closely packing microbeads and osteocytes in the perfusion culture chamber. Our simple mixing and injection method was effective in creating a relatively closely-packed microbead structure with ΔP of ~6 Pa and ε of 0.25, (Fig. 4). These values indicated that a close-packed structure was formed without significant channeling between loosely packed microbeads [25]. In the presence of cells, ΔP increased and ε decreased as the cells occupied the interstitial sites between the microbeads. Also, the tissue structure was mechanically stable enough to survive histological sample preparation after only 3 days of culture. With increasing culture time, ΔP increased and ε decreased significantly, suggesting that newly produced ECM filled the rest of the interstitial spaces. After 10 days of culture, ε decreased to 0.07 which is close to that in native cortical bone tissues (~0.05) [27]. The increased bone fraction (BV/TV) measured by microCT (Table 1) correlate well with the pressure drop measurements and porosity estimations, and support that the production of ECM was significant during culture.
The biomimetic approach was also effective in spatially distributing osteocyte cell bodies into the interstitial spaces between the microbeads while allowing them to develop processes for connection with neighboring cells with the physiologically relevant lacuna and interlacunar dimensions (Fig. 5). The histological analysis clearly showed that most cells were individually placed in the interstitial sites of the close-packed microbeads without proliferating after culturing for 3 weeks. The observed single cell occupation per interstitial site and inhibited cell proliferation are attributed to the selection of the microbead size, as hypothesized and rationalized in the introduction section. The inhibition mechanism is important for 3D osteocyte network formation since cell proliferation can lead to the formation of disordered, random cell aggregates, as previously observed by: (1) Boukhechba et al. [18] during MLO-A5 cell culture with 40–80 μm BCP particles and (2) Mulcahy et al. [23] during the culture of MLO-Y4 cell line with Matrigel.
Our results show that the microbead size can be used as an effective means of controlling cell-to-cell distance, which could not be achieved by the previous 3D culture methods. As mentioned earlier, this intercellular dimension control is important since cell-cell signaling is associated with osteocyte process growth and the 3D network’s sensitivity for mechanotransduction [4,5]. Furthermore, the 3D biomimetic culture approach significantly facilitated the in vivo-like osteocytic developments of 3D-networked MLO-A5 cells in comparison to 2D. As shown in Fig. 5, cells that were initially entrapped in the interstitials quickly started to produce ECM around them and form an osteoid-like structure. The microCT results (Fig. 6 and Table 1) also indicated that the cells were mineralizing their surroundings with time.
As a result of the above effects, the development of gene expressions by the MLO-A5 cells during the time course of our 3D culture (Fig. 7) showed trends consistent with those previously observed from mouse models. After culture for 21 days, the osteoblast-specific markers (Alpl and Col1a1) became significantly down-regulated in comparison to that at 10 days, indicating the differentiation of the cells towards the osteocytic phenotype. We also observed the down-regulation of early osteocyte-specific markers such as E11 and Cox43 at Day 21. These decreases are consistent with in vivo observations that these gene expressions become reduced during osteocytic differentiation [4]. These reductions can be explained by the fact that the intracellular structure undergoes dramatic changes during differentiation from largely spread to small and stellate morphologies, resulting in reduction of endoplasmic reticulum and Golgi apparatus as well as corresponding decreases in protein synthesis and secretion from the above genes [28]. This interpretation is supported by the SEM images (Figs. 5e and 5f), illustrating that cell morphology changed from spread at Day 3 to stellate at Day 21. The osteocyte-specific marker (Dmp1) was maintained at a high level throughout the culture time. This trend is also in agreement with in vivo observations [29] that sustained Dmp1 gene expression is necessary for mineralization.
Most prominently, the expression of the late osteocyte-specific marker (Sost) by the MLO-A5 cells cultured in 3D tissues increased significantly with time. Sost is a key marker of mature osteocyte that can only be detected in deeply embedded osteocytes [4]. This in vivo replication is important because of: (1) the obvious presence of Sost as the late osteocyte-specific marker and (2) its important function in producing sclerostin as a major signaling molecule for negatively regulating new bone formation by bone formation, as explained in the introduction section.
In contrast to the ability of our microbeads-guided culture approach to replicate osteocytic gene expression trends observed in vivo, MLO-A5 cells cultured in 2D did not replicate. For example, Alpl and Col1a1 expressions increased with time. Also, the expression of E11 was significantly increased at Day 21 while Cox43 exhibited no clear trend. Furthermore, Dmp1 expression was quickly lost after 3 days. Most critically, Sost expression remained very low or undetectable throughout the 21-day culture period.
Taken together, our results show that the microbeads-guided approach can be used to produce and maintain the 3D cellular network of osteocytes with the physiologically relevant lacuna and interlacunar dimensions. For future research, it will be interesting to study the effects of perfusion-induced shear loadings on the Sost gene expression of the 3D-networked osteocytes to assess the possibility of using our model as a convenient in vitro means of reproducing the mechanotransduction function of osteocytes. Also, it will be important to study the possibility of reproducing the 3D osteocyte network’s important function in incorporating neighboring osteoblasts into the cellular network and regulating the spatiotemporal transition of the osteoblasts to osteocytes. These are major mechanisms of new bone formation during homeostatic bone remodeling. If these important functions of osteocytes could be successfully reproduced, the biomimetic approach could be extended for use with primary osteocytes harvested from mouse long bones [30] and discarded human bones from orthopaedic implant surgeries.
The above developments may ultimately enable the use of in vitro bone tissue models for the preclinical evaluation of new drugs such as sclerostin and Dkk1 antibodies for treating osteoporosis and bone metastasis. This projection is consistent with a rapidly growing recognition for critical importance of developing microphysiological relevant human 3D tissue models [31], as a new means for preclinical drug evaluation to reduce our reliance on animal models that have limited relevance to humans and therefore often poorly correlate with clinical outcomes.
The development of this exciting new technology will certainly require significant advances on three major research fronts: (1) ability to work with primary osteocytes which have been almost impossible to preserve and maintain ex vivo; (2) reconstructing 3D tissue structures, through the enabling use of biomaterials, that mimic native microenvironments from which primary osteocytes are harvested from; and (3) culture devices that can be easily used to grow 3D tissues and evaluate tissue cell response to drugs in a relatively high-throughput manner. In this regard, this investigation provides an initial framework in addressing the 3D tissue reconstruction and culture device issues associated with the development of microphysiological bone tissue models.
Materials and Methods
BCP Microbeads
Spray-dry/sintered BCP microbeads were purchased from CaP Biomaterials. They were composed of 68% of hydroxyapatite and 32% of β-tricalcium phosphate according to the supplier. The microbeads were sieved to a size range of 20–25 μm and coated with collagen type I (Sigma-Aldrich) using 10 mg/mL collagen/hexafluoroisopropanol solution for 2 h. They were then washed with phosphate buffered saline (PBS) three times and stored prior to further use.
MLO-A5 Cell Culture
The MLO-A5 post-osteoblast/pre-osteocyte cell line was a kind gift from Professor Lynda Bonewald (University of Missouri-Kansas City). Cells were maintained in collagen-coated flasks in α-MEM (Gibco) supplemented with 5% (v/v) fetal bovine serum (FBS, ATCC), 5% (v/v) calf bovine serum (CBS, ATCC) and 1% (v/v) penicillin-streptomycin (P/S, MP Biomedicals) at 370C and 5% CO2, and subcultured once until they reached about 80% confluence [26]. Cells from passages 2 to 9 were used.
Microfluidic 3D Culture of MLO-A5 Cells with BCP Microbeads
As described elsewhere in detail elsewhere [32], soft-lithography was used to fabricate the PDMS device. A PDMS layer containing hexagonal patterns of 6 mm × 12 mm with 200 μm thick was made. 3-mm holes were then punched in the middle of patterns to form culture chambers. The PDMS housing was then bonded to a glass slide while placing a filter membrane layer (MF-MilliporeTM) of 4 mm in diameter and 200 μm in thickness between the PDMS layer and the glass slide (Fig. 2c).
MLO-A5 cells were suspended using trypsin and mixed thoroughly with BCP microbeads at concentrations of 1×10⁷ cells/mL and 1×10⁷ microbeads/mL to produce the cell/microbead ratio of 1:1. 10 μL of the mixture was placed using a micropipette onto the top of the membrane in each chamber to form ~200 μm-thick tissue samples. After waiting for 2 h to let the cells to attach to the microbeads, the microfluidic chambers were sealed from the top by inserting PDMS caps. The space between the bottom of the caps and the tissue sample surfaces was kept at ~1 mm. Culture medium flow was applied through the stainless steel tubes inserted into the caps located at the top of the chambers using syringe pumps (Figs. 2a and b). The tissue samples were cultured up to 21 days osteogenic α-MEM supplemented with 10% (v/v) FBS, 50 μg/mL ascorbic acid (Sigma), 3 mM β-glycerophosphate (Sigma) and 1% (v/v) P/S at the perfusion flow rate of 1 μL/min.
Pressure Drop Measurement across the Tissue Models
As shown in Fig. 2a, ΔP across the tissue samples was measured using a pressure sensor (P55E, Validyne Engineering) that was connected between the inlet and outlet tubing of the device. The measurements were conducted at Days 1, 3 and 10. ΔP across the empty chambers and chambers filled with only BCP microbeads were also measured as controls. All measurements were triplicate (i.e., three separate culture chambers).
Live/Dead Cell Vitality Assay
At Day 3, the chambers were disassembled to harvest the tissues. Cells were trypsinized to detach them from the BCP microbeads and stained with the live/dead cell vitality dye (Invitrogen) following the manufacturer’s protocol. In this assay C12-resazurin becomes C12-resorufin (red) in metabolically active cells due to reduction whereas SYTOX (green) is uptaken by late apoptotic and necrotic cells. Cell viability was quantitatively measured by flow cytometry (Beckman Coulter FC500). A minimum of 10,000 events were acquired and analyzed using the CXP cytometer analysis software (Beckman Coulter).
Cell and Tissue Morphology Characterization
At Day 3 and Day 21, 3D tissues were harvested and fixed with 4% paraformaldehyde/PBS solution. They were then dehydrated in sequential ethanol solutions with increasing concentrations from 50% to 100%. Some samples were embedded in glycol methacrylate and cut into histological sections of 20-μm thick. Several sections were stained with DAPI (Sigma-Aldrich) to examine cell distribution under a fluorescent microscope (Nikon Ti) while other sections were stained with either toluidine blue (Sigma) or H&E (Sigma) to examine cell morphology and extracellular matrix production under an optical microscope. A portion of the dehydrated samples were gold-coated and directly visualized under SEM (Zeiss Auriga FIB-SEM).
The remaining samples were further examined by microCT (Scanco μCT35). The scans were performed in air using 3.5 μm voxel size, 45KVp, 0.36 degrees rotation step (180 degrees angular range), 400 ms exposure and 1 averaging frame per view. The Scanco μCT software (HP, DECwindows Motif 1.6) was used for viewing of images and 3D image reconstruction. After 3D image reconstruction, volumes were segmented using a global threshold of 0.5 g/cm3 of calcium phosphate density to calculate: (1) the mineralized volume of the tissue including BCP and ECM (BV), (2) total volume of the 3D structure (TV), tissue mineral density (TMD), (3) trabecular number (Tb.N), (4) trabecular thickness (Tb.Th), (5) trabecular separation (Tb.Sp), (6) connectivity density, and (7) structure model index (SMI).
Osteoblast and Osteocyte Specific Gene Expressions by quantitative PCR
Total RNA from the MLO-A5 cells cultured in 3D was isolated at Day 3, 10 and 21, using an RNA Mini kit (Ambion) following the manufacturer’s protocol. 1 μg of the total RNA from each sample was used for cDNA synthesis. Briefly, 3 μL of 10 mM Oligo-dT solution (Sigma) was added to 16.5 μL of the RNA solution, heated at 750°C for 5 min and cooled on ice. A total of 30 μL reaction solution was: (1) constituted by further adding 1 μL RNasin ribonuclease inhibitor (Promega Corp, Madison, WI), 1.5 μL dNTp (Promega), 2 μL Reverse Transcriptase (Promega) and 6 μL Reverse Transcriptase Buffer (Promega), (2) incubated at 370C for 1.5 h, (3) stopped at 950C for 3 min, and (4) kept on ice. A final volume of the 20 μL reaction solution that consisted of 2 μL of the cDNA template, 1 μL of primer, 10 μL of PCR master mix (Taqman) and 7 μL of DEPC-treated water was prepared for quantitative RT-PCR assay (StepOnePlus, Applied Biosystems). All primers were purchased from Taqman. Amplification conditions were as follows: 95°C, 20s; 95°C, 1 s; 60°C, 20 s; 40 cycles. The relative expression of targeted genes was normalized to the GAPDH gene and gene expression level of cells at Day 0 using the 2−ΔΔCt method except Sost, for which 2−ΔCt method was used. The primers used are summarized in Table 2. 2D cultures were performed as control using a 96-well plate that was pre-coated with a layer of BCP microbeads.
Table 2.
Primers used in quantitative PCR
| Target Gene | Taqman Gene Expression Primer | Amplicon Length |
|---|---|---|
| Alpl | Mm00475834_m1 | 65 |
| Col1a1 | Mm00801666_g1 | 89 |
| Pdpn (E11) | Mm01348912_g1 | 120 |
| Dmp1 | Mm01208363_m1 | 74 |
| Cox43 (Gja1) | Mm01179639_s1 | 168 |
| Sost | Mm00470479_m1 | 55 |
Statistics
All samples in the assays of live/dead viability, pressure drop measurements, MicroCT and qPCR were performed in triplicates. One-way ANOVA followed by the Tukey’s multiple comparison tests was performed for pressure drop measurement, MicroCT and PCR results. Student’s t-test was used to analyze the results of PCR between the 2D and 3D culture experiments. p<0.05 was considered statistically significant.
Conclusions
The 3D osteocyte network was replicated by closely packing BCP microbeads and MLO-A5 cells for the microfluidic perfusion culture. The microbead size of 20–25 μm was used to: (1) facilitate a single cell to be placed within the interstitial site that is sufficiently large, but too small for occupation by more than one cell, (2) mitigate the proliferation of the cell entrapped in the interstitial site due to the physical confinement of the interstitial site, and (3) control the cell-to-cell distance to be that in the 3D lacunocanalicular structure of cortical mouse bones. The entrapped cells formed the 3D cellular network by extending and connecting their processes through openings between the microbeads within 3 days of culture while maintaining their intercellular distance at 20–25 μm. The ordered 3D network structure could be retained over 21 days of perfusion culture due to: (1) the rigidity of the microbeads assembly and (2) the inhibited proliferation of the entrapped cells. The entrapped cells produced significant mineralized ECM to fill up the interstitial spaces, resulting in the formation of dense and mechanically stable tissue structure. Most importantly, the time-dependent development of osteocytic gene expressions by the entrapped cells exhibited trends consistent with in vivo observations whereas cells cultured in 2D did not.
Acknowledgments
Research in this publication was supported by grants from: (1) the National Institute of Arthritis and Musculoskeletal and Skin Diseases of the National Institutes of Health under Award Number 1R21AR065032 and (2) the National Science Foundation (DMR 1409779). The content is solely the responsibility of the authors and does not necessarily represent the official views of the National Institutes of Health and the National Science Foundation. We would like to thank Prof. Lynda Bonewald at University of Missouri, Kansas City for kindly providing us with the MLO-A5 cells. We also thank Ms. Lyudmila Lukashova at Hospital for Special Surgery for the microCT characterization. We also thank Profs. Hongjun Wang and Peter Tolias at the Stevens Institutes of Technology for useful discussions during this study.
Notes and references
- 1.Knothe Tate ML. J Biomech. 2003;36:1409–24. doi: 10.1016/s0021-9290(03)00123-4. [DOI] [PubMed] [Google Scholar]
- 2.Morris HL, Reed CI, Haycock JW, Reilly GC. Proc Inst Mech Eng H. 2010;224:1509–21. doi: 10.1243/09544119JEIM751. [DOI] [PubMed] [Google Scholar]
- 3.Price C, Zhou X, Li W, Wang L. J Bone Miner Res. 2011;26:277–85. doi: 10.1002/jbmr.211. [DOI] [PMC free article] [PubMed] [Google Scholar]
- 4.Dallas SL, Prideaux M, Bonewald LF. Endocr Rev. 2013;34:658–90. doi: 10.1210/er.2012-1026. [DOI] [PMC free article] [PubMed] [Google Scholar]
- 5.Loiselle AE, Jiang JX, Donahue HJ. Bone. 2013;54:205–12. doi: 10.1016/j.bone.2012.08.132. [DOI] [PubMed] [Google Scholar]
- 6.Bonewald LF. J Bone Miner Res. 2011;26:229–38. doi: 10.1002/jbmr.320. [DOI] [PMC free article] [PubMed] [Google Scholar]
- 7.Asada N, Katayama Y, Sato M, Minagawa K, Wakahashi K, Kawano H, et al. Cell Stem Cell. 2013;12:737–47. doi: 10.1016/j.stem.2013.05.001. [DOI] [PubMed] [Google Scholar]
- 8.Edwards JR, Williams K, Kindblom LG, Meis-Kindblom JM, Hogendoorn PC, Hughes D, et al. Pathol. 2008;39:49–55. doi: 10.1016/j.humpath.2007.04.022. [DOI] [PubMed] [Google Scholar]
- 9.Santos A, Bakker AD, Klein-Nulend J. Osteoporos Int. 2009;20:1027–31. doi: 10.1007/s00198-009-0858-5. [DOI] [PubMed] [Google Scholar]
- 10.Lu XL, Huo B, Park M, Guo XE. Bone. 2012;51:466–73. doi: 10.1016/j.bone.2012.05.021. [DOI] [PMC free article] [PubMed] [Google Scholar]
- 11.Klein-Nulend J, Nijweide PJ, Burger EH. Curr Osteoporos Rep. 2003;1:5–10. doi: 10.1007/s11914-003-0002-y. [DOI] [PubMed] [Google Scholar]
- 12.Heino TJ, Hentunen TA, Väänänen HK. J Cell Biochem. 2002;85:185–97. doi: 10.1002/jcb.10109. [DOI] [PubMed] [Google Scholar]
- 13.Robling AG, Niziolek PJ, Baldridge LA, Condon KW, Allen MR, Alam I, et al. J Biol Chem. 2008;283:5866–75. doi: 10.1074/jbc.M705092200. [DOI] [PubMed] [Google Scholar]
- 14.Rachner TD, Khosla S, Hofbauer LC. Lancet. 2011;377:1276–87. doi: 10.1016/S0140-6736(10)62349-5. [DOI] [PMC free article] [PubMed] [Google Scholar]
- 15.Burge R, Dawson-Hughes B, Solomon DH, Wong JB, King A, Tosteson A. J Bone Miner Res. 2007;22:465–75. doi: 10.1359/jbmr.061113. [DOI] [PubMed] [Google Scholar]
- 16.Roodman GD. Discov Med. 2004;350:1655–64. doi: 10.1056/NEJMra030831. [DOI] [PubMed] [Google Scholar]
- 17.Schneider P, Meier M, Wepf R, Müller R. Bone. 2010;47:848–58. doi: 10.1016/j.bone.2010.07.026. [DOI] [PubMed] [Google Scholar]
- 18.Boukhechba F, Balaguer T, Michiels JF, Ackermann K, Quincey D, Bouler JM, et al. J Bone Miner Res. 2009;24:1927–35. doi: 10.1359/jbmr.090517. [DOI] [PubMed] [Google Scholar]
- 19.Nukavarapu SP, Kumbar SG, Brown JL, Krogman NR, Weikel AL, Hindenlang MD, et al. Biomacromolecules. 2008;9:1818–25. doi: 10.1021/bm800031t. [DOI] [PMC free article] [PubMed] [Google Scholar]
- 20.Lee JH, Gu Y, Wang H, Lee WY. Biomaterials. 2012;33:999–1006. doi: 10.1016/j.biomaterials.2011.10.036. [DOI] [PubMed] [Google Scholar]
- 21.Krishnan V, Dhurjati R, Vogler EA, Mastro AM. Biol Anim. 2010;46:28–35. doi: 10.1007/s11626-009-9238-x. [DOI] [PubMed] [Google Scholar]
- 22.Frias C, Reis J, Capela e Silva F, Potes J, Simões J, Marques AT. J Biomech. 2010;43:1061–6. doi: 10.1016/j.jbiomech.2009.12.010. [DOI] [PubMed] [Google Scholar]
- 23.Mulcahy LE, Taylor D, Lee TC, Duffy GP. Bone. 2011;48:182–8. doi: 10.1016/j.bone.2010.09.014. [DOI] [PubMed] [Google Scholar]
- 24.Gu Y, Chen X, Lee JH, Monteriro DA, Wang H, Lee WY. Acta Biomater. 2012;8:424–31. doi: 10.1016/j.actbio.2011.08.006. [DOI] [PubMed] [Google Scholar]
- 25.Riefler N, Heiland M, Räbiger N, Fritsching U. Chem Eng Sci. 2012;69:129–37. [Google Scholar]
- 26.Kato Y, Boskey A, Spevak L, Dallas M, Hori M, Bonewald LF. J Bone Miner Res. 2001;16:1622–33. doi: 10.1359/jbmr.2001.16.9.1622. [DOI] [PubMed] [Google Scholar]
- 27.Wang X, Ni Q. J Orthop Res. 2003;21:312–19. doi: 10.1016/S0736-0266(02)00157-2. [DOI] [PubMed] [Google Scholar]
- 28.Franz-Odendaal TA, Hall BK, Witten PE. Dev Dyn. 2006;235:176–90. doi: 10.1002/dvdy.20603. [DOI] [PubMed] [Google Scholar]
- 29.Ling Y, Rios HF, Myers ER, Lu Y, Feng JQ, Boskey AL. J Bone Miner Res. 2005;20:2169–77. doi: 10.1359/JBMR.050815. [DOI] [PMC free article] [PubMed] [Google Scholar]
- 30.Stern AR, Stern MM, Van Dyke ME, Jähn K, Prideaux M, Bonewald LF. Biotechniques. 2012;52:361–73. doi: 10.2144/0000113876. [DOI] [PMC free article] [PubMed] [Google Scholar]
- 31.Huh D, Hamilton GA, Ingber DE. Trends Cell Biol. 2011;21:745–54. doi: 10.1016/j.tcb.2011.09.005. [DOI] [PMC free article] [PubMed] [Google Scholar]
- 32.Lee JH, Wang H, Kaplan JB, Lee WY. Tissue Eng Part C Methods. 2010;17:39–48. doi: 10.1089/ten.TEC.2010.0285. [DOI] [PubMed] [Google Scholar]


