

Abstract
We report the feasibility of tumor detection and delineation in vivo using multimode optical imaging of targeted gallium corrole (HerGa). HerGa is highly effective for targeted HER2+ tumor elimination in vivo, and it emits intense fluorescence. These unique characteristics of HerGa prompted us to investigate the potential of HerGa for tumor detection and delineation, by performing multimode optical imaging ex vivo and in vivo; the imaging modes included fluorescence intensity, spectral (including ratiometric), lifetime, and two-photon excited fluorescence, using our custom-built imaging system. While fluorescence intensity imaging provided information about tumor targeting capacity and tumor retention of HerGa, ratiometric spectral imaging offered more quantitative and specific information about HerGa location and accumulation. Most importantly, the fluorescence lifetime imaging of HerGa allowed us to discriminate between tumor and non-tumor regions by fluorescence lifetime differences. Finally, two-photon excited fluorescence images provided highly resolved and thus topologically detailed information around the tumor regions where HerGa accumulates. Taken together, the results shown in this report suggest the feasibility of tumor detection and delineation by multimode optical imaging of HerGa, and fluorescent chemotherapy agents in general. Specifically, the multimode optical imaging can offer complementary and even synergetic information simultaneously in the tumor detection and delineation by HerGa, thus enhancing contrast.
Keywords: Multimode optical imaging, two-photon excitation, spectral imaging, fluorescence lifetime imaging microscopy (FLIM), tumor targeted corrole, tumor detection
1. INTRODUCTION
Breast cancer is one of most common cancers occurring in women. For several decades, although many treatment and detection methods for this challenging cancer have been developed, the mortality rate from the breast cancer still remains high (1, 2). Recently, we reported a novel molecular construct for HER2+ breast cancer chemotherapy, a tumor-targeted gallium corrole (HerGa), formed by complexing of a sulfonated gallium corrole (S2Ga) and a recombinant tumor-targeting cell penetrating protein, HerPBK10 (3). Our report showed that HerGa is highly effective for both tumor detection and treatment in an animal model of HER2+ breast cancer, which is a more aggressive type of breast cancer, less responsive to standard interventions (4). In the study, fluorescence intensity imaging could validate the tumor-targeting capability of HerGa in vivo and ex vivo. Furthermore, the fluorescence intensity difference by HerGa between in tumors and normal regions enabled discriminating between them. However, the non-homogeneous accumulation of HerGa in vivo and significant background signals, which are produced by the blue light used for HerGa excitation, resulted in reduced contrast, hindering the quantitative analysis for tumor detection in vivo by fluorescence intensity imaging (4).
Therefore, in order to successfully translate HerGa chemotherapy and tumor detection into the clinic, we felt we needed to improve the contrast and the accuracy in the imaging-based monitoring of HerGa for tumor detection and delineation. This challenge requires new methods, with improved quantification ability and specificity. In our recent studies, we showed that multimode wide-field two-photon optical imaging offers improved discrimination between fluorescence from molecules of interest and autofluorescence, yielding higher sensitivity and specificity for in vivo applications (5). In addition, the new multimode optical imaging system we developed for small animals can be optimized for various applications, and the combined optical imaging using the system yields the increased contrast and synergetic information gathering in chemotherapy assessment with higher sensitivity and specificity. Particularly, the system offers a comprehensive imaging platform for analyzing kinetic, quantitative, environmental, and other highly-relevant information with micro-to macroscopic resolution [Hwang, J. Y., et al., submitted for publication].
We focused here on multimode optical imaging for tumor detection and delineation by HerGa. We tested whether multimode optical imaging of HerGa, including fluorescence intensity (6-17), spectral (16, 18-23), lifetime (24-30), and two-photon excited fluorescence imaging (31-33), can allow detection/delineation of tumors with better accuracy and high specificity. Specifically, we explored the following: 1) the preferential tumor accumulation of HerGa can allow detecting tiny tumors (~less 3mm) rather than relatively big tumors used in fluorescence intensity imaging; 2) spectral imaging and analysis can provide better quantitative information in tumor detection and delineation after IV administration of HerGa; 3) fluorescence lifetime differences of HerGa between tumors and normal tissues enable discriminating between these areas; 4) two-photon excited fluorescence imaging can provide high-resolution information on HerGa distribution in the tumors, and thus can be utilized for enhanced discrimination between tumors and normal tissues. Finally, the suitability and competitive advantages of each imaging mode in the context of improved tumor detection and delineation will be discussed.
2. METHODS AND MATERIALS
2.1 Materials
HerGa was produced through complexing S2Ga with HerPBK10 at a molar ratio of 30:1 as shown previously (3). Female nude mice with implanted MDA-MB-435 human breast tumor were prepared. 1cc of HerGa at a concentration of 46n moles diluted with phosphate buffer solution (PBS) was injected into intra-vein (IV) of the tail of mice for multimode optical imaging (4, 34).
2.2 Multimode optical imaging system for tumor detection and delineation by HerGa
In order to perform multimode optical imaging for tumor detection and delineation by HerGa, we used a novel multimode optical imaging system that we custom built. This instrument enables, on the same specimen, the simultaneous use of various in vivo imaging modes, including one or two photon-excited fluorescence, spectral, fluorescence lifetime, intra-vital confocal, and bioluminescence imaging as described previously [Hwang, J. Y., et al., submitted for publication]. Each imaging mode has a specific advantage as shown in the Figure 1, such as kinetic/dynamic discrimination (fluorescence intensity), quantitative evaluation by segmentation (spectral), functional reporting (lifetime), high 3D spatial resolution (two-photon excitation), endoscopic high resolution (intra-vital confocal), and high sensitivity (bioluminescence).
Fig. 1. Imaging modes in multimode optical imaging system and specific features recommending each mode.
We used four different imaging modes including one and two-photon excitation fluorescence intensity, spectral, and lifetime imaging for multimode optical imaging. While we used femto-second (fs) pulsed laser light tuned to 424nm at a repetition rate of 80MHz, which was generated by the second harmonic of a fs pulsed laser at 848nm (Mai-Tai Ti-Sapphire laser, Spectra-Physics), for one-photon excitation of HerGa, we used 100fs pulsed laser light at 848nm for two-photon excitation of HerGa. In the fluorescence intensity imaging, a cooled CCD camera (PIXIS 400, Princeton Instruments) was utilized for detection of the fluorescence signals that passed through a bandpass filter (Chroma Technology Corp., 620±30nm). In the spectral imaging, we utilized an acousto-optic tunable filter (AOTF) (ChromoDynamics) connected with the cooled CCD camera in order to do sequential spectral selection of emission fluorescence from the specimen. A 500nm longpass filter was placed in front of the AOTF to reject the excitation light. 10 sequential images were here recorded within the spectral range of 500nm to 680nm (step size: 20nm and bandwidth: 10nm) before and after HerGa intra-tumor injection, for construction of reference spectral signatures, and then spectral signatures of autofluorescence and HerGa fluorescence were generated from the band-sequential images of a mouse by using our custom software (19).
After that, using these reference spectral signatures, spectral classification for the sequential mouse images obtained after HerGa IV injection was performed using a spectral similarity measure based on Euclidean distance calculation, which we developed as a plug-in program for Image J (19). On the other hand, we utilized an ultra-fast time-gated camera (LaVision, PicoStar HR) for fluorescence lifetime detection, and then a single exponential decay fitting method for the fluorescence lifetime analysis (35). Finally, for two-photon excited fluorescence detection, a 60x Nikon objective with numerical aperture, 1.4 was utilized. The detected fluorescence signals were recorded in a photmuliplier tube incorporated in the scanning two-photon imaging set-up, and then two-photon images were constructed by an image reconstruction program we developed. In this in vivo imaging study, in order to minimize motion artifacts, we used a gated anesthesia system with a mixture of oxygen and isoflurane.
3. RESULTS AND DISCUSSION
3.1 Multimode optical imaging for tumor detection and delineation by HerGa
3.1.1. Fluorescence intensity imaging
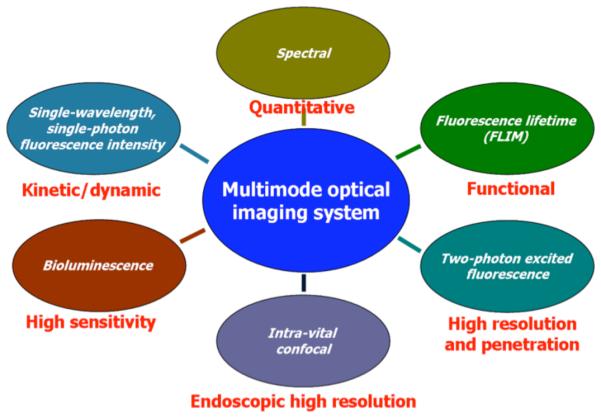
In a previous report, we have already shown HER2+ tumor targeting capability of HerGa, establishing that HerGa specifically accumulates in the tumors, thus enabling their detection (size: ~ 10mm) by HerGa fluorescence difference between the tumor and normal regions (4). We here explored whether the preferential accumulation of HerGa in the tumors allows detecting much smaller tumors (~less 3mm). We acquired fluorescence intensity and photographic images of mice bearing tumors using our custom built multimode optical imaging system, after HerGa IV injection. Figure 2 shows the fluorescence intensity [Fig. 2.(A)] and photographic image [Fig. 2.(B)]. HerGa fluorescence from the tumor is higher than the fluorescence from adjacent normal regions, thus enabling detection of the tumor location as shown previously. Moreover, we observed that the contrast between the tumor and adjacent normal regions increased at the later time points compared to the contrast at the early time points after HerGa IV administration. In our previous report, we noted that significant amount of HerGa was still retained in tumors at 4 days after its IV injection while no detectable amount of HerGa could be seen in normal tissues, particularly the muscle [Hwang, J. Y., and etc al, submitted for publication]. The contrast enhancement with time mentioned here may have resulted from better tumor retention of HerGa than other normal tissues. This suggests that fluorescence intensity imaging of HerGa allows detecting relatively tiny tumors, and that the tumor detection by HerGa fluorescence difference may be better at the later times rather than immediately after HerGa IV injection.
Fig. 2.
Fluorescence intensity image of a mouse that received HerGa
Following IV injection of HerGa, a fluorescence intensity image (A, left) and a photographic image (B, right) were obtained (excitation: 424nm and emission: 620nm). The arrows indicate tumor locations.
3.1.2. Spectral imaging and analysis
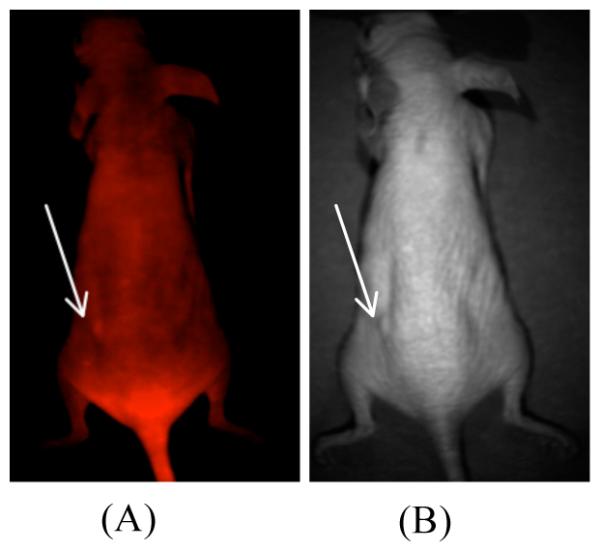
In order to investigate feasibility of spectral imaging and analysis for tumor detection and delineation by HerGa, we acquired 10 sequential images within the spectral range of 500nm to 680nm with a step size of 20nm and a bandwidth of 10nm before and at l day after HerGa administration respectively, and then constructed spectral classified images using a program we developed. Figure 3 shows the spectral classified images and reference spectral signatures. In Fig. 3(A), the spectral classified image (right) obtained after HerGa administration displays a red-pseudo color across the entire mouse, thus yielding low specificity in the discrimination between the tumor and normal regions. Generally, in the typical spectral imaging and analysis, we utilized pre-constructed spectral signatures, normalized for spectral classification, thus being less dependent on fluorescence intensity. Because of this intensity independence, applying a straightforward spectral classification would yield low specificity results in discrimination between tumors and normal regions while HerGa administrated IV still exists, delocalized over the entire mouse. Thus, in order to obtain successful outcomes from this spectral imaging and analysis for tumor detection and delineation by HerGa, we either need to optimize the appropriate timing for spectral image acquisition when HerGa is entirely washed out from other normal regions such as skin and muscle rather than tumor regions, or alternatively utilize other classification methods such as ratiometric spectral imaging. In our other studies, we observed that while HerGa was still significantly retained in tumors at 4 days after IV injection, it was not detected in other tissues, particularly heart, brain, muscle, and etc. In this observation, the typical spectral imaging and analysis provided quantitative discrimination between HerGa and autofluorescence, with high specificity. This indicates that the typical spectral imaging and analysis can be also useful for quantitative tumor detection and delineation by HerGa, under the optimized circumstances. Moreover, the ratiometric spectral imaging we developed also enables quantitative discrimination between tumors and other regions with high sensitivity while HerGa persists in other regions. Taken together, all the results suggest that the spectral imaging and analysis may have a potential for quantitative tumor detection and delineation by HerGa with high specificity, but the use of an appropriate methodology and that optimized imaging parameters/circumstances are required for successful outcomes.
Fig. 3. Spectrally classified image of a mouse that received HerGa IV injection.
(A) spectrally classified images were acquired using typical spectral imaging and analysis before (left) and at 1 day after HerGa IV injection (right). (B) spectral signatures of autofluorescence and HerGa. Red: HerGa, Green: autofluorescence. The arrow indicates tumor location.
3.1.3. Fluorescence lifetime imaging
We performed fluorescence lifetime imaging of a mouse that received HerGa via IV injection in order to investigate the feasibility that tumor detection and delineation can be achieved by fluorescence lifetime difference mapping of HerGa in tumors and normal regions. For fluorescence lifetime imaging, a total of 25 images were acquired within 0 to 4800ps with a time step of 200ps, and then a fluorescence lifetime image was constructed using a first-order exponential decay fitting method. Figure 4 shows the fluorescence lifetime image and its lifetime histogram obtained at the 4th day after HerGa IV administration. The fluorescence lifetimes of HerGa accumulated in tumor regions are somewhat higher than in non-tumor regions as shown in Fig. 4(A). Moreover, the histogram of fluorescence lifetimes in tumor regions has a greater population at 2.0ns than in non-tumor regions. In our other study, we performed multimode optical imaging of HerGa ex vivo with the tumors and the specific organs extracted from this mouse and in vivo while tumor sites and the adjacent regions were exposed after HerGa injection. That report showed that fluorescence lifetimes of HerGa in the tumors are significantly higher that those in liver ex vivo as well as the fluorescence lifetimes of HerGa in the exposed tumors in vivo were higher than those in the exposed adjacent normal regions. The results shown in this paper have a good agreement with our previous results, even though the fluorescence lifetime differences of HerGa in tumors and other regions are somewhat less than those in isolated organs/tissues. Here it is important to mention that the difference of the fluorescence lifetime values of HerGa in tumor and non-tumor regions may become greater if the skin is removed since the fluorescence lifetime values we obtained are the average values from skin, tumor, and muscle. These results suggest the fluorescence lifetime imaging of HerGa may have potential as a method for tumor detection and delineation. In addition, the fluorescence lifetime imaging of HerGa may reflect the micro-environmental status around HerGa since the construct’s fluorescence is dependent on surrounding acidity and probably oxygen. Tumor regions are typically more acidic and hypoxic than normal tissues. Thus, the fluorescence lifetime difference of HerGa between the tumors and normal regions may result from more acidic and hypoxic environment of tumors. This, of course, requires further studies.
Fig. 4. Fluorescence lifetime image and a lifetime histogram of the mouse at 4 days after intravenous injection of HerGa.

(A) Fluorescence lifetime image of the mouse: a total of 25 images were acquired within 0 to 4800ps with a time step of 200ps. Then, a fluorescence lifetime image was constructed through a first-order exponential decay fit. (B) Lifetime histograms within the tumor and non-tumor regions selected by a solid and a dotted circle.
3.1.4. Two-photon excited fluorescence imaging
We performed two-photon excited fluorescence imaging of intact tumors of a mouse that received HerGa after the tumor sites were exposed in order to examine HerGa distribution in the tumors in detail, with high resolution. Figure 5 shows the two-photon exited fluorescence image of the tumor. The bright fluorescence signals indicate HerGa presence, illustrating with high spatial resolution HerGa specific accumulation. This, in turn, clearly highlights microstructures in the tumors [Fig. 5.(A)], but not in normal tissues (muscle) [Fig. 5.(B)]. Thus, this type of imaging may help physician’s decision-making in cancer surgical intervention and detection without the need for rapid histopathological analysis of tissues biopsy during surgery. Furthermore, it can be also utilized one of indicators for assessment of chemotherapy effectiveness, since the treatment efficacy depends on drug distributions in tumors. Taken together, this result indicates that the two-photon excited fluorescence imaging of HerGa can be utilized as a high resolution imaging tool for tumor detection, thus improving the accuracy in tumor detection in addition to fluorescence intensity, spectral, and lifetime imaging.
Fig. 5. Two-photon excited fluorescence images of tumors.
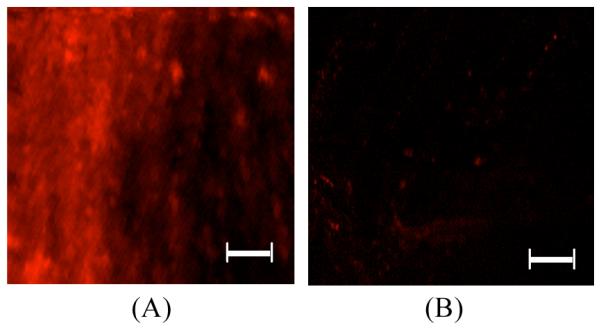
The images of (A) tumor and (B) muscle were acquired using fs pulsed laser at 848nm, an emission filter with 620nm±60nm, Nikon 60x objective. Scale bar: 50μm.
4. CONCLUSIONS
In this paper, we demonstrated the feasibility and advantages of multimode optical imaging of HerGa for tumor detection and delineation. While the fluorescence intensity imaging allows validating the tumor specific targeting capacity of HerGa, thus enabling very small tumor detection and delineation, typical spectral imaging can offer more quantitative and specific information about HerGa location and accumulation, but careful optimization of imaging parameters is needed for successful tumor detection. Most importantly, the fluorescence lifetime imaging enables discrimination between tumor and non-tumor regions by fluorescence lifetime difference of HerGa, and provides micro-environmental information in tissues, simultaneously. Finally, two-photon excited fluorescence imaging of HerGa provided highly-resolved topological information around the tumor regions, thus allowing us to validate the discrimination between tumors and other normal tissues. Taken together, the results suggest the feasibility and superior performance of tumor detection and delineation by multimode optical imaging of HerGa. In particular, the combination of fluorescence intensity, spectral, lifetime, and two-photon excited fluorescence imaging can provide different/complementary information in the tumor identification, location and characterization by HerGa, thus enhancing the ability to diagnose early and treat diseased tissues.
5. ACKNOWLEDGEMENTS
Partial support from the US Navy Bureau of Medicine and Surgery is gratefully acknowledged. This work was partially supported by grants from the NIH (R21 CA116014, R01 CA102126, R01 CA129822, and R01 CA140995), the DoD (BC050662), the Susan G. Komen Breast Cancer foundation (BCTR0201194), and the Donna and Jesse Garber Award. Work at Caltech was supported by NIH DK019038 and the Arnold and Mabel Beckman Foundation. Work at the Technion was supported by The Herbert Irving Cancer and Atherosclerosis Research Fund.
REFERENCES
- [1].Lohrisch C, Piccart M. An overview of HER2. Seminars in Oncology. 2001;28(6 Suppl 18):3–11. [PubMed] [Google Scholar]
- [2].Colombo M, Corsi F, Foschi D, Mazzantini E, Mazzucchelli S, Morasso C, Occhipinti E, Polito L, Prosperi D, Ronchi S, Verderio P. HER2 targeting as a two-sided strategy for breast cancer diagnosis and treatment: Outlook and recent implications in nanomedical approaches. Pharmacol Res. 2010;62(2):150–165. doi: 10.1016/j.phrs.2010.01.013. [DOI] [PubMed] [Google Scholar]
- [3].Medina-Kauwe LK, Maguire M, Kasahara N, Kedes L. Non-viral gene delivery to human breast cancer cells by targeted Ad5 penton proteins. Gene Therapy. 2001;8:1753–1761. doi: 10.1038/sj.gt.3301583. [DOI] [PubMed] [Google Scholar]
- [4].Agadjanian H, Ma J, Rentsendorj A, Valluripalli V, Hwang JY, Mahammed A, Farkas DL, Gray HB, Gross Z, Medina-Kauwe LK. Tumor detection and elimination by a targeted gallium corrole. Proc Natl Acad Sci U S A. 2009;106(15):6105–6110. doi: 10.1073/pnas.0901531106. [DOI] [PMC free article] [PubMed] [Google Scholar]
- [5].Hwang JY, Wachsmann-Hogiu S, Ramanujan VK, Nowatzyk AG, Koronyo Y, Medina-Kauwe LK, Gross Z, Gray HB, Farkas DL. Multimodal wide-field two-photon excitation imaging: characterization of the technique for in vivo applications. Biomedical Optics Express. 2011;2(2):356–364. doi: 10.1364/BOE.2.000356. [DOI] [PMC free article] [PubMed] [Google Scholar]
- [6].Hoffman RM. In vivo cell biology of cancer cells visualized with fluorescent proteins. Curr Top Dev Biol. 2005;7:121–144. doi: 10.1016/S0070-2153(05)70006-5. [DOI] [PubMed] [Google Scholar]
- [7].Vooijs M, Jonkers J, Lyons S, Berns A. Noninvasive imaging of spontaneous retinoblastoma pathway-dependent tumors in mice. Cancer Res. 2002;62(6):1862–1867. [PubMed] [Google Scholar]
- [8].Paulmurugan R, Massoud TF, Huang J, Gambhir SS. Molecular imaging of drug-modulated protein-protein interactions in living subjects. Cancer Res. 2004;64(6):2113–2119. doi: 10.1158/0008-5472.can-03-2972. [DOI] [PMC free article] [PubMed] [Google Scholar]
- [9].Contag CH. In vivo pathology: seeing with molecular specificity and cellular resolution in the living body. Annu Rev Pathol. 2007;2:277–305. doi: 10.1146/annurev.pathol.2.010506.091930. [DOI] [PubMed] [Google Scholar]
- [10].Chen X, Conti PS, Moats RA. In vivo near-infrared fluorescence imaging of integrin alphavbeta3 in brain tumor xenografts. Cancer Res. 2004;64(21):8009–8014. doi: 10.1158/0008-5472.CAN-04-1956. [DOI] [PubMed] [Google Scholar]
- [11].Rice BW, Cable MD, Nelson MB. In vivo imaging of light-emitting probes. J Biomed Opt. 2001;6(4):432–440. doi: 10.1117/1.1413210. [DOI] [PubMed] [Google Scholar]
- [12].Hoffman RM. Imaging tumor angiogenesis with fluorescent proteins. Apmis. 2004;112(7-8):441–449. doi: 10.1111/j.1600-0463.2004.apm11207-0806.x. [DOI] [PubMed] [Google Scholar]
- [13].Contag CH, Bachmann MH. Advances in in vivo bioluminescence imaging of gene expression. Annu Rev Biomed Eng. 2002;4:235–260. doi: 10.1146/annurev.bioeng.4.111901.093336. [DOI] [PubMed] [Google Scholar]
- [14].Yamauchi K, Yang M, Jiang P, Yamamoto N, Xu M, Amoh Y, Tsuji K, Bouvet M, Tsuchiya H, Tomita K, Moossa AR, Hoffman RM. Real-time in vivo dual-color imaging of intracapillary cancer cell and nucleus deformation and migration. Cancer Res. 2005;65(10):4246–4252. doi: 10.1158/0008-5472.CAN-05-0069. [DOI] [PubMed] [Google Scholar]
- [15].Bouvet M, Wang J, Nardin SR, Nassirpour R, Yang M, Baranov E, Jiang P, Moossa AR, Hoffman RM. Real-time optical imaging of primary tumor growth and multiple metastatic events in a pancreatic cancer orthotopic model. Cancer Res. 2002;62(5):1534–1540. [PubMed] [Google Scholar]
- [16].Farkas DL, Becker D. Applications of spectral imaging: detection and analysis of human melanoma and its precursors. Pigment Cell Res. 2001;14(1):2–8. doi: 10.1034/j.1600-0749.2001.140102.x. [DOI] [PubMed] [Google Scholar]
- [17].Yang M, Baranov E, Jiang P, Sun FX, Li XM, Li L, Hasegawa S, Bouvet M, Al-Tuwaijri M, Chishima T, Shimada H, Moossa AR, Penman S, Hoffman RM. Whole-body optical imaging of green fluorescent protein-expressing tumors and metastases. Proc Natl Acad Sci U S A. 2000;97(3):1206–1211. doi: 10.1073/pnas.97.3.1206. [DOI] [PMC free article] [PubMed] [Google Scholar]
- [18].Levenson RM, Lynch DT, Kobayashi H, Backer JM, Backer MV. Multiplexing with multispectral imaging: from mice to microscopy. Ilar J. 2008;49(1):78–88. doi: 10.1093/ilar.49.1.78. [DOI] [PubMed] [Google Scholar]
- [19].Chung A, Karlan S, Lindsley E, Wachsmann-Hogiu S, Farkas DL. In vivo cytometry: a spectrum of possibilities. Cytometry A. 2006;69(3):142–146. doi: 10.1002/cyto.a.20220. [DOI] [PubMed] [Google Scholar]
- [20].Levenson RM, Mansfield JR. Multispectral imaging in biology and medicine: slices of life. Cytometry A. 2006;69(8):748–758. doi: 10.1002/cyto.a.20319. [DOI] [PubMed] [Google Scholar]
- [21].Carano RA, Ross AL, Ross J, Williams SP, Koeppen H, Schwall RH, Van Bruggen N. Quantification of tumor tissue populations by multispectral analysis. Magn Reson Med. 2004;51(3):542–551. doi: 10.1002/mrm.10731. [DOI] [PubMed] [Google Scholar]
- [22].Macville MV, Van der Laak JA, Speel EJ, Katzir N, Garini Y, Soenksen D, McNamara G, de Wilde PC, Hanselaar AG, Hopman AH, Ried T. Spectral imaging of multi-color chromogenic dyes in pathological specimens. Anal Cell Pathol. 2001;22(3):133–142. doi: 10.1155/2001/740909. [DOI] [PMC free article] [PubMed] [Google Scholar]
- [23].MacKinnon N, Stange U, Lane P, MacAulay C, Quatrevalet M. Spectrally programmable light engine for in vitro or in vivo molecular imaging and spectroscopy. Appl Opt. 2005;44(11):2033–2040. doi: 10.1364/ao.44.002033. [DOI] [PubMed] [Google Scholar]
- [24].Hanson KM, Behne MJ, Barry NP, Mauro TM, Gratton E, Clegg RM. Two-photon fluorescence lifetime imaging of the skin stratum corneum pH gradient. Biophys J. 2002;83(3):1682–1690. doi: 10.1016/S0006-3495(02)73936-2. [DOI] [PMC free article] [PubMed] [Google Scholar]
- [25].Cubeddu R, Canti G, Taroni P, Valentini G. Time-gated fluorescence imaging for the diagnosis of tumors in a murine model. Photochem Photobiol. 1993;57(3):480–485. doi: 10.1111/j.1751-1097.1993.tb02322.x. [DOI] [PubMed] [Google Scholar]
- [26].Spriet C, Trinel D, Riquet F, Vandenbunder B, Usson Y, Heliot L. Enhanced FRET contrast in lifetime imaging. Cytometry A. 2008;73(8):745–753. doi: 10.1002/cyto.a.20581. [DOI] [PubMed] [Google Scholar]
- [27].Lin HJ, Herman P, Lakowicz JR. Fluorescence lifetime-resolved pH imaging of living cells. Cytometry A. 2003;52(2):77–89. doi: 10.1002/cyto.a.10028. [DOI] [PMC free article] [PubMed] [Google Scholar]
- [28].Murata S, Herman P, Lin HJ, Lakowicz JR. Fluorescence lifetime imaging of nuclear DNA: effect of fluorescence resonance energy transfer. Cytometry. 2000;41(3):178–185. doi: 10.1002/1097-0320(20001101)41:3<178::aid-cyto4>3.0.co;2-n. [DOI] [PMC free article] [PubMed] [Google Scholar]
- [29].Cubeddu R, Canti G, Pifferi A, Taroni P, Valentini G. Fluorescence lifetime imaging of experimental tumors in hematoporphyrin derivative-sensitized mice. Photochem Photobiol. 1997;66(2):229–236. doi: 10.1111/j.1751-1097.1997.tb08648.x. [DOI] [PubMed] [Google Scholar]
- [30].Gratton E, Breusegem S, Sutin J, Ruan Q, Barry N. Fluorescence lifetime imaging for the two-photon microscope: time-domain and frequency-domain methods. J Biomed Opt. 2003;8(3):381–390. doi: 10.1117/1.1586704. [DOI] [PubMed] [Google Scholar]
- [31].Denk W, Strickler JH, Webb WW. Two-photon laser scanning fluorescence microscopy. Science. 1990;248(4951):73–76. doi: 10.1126/science.2321027. [DOI] [PubMed] [Google Scholar]
- [32].Patterson GH, Piston DW. Photobleaching in two-photon excitation microscopy. Biophys J. 2000;78(4):2159–2162. doi: 10.1016/S0006-3495(00)76762-2. [DOI] [PMC free article] [PubMed] [Google Scholar]
- [33].Chirico G, Cannone F, Baldini G, Diaspro A. Two-photon thermal bleaching of single fluorescent molecules. Biophys J. 2003;84(1):588–598. doi: 10.1016/S0006-3495(03)74879-6. [DOI] [PMC free article] [PubMed] [Google Scholar]
- [34].Agadjanian H, Weaver JJ, Mahammed A, Rentsendorj A, Bass S, Kim J, Dmochowski IJ, Margalit R, Gray HB, Gross Z, Medina-Kauwe LK. Specific delivery of corroles to cells via noncovalent conjugates with viral proteins. Pharmaceutical Research. 2006;23(2):367–377. doi: 10.1007/s11095-005-9225-1. [DOI] [PubMed] [Google Scholar]
- [35].Foss SD. A method of exponential curve fitting by numerical integration. Biometr. 1970;26:815–821. [Google Scholar]