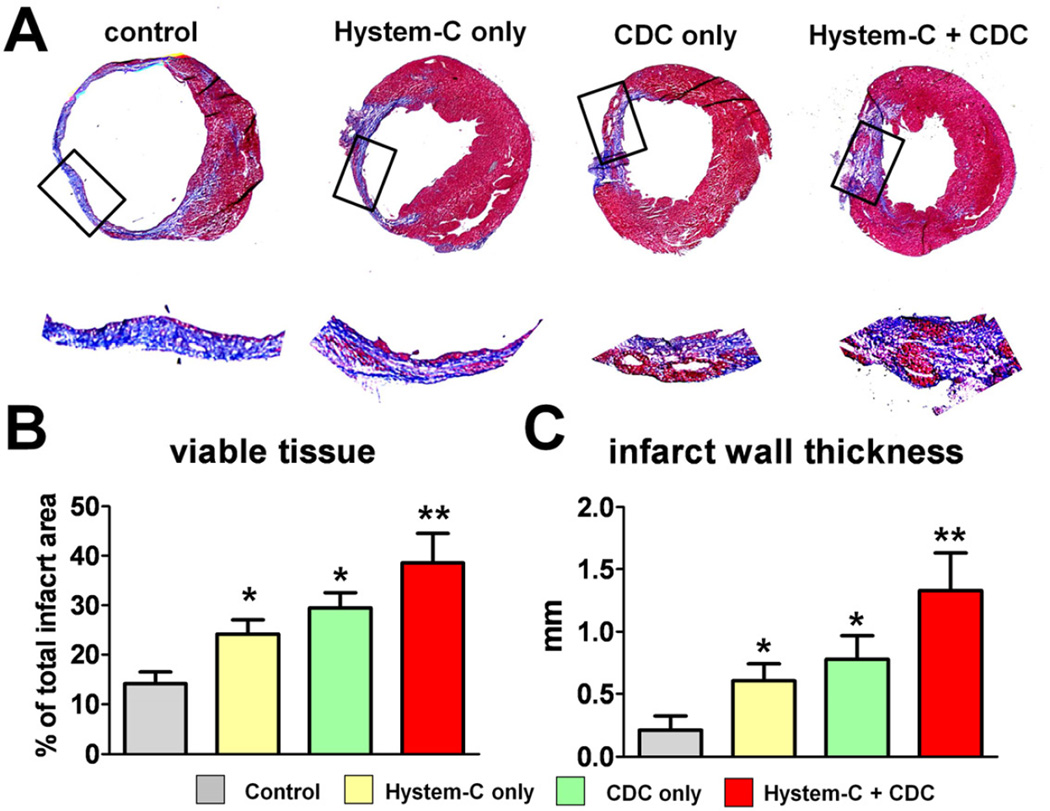
Figure 4. Heart morphometry analysis.
A, Representative Masson’s trichrome-stained myocardial sections 3 weeks after treatment. Scar tissue and viable myocardium are identified by blue and red color, respectively. The infarct area in the snap-shot box is magnified. B & C, Quantitative analysis and LV morphometric parameters of the Masson’s trichrome images (n=3–5 mice per group). * indicates p<0.05 when compared to Control. ** indicates p<0.05 when compared to any other group.

