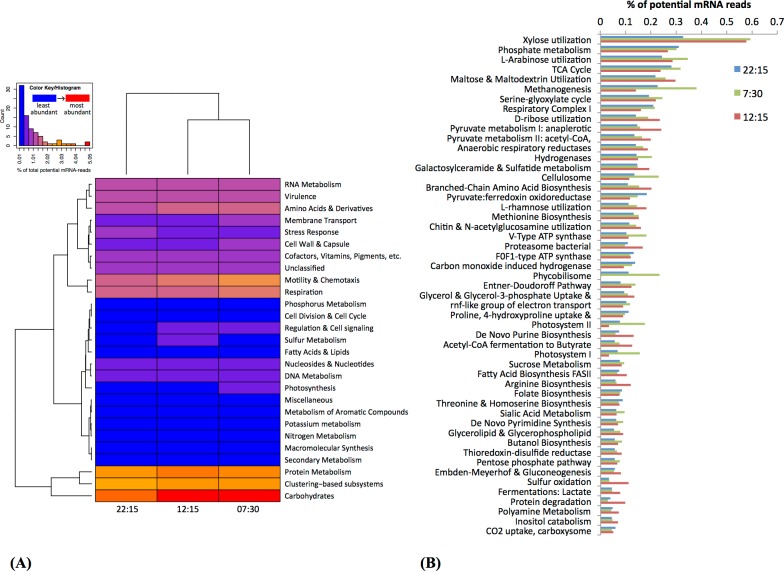
Figure 3. Functional classification and distribution of mRNA transcripts from Zodletone sediment samples.
The heatmap (A) shows a functional-based clustering of samples based on transcript annotations into MG-Rast (v2) subsystem categories. The bar graph (B) shows the most abundant metabolic subsystems identified from Zodletone source metatranscriptomes at night (blue bars), in the early morning (green bars), and in the afternoon (pink bars).

