

Abstract
Natural killer (NK) cells play an important role in virus infection, their action being regulated by several activating and inhibitory receptors. The NKp30 activating receptor and its isoforms have recently emerged as important determinants of efficient NK cell responses. We determined the relative proportions of NKp30 isoforms in patients with chronic hepatitis C virus (HCV) infection and healthy donors (HD). NK cell function (degranulation and cytokine production) and correlations with clinical parameters were assessed following unsupervised hierarchical clustering of patients according to isoform expression. NKp30 receptor expression on NK cells and all isoforms were reduced in HCV-infected patients. Patients were clustered into two groups: the HCV-1 group had similar isoform expression to the HD group, whereas the HCV-2 group had lower expression. The latter showed a better functional activity, and a higher proportion of the activating a isoform and of the NKp30 isoform a/c ratio compared with the HCV-1 cluster. There was a positive correlation between the activating a isoform and liver stiffness and an inverse relationship between the immunosuppressive c isoform and the fibrosis 4 score, suggesting a potentially important role of NKp30 isoforms in influencing liver damage and ensuing fibrosis.
Keywords: interferon-γ, liver fibrosis, natural killer cells, unsupervised hierarchical clustering
Introduction
Natural killer (NK) cells are a major component of the innate immune system that are instrumental in establishing a coordinated and efficient adaptive immune response in viral infections.1 Their activity is tightly regulated by a complex network of signals, which interact with membrane-expressed, germ line-encoded, inhibitory and activating receptors.2 The latter allow recognition of altered self via binding to ligands expressed by stressed cells, effectively functioning as danger signals.3 Up-regulation of these receptors, such as NKG2D, NKG2C and the natural cytotoxicity receptors (NCRs: NKp30, NKp46, NKp44), with concomitant reduction of ligands of inhibitory receptors (i.e. killer-cell immunoglobulin-like receptors or NKG2A) may tip the balance of NK cells from inhibition to activation.4 The major activating receptor NKG2D recognizes stress-induced self molecules, is constitutively expressed at high levels on NK cells and may further augment its expression during chronic viral infections such as hepatitis C virus (HCV).5 In contrast NCRs are variably expressed and their ligands less defined, although increasing evidence indicates that they recognize tumour-induced or pathogen-derived molecules.4 Some viruses can evade NCR-mediated killing by inhibiting expression of their ligands on cellular targets or affecting expression of NCRs themselves.6 Among NCRs, NKp30 has recently received attention because it is involved in both dendritic cell killing and dendritic cell maturation and appears not only to be critical for tumour-cell recognition but also to influence the prognosis of different infectious diseases.7,8 There are six different splice variants of the NKp30-encoding gene NCR3, which are known to be expressed on the cell surface. Three of them (NKp30a–c), the most frequently represented isoforms, encode a molecule with an extracellular V-type domain, and the other three (NKp30d–f) encode a C-type immunoglobulin domain.9 Cells transfected with NKp30a and NKp30b release large amounts of interferon-γ (IFN-γ) after NKp30 engagement or co-culture with target cells, whereas NKp30c-transfected cells produce interleukin-10 and very little IFN-γ. Therefore, NKp30a and NKp30b are thought to represent immune stimulatory isoforms, which are able to release T helper type 1 (Th1) cytokines whereas NKp30c mediates an immunosuppressive signal by producing interleukin-10. These differences in the activating potential are thought to be due to the fact that NKp30c, in contrast to NKp30a and NKp30b, shows a reduced association with CD3ζ after cross-linking. Importantly, the predominant expression of its immunosuppressive isoform c, compared with the immunostimulatory a and b isoforms, was associated with reduced survival of patients with gastrointestinal stromal tumour, which expresses NKp30 ligands. Concomitant with this, decreased NKp30-dependent tumour necrosis factor-α (TNF-α) and CD107a release, and defective IFN-γ production have been documented.10 Moreover, recent data indicate that children with metastatic neuroblastoma have deficient transcription of the NKp30a and NKp30b isoforms over the immunosuppressive NKp30c isoform compared with those with localized neuroblastoma. Importantly, serum levels of NKp30 ligands such as B7-H6 correlated with deficient production of IFN-γ by NK cells and were involved with tumour progression and resistance to chemotherapy, suggesting the existence of an important mechanism of tumour escape from NK immune surveillance via NKp30 receptor down-modulation.11
Until recently NKp30 isoforms were not investigated in viral infections, as most studies in the field focused on NK cell-mediated control of cancer.10,11 Because NKp30 expression is significantly down-modulated on NK cells from HIV-1-infected individuals, one study sought to determine the potential prognostic impact of the isoforms a, b and c in HIV-1 infection.12 However, there was no correlation between the relative NKp30 isoform expression levels and surface NKp30 expression in HIV-1-infected patients. Moreover, NKp30 down-regulation did not convey any prognostic value, nor did the relative proportions of NKp30 isoforms affect disease progression.
Hepatitis C virus shares with HIV the high propensity to induce a chronic, even though curable, infection.13 NK cells from these patients have variable expression of NKp30 with some studies indicating normal,5 increased14,15 or reduced16,17 ex vivo expression of NKp30 on peripheral blood NK cells. Interestingly, exposure of NK cells to cell-associated HCV resulted in impaired NK cytotoxic and cytokine-secreting function, which was selectively associated with reduced surface expression of NKp30, suggesting that interaction of NKp30 with an as yet undefined virus-induced ligand(s) may directly influence NK function.18 Moreover, enhanced expression of NKp30 on NK cells resulted in protection from developing HCV infection in multiply exposed uninfected individuals,19 and was associated with an early virological response to IFN-α-based therapies,20 emphasizing the importance of this activating receptor in the control of HCV infection. We therefore investigated the frequencies of NKp30a, b and c isoforms in a group of HCV-infected individuals seeking possible associated functional implications and clinical correlates.
Materials and methods
Patients
Peripheral blood mononuclear cells (PBMC) were isolated by Ficoll-Hypaque density gradient centrifugation from a total of 65 patients with chronic HCV infection and from 27 healthy donors (HD). Patient characteristics are summarized in Table1.21 Written informed consent was obtained from each individual. The study protocol conformed to the ethical guidelines of the 1975 Declaration of Helsinki and was approved by our institutional ethics committee. Freshly isolated PBMC were processed for RNA extraction after storage at −20° in RNAlater (Sigma-Aldrich, St Louis, MI). Alternatively, cells were cryopreserved in liquid N2 until use.
Table 1.
Characteristics of patients and healthy donors
| HCV-positive patients | Healthy donors | |
|---|---|---|
| No. of subjects | 65 | 27 |
| Sex (M/F) | 31/34 | 9/18 |
| Age (years) | 66 (25–83) | 48 (25–60) |
| ALT (U/ml) | 40 (13–331) | 20 (14–33) |
| HCV RNA (IU/ml) | 7·1 × 105 (7·4 × 103–1·1 × 107) | Negative |
| Viral genotype | 57/65 | ND |
| 1 | 30 | |
| 2 | 22 | |
| 3 | 2 | |
| 4 | 3 | |
| Stage1 | 1 (1–4) | ND |
| HAI1 | 5 (3–15) | ND |
ALT, alanine aminotransferase; HAI, histology activity index; ND, not done.
Data are shown as median and range.
According to Knodell.21
RNA extraction and quantitative PCR
The levels of expression of the three major NKp30 isoforms were measured by quantitative real-time PCR (qPCR) and normalized to the expression level of the housekeeping gene β2-microglobulin (B2M). Total cellular RNA was extracted from frozen ex vivo or exposed PBMC with the RNeasy Plus Mini kit and gDNA eliminator spin columns (Qiagen, Milan, Italy). RNA quantity and purity were determined on a NanoDrop 2000 Spectrophotometer (NanoDrop Technologies, Wilmington, DE). First-strand cDNA was synthesized from 5 μg of total RNA using SuperScript III reverse transcriptase and random primers, according to the manufacturer’s instructions (Life Technologies, Carlsbad, CA). The PCR primers and TaqMan probes (Life Technologies) for the NKp30 transcripts and the B2M housekeeping transcript were designed as previously described.10 Quantitative PCR was performed using TaqMan Gene Expression Master Mix (Life Technologies) and NKp30 or B2M primers (10 μm) and probes (5 μm) in a final volume of 25 μl using a CFX96 Real-Time machine detection system (BioRad, Hercules, CA). One initial incubation at 50° for 2 min was followed by one cycle of denaturation (95° for 10 min) and 45 cycles of amplification (95° for 15 seconds and 60° for 60 seconds). The efficiencies of NKp30a, NKp30b and NKp30c PCR primers were 99·4%, 93·8% and 101·7%, respectively. Each sample was amplified in triplicate and the qPCR data were analysed using the 2−ΔCt method.22
Unsupervised hierarchical clustering
The ΔΔCt method (−[(HCVNKp30 − HCVB2M) − (HDNKp30 − HDB2M)]) was used to determine the level of expression of NKp30 isoforms in HCV-positive (HCV+) patients compared with HD.22 Unsupervised hierarchical clustering was applied to data using the Orange Canvas program with Pearson’s centred correlation.12 The cluster produced was based on the different levels of expression of each NKp30 isoform in HCV patients compared with HD: −ΔΔCt cluster. The proportions of the distinct NKp30 isoforms were determined as the ratio of the relative quantities of each isoform and the total quantity of the three isoforms. A second clustering was applied to HCV+ patients to compare the relative quantities of each isoform with the other. Profile AB is characterized by a predominant expression of the immune stimulatory NKp30a and NKp30b isoforms, whereas profile C shows higher expression of the immune suppressive NKp30c isoform.10 The NKp30 isoform a/b, a/c and b/c ratios were determined by the following formula: NKp30x/NKp30y = 2(ΔΔCtNKp30y − ΔΔCtNKp30x).12
NK cell phenotype and functional characterization
Flow cytometric analysis of frozen PBMC from HCV+ patients and HD was performed using a FACSCalibur (Becton Dickinson, BD, San Diego, CA) or CyAn ADP instrument (DAKO, Santa Clara, CA). To characterize the NK cell phenotype the following mouse anti-human monoclonal antibodies (mAbs) were used: CD3-FITC (Immunotools, Friesoythe, Germany), CD56-Pc5 (Beckman Coulter, Brea, CA), CD16-phycoerythrin (BD) and NKp30-Alexa Fluor®647 (BioLegend, San Diego, CA). Briefly, 2 × 10⁵ PBMC were stained with mAb for 30 min at 4°, washed, immediately fixed in CellFix solution (BD) and analysed using the Kaluza 1.3 software provided by Beckman Coulter. Lymphocytes were identified by the characteristic forward scatter (FSC) and side scatter (SSC) parameters. Total NK cells were identified as a CD3− CD56+ population within the lymphocyte gate or as CD56bright (CD3− CD56bright CD16−) and CD56dim (CD3− CD56dim CD16+/−). The percentages of NKp30+ cells were expressed as the frequency of cells of the CD3− CD56+ gated population. Functional assay was performed after cross-linking of NKp30 and the FcγR+ P815 murine cell line as target cells as described.5 Briefly, PBMC were washed and incubated for 4 hr at 37° with FcγR+ P815 murine target cells (effector : target = 1 : 1) in the presence of the mAb specific for the NKp30 receptor (kindly provided by A. Moretta, University of Genoa, Italy), anti-CD107a PE-Cy7 (BD) and the Protein Transport Inhibitor GolgiStop (BD). After washing, PBMC were stained for surface NK cell markers using CD3-PacificBlue (BD) and CD56-Pc5.5 (Beckman Coulter). Subsequently, cells were fixed with BD Cytofix/Cytoperm and permeabilized with the BD Perm/Wash buffer (BD) according to the manufacturer’s instructions, in the presence of IFN-γ-FITC (Beckman Coulter) and TNF-α-phyoerythin (BD). LIVE/DEAD® Fixable Near-IR Dead Cell Stain Kit (Life Technologies) was used to determine the viability of the cells. Data analysis was performed with the Kaluza 1.3 software.
HCV replication system
Huh-7.5 cells and Japanese fulminant hepatitis HCV genotype 2a strain JFH-1 clone (pJFH-1) were kindly provided by T. Wakita (National Institute of Infectious Diseases, Tokyo, Japan) and were grown as previously described.23 HCV RNA transfection was achieved by electroporation with genomic HCV RNA transcribed in vitro from pJFH-1, as previously described.24 Culture medium was collected, concentrated 30-fold using an Amicon Ultra-15 device (molecular weight cut off: 1 × 10⁵ Da; Merck KGaA, Darmstadt, Germany), stored at −80° and subsequently used to infect naive Huh-7.5 cells. HCV RNA in culture medium was determined by qPCR. To this end, total RNA was extracted with a QIAamp Viral RNA kit (Qiagen) from 140 μl of culture medium and qPCR was performed with an AgPAth-ID One-Step RT-PCR Kit (Life Technologies) and a CFX96 Real-Time machine detection system (BioRad) according to manufacturer’s instructions and relative to a standard curve comprised of serial dilutions of JFH-1 plasmid. The forward and reverse primers were 5′TCCCGGGAGAGCCATAGTG-3′ and 5′-GCACCCTATCAGGCAGTACCA-3′, respectively. The TaqMan probe was 5′-6(FAM)-TCTGCGGAACCGGTG-MGB-3′. Briefly, naive Huh-7.5 cells were seeded at a density of 1 × 10⁶ in a T75 tissue culture flask, infected overnight with 1 × 10⁶ copies of cell-culture-derived HCV, and analysed after 6 days by flow cytometry or immunofluorescence for HCV protein expression using human mAbs B12.F8 specific for HCV core25 and CM3.B6 specific for HCV non-structural protein 3 helicase/nucleoside triphosphatase domain.26
Exposure of PBMC to HCV+ Huh-7.5 cells
Freshly isolated PBMC (107 cells) from HCV+ patients and HD were co-cultured with 2·5 × 106 uninfected or HCV-infected Huh-7.5 cells. After 24 hr, PBMC were washed and total RNA was extracted. More than 90% of HCV-infected Huh-7.5 cells used in the experiments expressed HCV core protein and non-structural protein 3 (data not shown).
Statistical analysis
All statistical and graphic analyses were performed using GraphPad Prism software (GraphPad Software Inc, La Jolla, CA). The two-tailed Mann–Whitney test was used to detect differences between groups and correlations between variables were evaluated by calculation of Spearman’s correlation coefficient. A P-value ≤ 0·05 was deemed statistically significant.
Results
NKp30 isoform expression level
To investigate the role of NKp30 in HCV+ patients we explored the expression of NKp30 on NK cells and quantified the three major NKp30 isoforms (NKp30a, b and c) in PBMC from HCV-infected individuals and HD, using qPCR and the 2−ΔCt analysis method. There were no differences in the proportions of total peripheral blood NK cells between HCV patients and HD (mean ± SEM, HCV: 14·8% ± 1·8; HD: 18·3% ± 2·0). The gating strategy for NKp30+ NK cells is shown in Fig.1(a). There was a significantly lower expression of NKp30 on NK cells from HCV-infected patients (Fig.1b). A statistically significant reduction in the percentage of NKp30+ cells was also observed among CD56bright and CD56dim cells of HCV+ patients compared with HD (data not shown). Although there was a trend towards reduced expression of all NKp30 isoforms in HCV-infected individuals, a statistically significant reduction was observed for the isoform c only (Fig.1c). We then examined the ratios of the different NKp30 isoforms, a/b, a/c and b/c, in HCV+ patients and HD. As shown in Fig.1(d), the NKp30 isoform a/c ratio was significantly higher in HCV-infected subjects compared with HD, whereas no differences in the a/b and b/c ratios were found (data not shown). The percentage of NKp30+ NK cells and the distribution of NKp30 isoforms were similar in patients infected with genotype 1 compared with those infected with genotypes 2 and 3 (data not shown).
Figure 1.

NKp30-expressing natural killer (NK) cells and expression of NKp30 isoforms are reduced in hepatitis C virus (HCV) -infected individuals compared with healthy donors (HD). (a) Representative experiment showing the gating strategy and NKp30 expression among CD3− CD56+ cells. (b) Frequency of NKp30-expressing NK cells in HCV+ patients (n = 33), and HD (n = 26). (c) Levels of the three major NKp30 isoforms (NKp30a, b and c) in HCV+ patients (n = 55) and HD (n = 19). Results are expressed as mean ± SEM. (d) NKp30 isoform a/c ratio in HCV+ patients and HD. Data in (b) and (d) are shown as box and whiskers with middle bars being median values, box plots are 25% and 75% centiles, whiskers are minimum and maximum values.
Unsupervised hierarchical clustering performed on the relative expression of NKp30 isoforms from HCV+ patients and HD showed that the AB was the predominant profile among healthy individuals, 64% of whom (16/25) expressing mainly the NKp30a and b isoforms, in agreement with previous work.7 HCV-infected patients had similar isoform distribution with profile AB being mostly represented (51/65, 78%, data not shown). There was no difference in the frequencies of NKp30+ NK cells between patients characterized by profile C compared with those with profile AB (data not shown). When clustering was applied to expression of the three NKp30 isoforms analysed using the ΔΔCt method, HCV+ patients were classified into two groups reflecting the mRNA expression level compared with HD (HD = 19, NKp30a mean ΔCt 11·78; NKp30b mean ΔCt 7·89 and NKp30c mean ΔCt 10·13). The HCV-1 cluster of patients displayed an expression level of all NKp30 isoforms equal to control samples (n = 34, NKp30a mean ΔCt 11·46; NKp30b mean ΔCt 8·05 and NKp30c mean ΔCt 10·84), whereas patients belonging to the HCV-2 cluster showed NKp30a, b and c mRNA expression levels significantly lower than HCV-1 and HD (n = 21, NKp30a mean ΔCt 12·76; NKp30b mean ΔCt 10·20 and NKp30c mean ΔCt 13·26) (Fig.2a).
Figure 2.
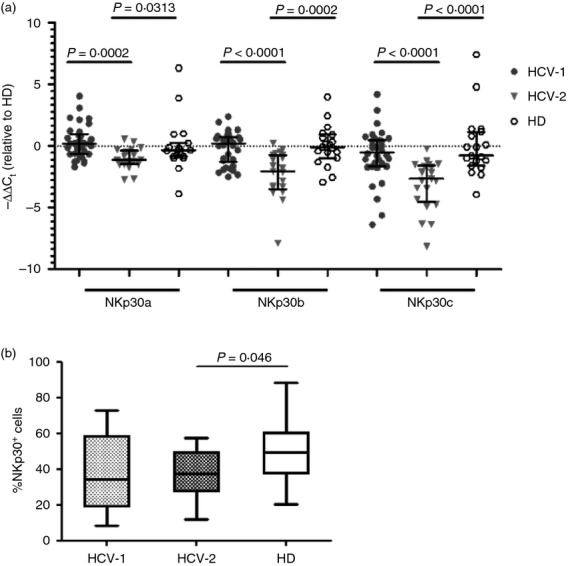
Unsupervised hierarchical clustering of hepatitis C virus positive (HCV+) patients based on NKp30 mRNA expression levels identified two groups with different isoform expression. (a) HCV+ patients (n = 55) were clustered into two groups: HCV-1 (n = 34), and HCV-2 (n = 21) based on NKp30 isoform expression levels as compared with healthy donors (HD) (n = 19). Data are expressed as median and interquartile range. (b) Frequencies of NKp30+ NK cells for each of the two clusters of HCV+ patients and for HD. HCV-1 n = 19, HCV-2 n = 12, HD n = 26. Middle bars are median values, box plots are 25% and 75% centiles, whiskers are minimum and maximum values.
Comparison of the proportions of NKp30+ NK cells between the two clusters of patients showed that HCV-2, in which all three isoforms were under-represented, had a statistically lower proportion of cells expressing NKp30 compared with HD (Fig.2b).
Functional analysis
We next studied NKp30-mediated cytolytic potential and cytokine production of HCV+ patients and HD using an ex vivo redirected functional assay without cytokine stimulation. PBMC were incubated with the FcγR+ P815 murine target cell line in the presence or absence of anti-NKp30 mAb. There was a trend towards increased CD107a degranulation in the reverse antibody-dependent cellular cytotoxicity assay in HCV-infected individuals (data not shown), as shown previously;5 however, no differences in IFN-γ and TNF-α production were noted compared with HD (data not shown). When we analysed the functional characteristics for each group of patients defined by the clustering analysis, we found that the proportion of NK cells expressing CD107a and producing IFN-γ and TNF-α from HCV-2 patients, showing a reduced mRNA expression level of all three NKp30 isoforms, was significantly increased compared with HCV-1 and HD (Fig.3a–c). Individuals grouped under clusters HCV-1 and HCV-2 did not differ in terms of clinical, biochemical, histological and virological parameters (data not shown).
Figure 3.
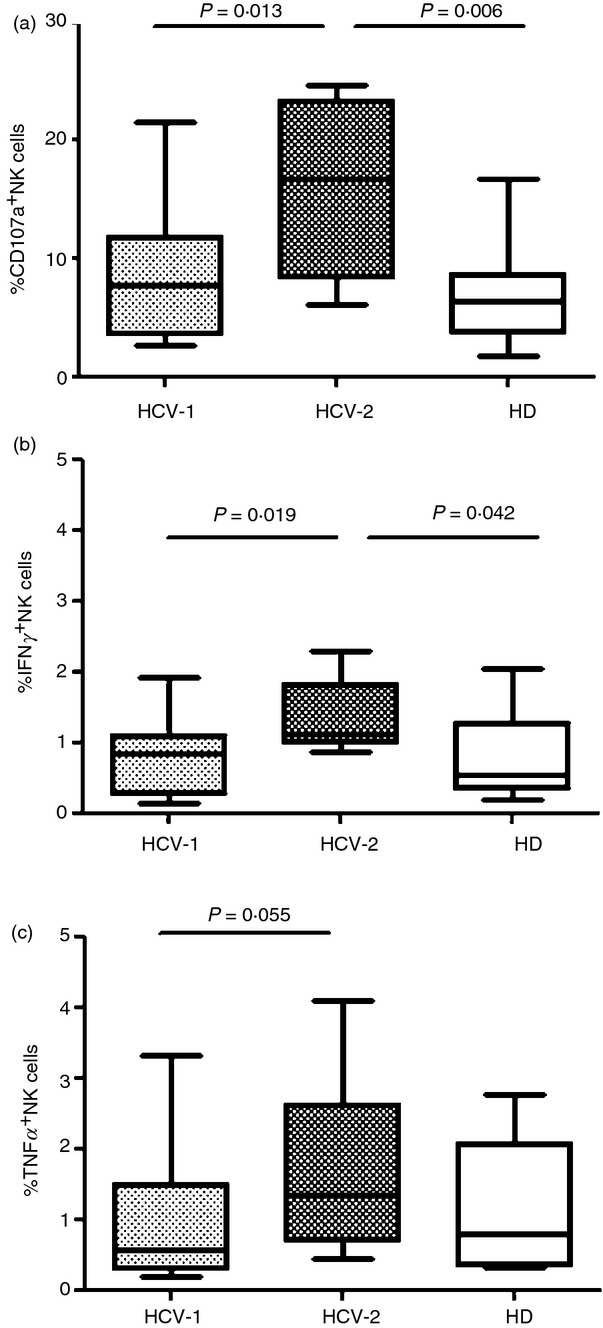
Patients belonging to the HCV-2 cluster displayed a functionally fitter natural killer (NK) cell population. NK cell degranulation (a) and cytokine production (b, c) were evaluated following NKp30 cross-linking in the HCV-1 cluster of patients (n = 19), HCV-2 (n = 8) and healthy donors (HD; n = 13). Middle bars are median values, box plots are 25% and 75% centiles, whiskers are minimum and maximum values.
To determine whether the increased functionality of NK cells from HCV-2 patients was the result of different proportions of the three NKp30 isoforms, we determined the ratio of the relative quantities of each isoform to the total quantity of the three isoforms. The relative expression of NKp30b and c isoforms was similar in HCV-1 and HCV-2 clusters compared with each other and with HD. Interestingly, NK cells from individuals belonging to the HCV-2 cluster showed a significantly increased percentage of the immunostimulatory NKp30a isoform compared with HCV-1 patients and HD (Fig.4a). Moreover, the NKp30 isoform a/c ratio was significantly increased in the HCV-2 cluster of patients compared with those clustered as HCV-1 and with HD (Fig.4b). Exposure of PBMC from HCV-infected patients and HD to cell-culture-derived HCV did not alter the relative proportions of NKp30 isoforms (data not shown).
Figure 4.
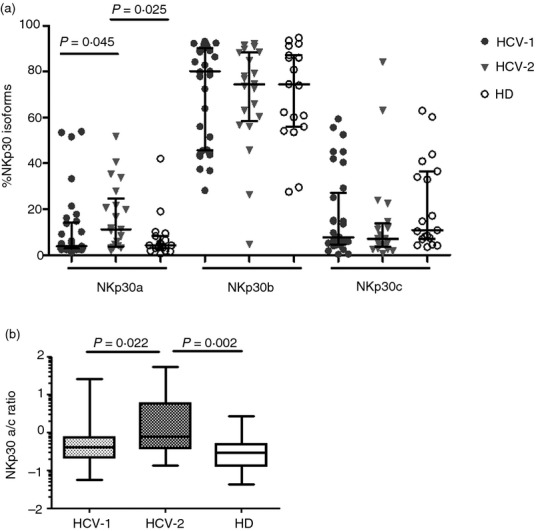
The relative expression of NKp30 isoforms differ among hepatitis C virus-positive (HCV+) individuals. (a) Frequencies of the distinct NKp30 isoforms shown as the ratio of the relative quantities of each isoform to the total quantity of the three isoforms for the HCV-1 (n = 34) and HCV-2 (n = 21) patient clusters compared with healthy donors (HD) (n = 19). Results are expressed as medians and interquartile ranges. (b) NKp30 isoform a/c ratios in the same number of HCV-1 and HCV-2 patients and for HD. Middle bars are median values, box plots are 25% and 75% centiles, whiskers are minimum and maximum values.
Interestingly, a statistically significant correlation was found between liver stiffness assessed by transient elastography and NKp30a isoform mRNA expression levels in HCV-infected individuals (Fig.5a). NKp30c isoform expression levels instead correlated negatively with fibrosis 4 (FIB-4) score, a non-invasive method to determine the extent of liver fibrosis27,28 in these patients (Fig.5b). Moreover, there was a positive correlation between the NKp30 isoform a/c ratio and the FIB-4 index in HCV+ patients (Fig.5c).
Figure 5.

NKp30 isoforms correlate with parameters of hepatic fibrosis in hepatitis C virus (HCV) -infected individuals. Scatter plots showing a positive correlation between NKp30a isoform mRNA expression level and liver stiffness assessed by transient elastography (a) and a negative correlation between NKp30c isoform mRNA and the fibrosis 4 score (FIB-4) score (b). (c) NKp30 isoform a/c ratio positively correlates with FIB-4 score.
Discussion
It had previously been reported that certain viral proteins, namely haemagglutinins and neuraminidases, were recognized by NCRs and involved in NK cell killing of cells infected with different viruses.4 Among these receptors, NKp30 has been shown to bind viruses and cell-derived ligands that may not even share structural similarity.4 Interestingly, NKp30 interaction with viral ligands does not always result in activation, hence representing a potential means for viruses to escape host immune responses.29 The expression of NKp30 on NK cells was significantly lower in this series of HCV-infected individuals, in agreement with most previously published studies,16,17 and emphasizing the importance of this receptor in HCV pathogenesis.8 To better understand the molecular mechanisms involved in the regulation of NKp30, we elected to draw from the experience gained by others assessing the prevalence of V-type isoforms in patients with gastrointestinal stromal tumour to trace for the first time the NKp30 isoform profile in untreated patients with chronic HCV infection. Analysis of the crude NKp30 isoform profile showed that the prevalence of profile AB, characterized by a predominant expression of the immune stimulatory NKp30a and NKp30b isoforms, and of profile C, which is associated with the immunosuppressive NKp30c isoform,10 were not significantly different in HCV-infected individuals and HD, akin to findings in a cohort of prospectively followed HIV-1-infected individuals in whom NKp30 isoforms did not seem to play a major role in the progression of HIV-1 infection and were not associated with any parameter of disease severity.12 Interestingly, the immunosuppressive isoform c mRNA was significantly decreased in PBMC from HCV-infected patients compared with HD, whereas no statistically significant differences were observed in mRNA encoding for isoforms a and b. Short-term exposure of PBMC to HCV did not alter the overall composition of NKp30 isoforms, suggesting that either HCV proteins are not ligands of NKp30 or that a prolonged exposure to viral proteins would be required to detect changes in isoform composition.
The differential expression of the three major isoforms in patients with chronic HCV infection may be explained by applying unsupervised hierarchical clustering. This approach allowed us to group patients into two clusters characterized by different NK functional features. Notably, HCV-infected individuals belonging to cluster 2, exhibiting a reduced expression of all NKp30 isoforms, were characterized by a functionally fitter NK functional profile compared with cluster 1, showing significantly reduced CD107a expression and cytokine production. Why HCV cluster 2 exhibited better NK cell function is unclear, although remarkably, the immune activating NKp30a isoform was significantly better represented in this cluster compared with patients from HCV cluster 1 or HD. Importantly, further analysis of our data by considering expression of the isoforms as a ratio, indicated that the NKp30 isoform a/c ratio was significantly higher in HCV-infected subjects compared with HD, suggesting a stronger immune stimulatory capacity in patients than in controls, whereas ratios a/b and b/c were identical to HD. Importantly, HCV-2 patients showed a significantly higher a/c ratio compared with HCV-1 patients and HD, corroborating the findings that HCV-2 patients are characterized by an immune stimulatory profile.
Interestingly, in HCV-infected individuals we found a statistically significant correlation between NKp30 isoform a mRNA level and liver stiffness, a non-invasive marker of liver fibrosis21 and an inverse correlation between isoform c and FIB-4, an indirect index of fibrosis.27 Furthermore, the a/c ratio correlated with the FIB-4 score. Although this is correlative evidence, it is tempting to postulate that a concomitant increase of the immune stimulatory a isoform and reduction of the immunosuppressive c isoform, would be associated with advanced liver disease. This is currently being evaluated in along-term prospective study.
In any case, although the present study was not prospectively designed, implicating possible variations in the relative representation of the different NCR3 gene splice variants, it is important to emphasize that previous work established that the proportion of NKp30 isoforms remains stable over time, as shown for gastrointestinal stromal tumour and HIV-1-infected patients10,12 allowing analysis of a single time-point per patient. Moreover, given the heterogeneity of HCV-infected patients, it is likely that, as in HIV-infected individuals, a greater number of prospectively followed patients may be needed to better define the clinical relevance of NKp30 isoforms in this setting. Further studies are in progress to address this point.
Acknowledgments
We thank the patients and healthy donors who served as uninfected controls, for their participation in this study. We thank G. Barosi and P. Catarsi for allowing us to use their qPCR instrument. SM designed, performed the experiments, analysed the results, drafted the figures and manuscript. DM, BO and SV participated in experiments and analysed the results. GB enrolled the patients. MUM designed the study, interpreted the data, obtained funding and edited the manuscript. This work was supported by research funds of the Italian Ministry of Health (Ricerca Corrente, Fondazione IRCCS Policlinico San Matteo), and by a grant from the Italian Ministry of Education, University and Research MiUR (Fondi di Investimento per la Ricerca di Base, Protocollo: RBAP10TPXK).
Glossary
- FIB-4
fibrosis 4 score
- HCV
hepatitis C virus
- HD
healthy donors
- IFN-γ
interferon-γ
- mAb
monoclonal antibody
- MFI
mean fluorescence intensity
- NCR
natural cytotoxicity receptors
- NK
natural killer
- PBMC
peripheral blood mononuclear cells
- qPCR
quantitative real-time PCR
- TNF-α
tumour necrosis factor-α
- HAI
histology activity index.
Disclosures
All authors have no reported conflicts.
References
- Lanier LL. Evolutionary struggles between NK cells and viruses. Nat Rev Immunol. 2008;8:259–68. doi: 10.1038/nri2276. [DOI] [PMC free article] [PubMed] [Google Scholar]
- Lanier LL. Up on the tightrope: natural killer cell activation and inhibition. Nat Immunol. 2008;9:495–502. doi: 10.1038/ni1581. [DOI] [PMC free article] [PubMed] [Google Scholar]
- Lanier LL. NK cell recognition. Annu Rev Immunol. 2005;23:225–74. doi: 10.1146/annurev.immunol.23.021704.115526. [DOI] [PubMed] [Google Scholar]
- Kruse PH, Matta J, Ugolini S, Vivier E. Natural cytotoxicity receptors and their ligands. Immunol Cell Biol. 2014;92:221–9. doi: 10.1038/icb.2013.98. [DOI] [PubMed] [Google Scholar]
- Oliviero B, Varchetta S, Paudice E, et al. Natural killer cell functional dichotomy in chronic hepatitis B and chronic hepatitis C virus infections. Gastroenterology. 2009;137:1151–60. doi: 10.1053/j.gastro.2009.05.047. [DOI] [PubMed] [Google Scholar]
- Seidel E, Glasner A, Mandelboim O. Virus-mediated inhibition of natural cytotoxicity receptor recognition. Cell Mol Life Sci. 2012;69:3911–20. doi: 10.1007/s00018-012-1001-x. [DOI] [PMC free article] [PubMed] [Google Scholar]
- Vitale M, Della Chiesa M, Carlomagno S, et al. NK-dependent DC maturation is mediated by TNFα and IFNγ released upon engagement of the NKp30 triggering receptor. Blood. 2005;106:566–71. doi: 10.1182/blood-2004-10-4035. [DOI] [PubMed] [Google Scholar]
- Marras F, Bozzano F, Ascierto ML, De Maria A. Baseline and dynamic expression of activating NK cell receptors in the control of chronic viral infections: the paradigm of HIV-1 and HCV. Front Immunol. 2014;5:305. doi: 10.3389/fimmu.2014.00305. [DOI] [PMC free article] [PubMed] [Google Scholar]
- Neville MJ, Campbell RD. A new member of the Ig superfamily and a V-ATPase G subunit are among the predicted products of novel genes close to the TNF locus in the human MHC. J Immunol. 1999;162:4745–54. [PubMed] [Google Scholar]
- Delahaye NF, Rusakiewicz S, Martins I, et al. Alternatively spliced NKp30 isoforms affect the prognosis of gastrointestinal stromal tumors. Nat Med. 2011;17:700–7. doi: 10.1038/nm.2366. [DOI] [PubMed] [Google Scholar]
- Semeraro M, Rusakiewicz S, Minard-Colin V, et al. Clinical impact of the NKp30/B7-H6 axis in high-risk neuroblastoma patients. Sci Transl Med. 2015;7:283ra55. doi: 10.1126/scitranslmed.aaa2327. [DOI] [PubMed] [Google Scholar]
- Prada N, Antoni G, Commo F, et al. Analysis of NKp30/NCR3 isoforms in untreated HIV-1-infected patients from the ANRS SEROCO cohort. Oncoimmunology. 2013;2:e23472. doi: 10.4161/onci.23472. [DOI] [PMC free article] [PubMed] [Google Scholar]
- Petta S, Craxì A. Current and future HCV therapy: do we still need other anti-HCV drugs? Liver Int. 2015;35(Suppl 1):4–10. doi: 10.1111/liv.12714. [DOI] [PubMed] [Google Scholar]
- De Maria A, Fogli M, Mazza S, et al. Increased natural cytotoxicity receptor expression and relevant IL-10 production in NK cells from chronically infected viremic HCV patients. Eur J Immunol. 2007;37:445–55. doi: 10.1002/eji.200635989. [DOI] [PubMed] [Google Scholar]
- Varchetta S, Mele D, Mantovani S, et al. Impaired intrahepatic natural killer cell cytotoxic function in chronic hepatitis C virus infection. Hepatology. 2012;56:841–9. doi: 10.1002/hep.25723. [DOI] [PubMed] [Google Scholar]
- Nattermann J, Feldmann G, Ahlenstiel G, Langhans B, Sauerbruch T, Spengler U. Surface expression and cytolytic function of natural killer cell receptors is altered in chronic hepatitis C. Gut. 2006;55:869–77. doi: 10.1136/gut.2005.076463. [DOI] [PMC free article] [PubMed] [Google Scholar]
- Bozzano F, Picciotto A, Costa P, et al. Activating NK cell receptor expression/function (NKp30, NKp46, DNAM-1) during chronic viraemic HCV infection is associated with the outcome of combined treatment. Eur J Immunol. 2011;41:2905–14. doi: 10.1002/eji.201041361. [DOI] [PubMed] [Google Scholar]
- Holder Ka, Stapleton SN, Gallant ME, Russell RS, Grant MD. Hepatitis C virus-infected cells downregulate NKp30 and inhibit ex vivo NK cell functions. J Immunol. 2013;191:3308–18. doi: 10.4049/jimmunol.1300164. [DOI] [PubMed] [Google Scholar]
- Sugden PB, Cameron B, Mina M, Lloyd AR. Protection against hepatitis C infection via NK cells in highly exposed uninfected injecting drug users. J Hepatol. 2013;61:738–45. doi: 10.1016/j.jhep.2014.05.013. [DOI] [PubMed] [Google Scholar]
- Ahlenstiel G, Edlich B, Hogdal LJ, et al. Early changes in natural killer cell function indicate virologic response to interferon therapy for hepatitis C. Gastroenterology. 2011;141:1231–9. doi: 10.1053/j.gastro.2011.06.069. [DOI] [PMC free article] [PubMed] [Google Scholar]
- Brunt EM. Grading and staging the histopathological lesions of chronic hepatitis: the Knodell histology activity index and beyond. Hepatology. 2000;31:241–6. doi: 10.1002/hep.510310136. [DOI] [PubMed] [Google Scholar]
- Livak KJ, Schmittgen TD. Analysis of relative gene expression data using real-time quantitative PCR and the 2(–ΔΔCT) Method. Methods. 2001;25:402–8. doi: 10.1006/meth.2001.1262. [DOI] [PubMed] [Google Scholar]
- Zhong J, Gastaminza P, Cheng G, et al. Robust hepatitis C virus infection in vitro. Proc Natl Acad Sci USA. 2005;102:9294–9. doi: 10.1073/pnas.0503596102. [DOI] [PMC free article] [PubMed] [Google Scholar]
- Kato T, Date T, Murayama A, Morikawa K, Akazawa D, Wakita T. Cell culture and infection system for hepatitis C virus. Nat Protoc. 2006;1:2334–9. doi: 10.1038/nprot.2006.395. [DOI] [PubMed] [Google Scholar]
- Cerino A, Boender P, La Monica N, Rosa C, Habets W, Mondelli MU. A human monoclonal antibody specific for the N terminus of the hepatitis C virus nucleocapsid protein. J Immunol. 1993;151:7005–15. [PubMed] [Google Scholar]
- Mondelli MU, Cerino A, Boender P, et al. Significance of the immune response to a major, conformational B-cell epitope on the hepatitis C virus NS3 region defined by a human monoclonal antibody. J Virol. 1994;68:4829–36. doi: 10.1128/jvi.68.8.4829-4836.1994. [DOI] [PMC free article] [PubMed] [Google Scholar]
- S terling R, Lissen E, Clumeck N, et al. Development of a simple noninvasive index to predict significant fibrosis in patients with HIV/HCV coinfection. Hepatology. 2006;43:1317–25. doi: 10.1002/hep.21178. [DOI] [PubMed] [Google Scholar]
- Vallet-Pichard A, Mallet V, Nalpas B, et al. FIB-4: an inexpensive and accurate marker of fibrosis in HCV infection. Comparison with liver biopsy and FibroTest. Hepatology. 2007;46:32–6. doi: 10.1002/hep.21669. [DOI] [PubMed] [Google Scholar]
- Jarahian M, Fiedler M, Cohnen A, et al. Modulation of NKp30- and NKp46-mediated natural killer cell responses by poxviral hemagglutinin. PLoS Pathog. 2011;7:e1002195. doi: 10.1371/journal.ppat.1002195. [DOI] [PMC free article] [PubMed] [Google Scholar]