

Background: Yeast dynein intermediate chain Pac11 contains binding regions for dynactin Nip100 and light chain Dyn2.
Results: NMR identifies a single α-helix (SAH) as the Nip100 site. New Pac11 domains are ordered by Dyn2 or Nip100.
Conclusion: In Pac11 duplexes, sequences linking binding sites contain elements of dynamic structure.
Significance: Binding to Nip100 requires the SAH domain for recognition and dynamic structural domains for regulation.
Keywords: dynein, intrinsically disordered protein, isothermal titration calorimetry (ITC), nuclear magnetic resonance (NMR), protein assembly
Abstract
Intrinsically disordered protein (IDP) duplexes composed of two IDP chains cross-linked by bivalent partner proteins form scaffolds for assembly of multiprotein complexes. The N-terminal domain of dynein intermediate chain (N-IC) is one such IDP that forms a bivalent scaffold with multiple dynein light chains including LC8, a hub protein that promotes duplex formation of diverse IDP partners. N-IC also binds a subunit of the dynein regulator, dynactin. Here we characterize interactions of a yeast ortholog of N-IC (N-Pac11) with yeast LC8 (Dyn2) or with the intermediate chain-binding subunit of yeast dynactin (Nip100). Residue level changes in Pac11 structure are monitored by NMR spectroscopy, and binding energetics are monitored by isothermal titration calorimetry (ITC). N-Pac11 is monomeric and primarily disordered except for a single α-helix (SAH) at the N terminus and a short nascent helix, LH, flanked by the two Dyn2 recognition motifs. Upon binding Dyn2, the only Pac11 residues making direct protein-protein interactions are in and immediately flanking the recognition motifs. Dyn2 binding also orders LH residues of Pac11. Upon binding Nip100, only Pac11 SAH residues make direct protein-protein interactions, but LH residues at a distant sequence position and L1 residues in an adjacent linker are also ordered. The long distance, ligand-dependent ordering of residues reveals new elements of dynamic structure within IDP linker regions.
Introduction
Cytoplasmic dynein is an essential microtubule-based motor that controls diverse cellular processes including centrosome separation and movement, mitotic spindle assembly and orientation, and axonal transport (1, 2). In higher eukaryotes, cytoplasmic dynein is a ∼1.6-MDa multisubunit protein complex that moves along microtubules using its motor domain and transports cargos associated with its cargo attachment domain. The motor domain, part of the heavy chain subunit, includes the ATPase activity that generates force to drive dynein motion. The cargo attachment domain functions in loading of cargo, maintenance of stability, and modulation of dynein activity (3). In Drosophila the primary chains that compose the cargo domain are intermediate chains (IC),2 light chains LC7, LC8, and Tctex1, and light intermediate chains.
Dynein processivity and activity require interactions with various regulatory proteins (4), including dynactin, an essential multisubunit complex (5). Dynactin mediates cargo recruitment (6) and increases dynein processivity along microtubules (7, 8). Because Saccharomyces cerevisiae dynein has structural and functional differences from Drosophila dynein, we sought in these studies to compare and contrast the consequences of dynactin and light chain binding on intermediate chain structure in the two species. In yeast, the single nonessential function of dynein is positioning the mitotic spindle into the mother/bud neck during mitosis (9). Also, the yeast cargo attachment domain has a simpler subunit composition. Although higher eukaryotes have one copy each of the three different light chains, yeast has two copies of one light chain, Dyn2, the LC8 ortholog. Disrupting Dyn2 binding impairs dynactin recruitment (10).
In Drosophila, the specific binding of dynein to dynactin involves protein-protein interactions of IC and p150Glued, a domain of the largest subunit of dynactin. A predicted coiled-coil domain of p150Glued associates with the N-terminal domain of dynein IC, also predicted to be a coiled coil (11). Specifically, p150Glued binds IC at a multiregion interface corresponding to residues 1–40 and 46–75 (12). Tctex1 and LC8 bind the disordered IC segment 110–138, which is separated from the p150Glued binding residues by a flexible linker. Because the light chains are dimeric, their binding affinity for IC is thought to be enhanced by mutual bivalency effects (10, 13).
In yeast, Nip100 is the dynactin subunit that binds yeast intermediate chain Pac11. The proximity of the binding sites for Dyn2 and Nip100 in the Pac11 sequence allows measurement of Pac11 binding to each partner individually and both partners simultaneously.
A combined analysis of high resolution NMR data, binding energetics, and gel filtration profiles delineate for the first time residue level changes in Pac11 structure and dynamics upon binding Nip100 or Dyn2, show clear differences in the energetics of light chain binding to Pac11 versus Drosophila IC, and identify within Pac11 new structural domains formed when either Dyn2 or Nip100 is bound. Although linker residues remain disordered in the Pac11 complex with Dyn2 or Nip100, they are not featureless “random coils” but rather sequences containing distinctive elements of dynamic structure.
Sequence analysis of Pac11 indicates that, contrary to commonly expressed assumptions (10, 11, 14), the N-terminal residues predicted to be coiled coils are instead a single α-helix (SAH). This conclusion is supported by the strongly helical NMR-detected secondary structure of apo Pac11 residues 1–24. Analysis of IC sequences from other species support our hypothesis that a SAH domain at or near the N terminus is a conserved structural feature among IC homologs.
Experimental Procedures
Protein Preparation
Pac11 construct containing residues 1–87 was generated by PCR and subsequently cloned into a modified pET15da (Novagen) expression vector with an N terminus His6 tag followed by a tobacco etch virus protease cutting site. Pac11 1–87Δ66–73 was cloned into the same vector by the Gibson assembly method. A Nip100 construct containing residues 214–389 (Nip100 CC1B) was generated by PCR and subsequently cloned into a pET15b (Novagen) expression vector with a C terminus His6 tag. DNA sequences were verified by automated sequencing. The recombinant vectors were transformed into Rosetta (DE3) cell lines for protein expression. Dyn2 was prepared as described elsewhere (15) but with modifications that allow the removal of the fused SUMO tag.
Cells were grown in LB medium at 37 °C to an optical density (A600) of 0.6–0.8 followed by protein induction for 3–16 h with 0.1–0.4 mm isopropyl β-d-thiogalactopyranoside. For Pac11 1–87 WT and Δ66–73, both of which form inclusion bodies under the above conditions, the cells were lysed using denaturing buffer (100 mm sodium phosphate, pH 8, 10 mm Tris, 8 m urea) followed by affinity chromatography purification on nickel-nitrilotriacetic acid resin (Qiagen) and elution in imidazole denaturing buffer (20 mm sodium phosphate, pH 8, 500 mm sodium chloride, 350 mm imidazole, 1 mm sodium azide, 6 m urea). The proteins were refolded by stepwise dilution in refolding buffer (20 mm sodium phosphate, pH 8, 500 mm sodium chloride, 1 mm sodium azide) to a urea concentration of 1 m followed by dialysis into the same buffer with 0 m urea. The His6 tag was cleaved using tobacco etch virus protease followed by purification on a SuperdexTM 75 (GE Healthcare) size exclusion chromatography column, resulting in purity of >95%. Dyn2 and Nip100 CC1B were purified under native conditions. The SUMO tag was cleaved from Dyn2 using SUMO protease (Cornell University). Nip100 CC1B was lysed in the affinity buffer containing 2 m urea to prevent aggregation and improve its interactions with nickel-nitrilotriacetic acid resin. Protein concentrations were determined from absorbances at 280 nm using molar extinction coefficient values (Pac11 1–87, 2980 m−1 cm−1; Pac11 1–87Δ66–73, 1490 m−1 cm−1; Dyn2, 12950 m−1 cm−1; Nip100 CC1B, 8940 m−1 cm−1) computed with the ProtParam tool at the ExPASy website.
Protein complex formation was assessed by analytical size exclusion chromatography (Superdex 200 10/300; GE Healthcare) at 0.2 ml/min in buffer containing 50 mm sodium phosphate, 100 mm sodium chloride, 1 mm sodium azide, pH 7.2. In each run, 100-μl protein samples were loaded at concentrations of 100 μm for Nip100 CC1B, Pac11 1–87, and Pac11 1–87Δ66–73, and of 200 μm for Dyn2. Protein (complex) markers were selected to facilitate comparison to expected complexes of similar molecular masses: markers show elution volumes for the 114-kDa complex of ICTL7-Tctex1-LC8-LC7 (16), 35 kDa for β-lactoglobulin, and 13.7 kDa for ribonuclease A. Computed molecular masses of assigned complexes were derived using the molecular masses of Pac11 1–87 monomer (10.6 kDa), Dyn2 dimer (20.8 kDa), and Nip100 CC1B dimer (42.8 kDa). Experimental molecular masses were determined using multi-angle light scattering (MALS). SDS-PAGE was used to examine protein content in the eluted fractions.
Circular Dichroism Spectroscopy
Spectra were recorded on a JASCO 720 spectropolarimeter using a 1-mm cell at a concentration of 20 μm in 10 mm sodium phosphate, pH 6, and at 25, 15, and 5 °C.
Isothermal Titration Calorimetry
ITC experiments of Pac11 with Dyn2 and Nip100 CC1B were performed using a Microcal (North Hampton, MA) VP-ITC microcalorimeter at 25 °C in buffer composed of 50 mm sodium phosphate, pH 7.2, 50 mm sodium chloride, 0.5 mm sodium azide. Experimental conditions were identical for Pac11 1–87 and for Pac11 1–87Δ66–73, in which residues 66–73 are deleted. In Dyn2 experiments, an initial 2-μl injection was followed by 26 injections of 10-μl Dyn2 samples (250–400 μm) into 15–28 μm Pac11 1–87 (see Fig. 2A) or into Pac11 1–87Δ66–73 (see Fig. 2B) in the sample cell. An initial 2-μl injection was followed by 26 injections of 10 μl of Pac11 1–87 (350–500 μm) into Nip100 CC1B (36–50 μm) in the sample cell. All experiments were accompanied by a constant stirring rate of 351 rpm. Protein samples and buffer were degassed prior to data collection. The data were processed using Origin 7.0 (Microcal) and fit to a single-site binding model. Stoichiometry was computed for number of binding sites; for example, on one Pac11 monomer, there are two Dyn2 sites, giving a stoichiometry of 1:2 for Pac11-Dyn2, and on one Pac11 monomer there is one Nip100 site, giving a stoichiometry of 1:1 for Pac11-Nip100. The recorded data are the averages of three independent experiments, with uncertainty reported as the difference between the experimental value and the average.
FIGURE 2.

Thermodynamic measurements of interactions of Pac11 1–87 and Pac11 1–87Δ66–73 with Dyn2 and with Nip100 CC1B. In each panel, representative results of ITC experiments are shown as thermograms (top panels) and binding isotherms (bottom panels) for the titrations of Pac11 1–87 with Dyn2 (A), Pac11 1–87Δ66–73 with Dyn2 (B), Nip100 CC1B with Pac11 1–87 (C), and Nip100 CC1B with Pac11 1–87Δ66–73 (D). The data were collected at 25 °C in 50 mm sodium phosphate, 50 mm sodium chloride, 0.5 mm sodium azide, pH 7.2, and fit to a single-site binding model. The weak binding of Nip100 CC1B with Pac11 1–87Δ66–73 cannot be reliably fit at these concentrations.
NMR Experiments
Doubly labeled 15N/13C- and 15N-labeled proteins were prepared in buffer composed of 10 mm sodium phosphate at pH 6.0 with 50 mm sodium chloride, 10 mm Arg+, 10 mm Glu−, 1 mm sodium azide, 8% 2H2O, a protease inhibitor mixture (Roche Applied Science), and 2,2-dimethylsilapentane-5-sulfonic acid for 1H chemical shifts referencing. For backbone assignments, NMR spectra of Pac11 1–87 were obtained at 15 °C and a concentration of 300 μm. The dynamics data of 15N-labeled Pac11 1–87 were collected for the apo, for Pac11-Dyn2 complex at a molar ratio (Pac11: Dyn2) of 1:2.2, and for Pac11-Nip100 CC1B complex at a molar ratio (Pac11: Nip100 CC1B) of 1:1.2. Native PAGE and 1H-15N HSQC spectra were used to assay sample integrity before and after every NMR data collection. All reported data are from HSQC spectra that remain unchanged during data collection.
Backbone resonance assignments for apo Pac11 1–87 were determined from a set of [15N,1H]TROSY-based (17) triple-resonance HNCACB and HN(CA)CO experiments featuring BEST (band selective excitation short transient) methodology (18) to reduce measurement times. A TROSY-type HAHBHN(CACO)NH (19) experiment was collected to determine proton assignments. These experiments were carried out with a cryo-probe on a Bruker Avance 900-MHz spectrometer, whereas the remaining experiments (HN(CO)CACB, HNCO) employed a room temperature xyz gradient probe on a Bruker Avance 500-MHz spectrometer. Backbone resonance assignments for Dyn2-bound Pac11 1–87 (Pac11:Dyn2 at a molar ratio of 1:2.2) were determined using a similar HN(CO)CACB experiment collected on a Bruker Avance 600-MHz spectrometer.
Longitudinal (T1) and transverse (T2) 15N relaxation times were determined at 600-MHz 1H frequency using standard HSQC-based pulse sequences (20) at 15 °C. For each series, spectra with ten different relaxation periods (three in duplicate for error estimation) were recorded in an interleaved manner. Their duration varied from 10 ms to 1.3 s in T1 measurements, from 23.2 ms to 371.2 ms in T2 measurements of the free Pac11 1–87, and from 20 ms to 200 ms in T2 measurements of the complex with Dyn2 or Nip100. Steady-state 15N-{1H} NOE values resulted from application of TROSY-based pulse sequences (21) using a total recovery delay of 8 s. A train of 180° 1H pulses spaced by 22 ms was applied to protons for 6 s in the saturation experiment.
NMR titrations of 15N-labeled Pac11 with unlabeled Dyn2 and Nip100 CC1B were acquired on a Bruker Avance 700 MHz spectrometer at 25 °C. A series of BEST HSQC spectra of 15N-labeled Pac11 1–87 were collected with Dyn2 at final molar ratios (Pac11: Dyn2) of 1:0.1, 1:0.3, 1:0.5, 1:0.7, 1:1.3, and 1:2.2 and with Nip100 CC1B at final molar ratios (Pac11: Nip100 CC1B) of 1:0.1, 1:0.3, 1:0.5, 1:0.7, and 1:1.2. Titration experiments with Nip100 CC1B were performed at pH 7.0. The spectra of fully bound Pac11-Dyn2 (molar ratio of Pac11:Dyn2 = 1:2.2) and Pac11-Nip100 (molar ratio of Pac11:Nip100 = 1:1.2) were also collected on a Bruker Avance 900 MHz spectrometer.
NMR Data Analysis
All spectra were processed with TopSpin (Bruker) and analyzed using Sparky (22) and NMRView (23). Cα and Cβ chemical shifts were used to determine the secondary structure by calculating the difference from the random coil values at specified temperature and pH (24). For Pac11-Dyn2 interactions, per-residue absolute chemical shift change was calculated using both 15N and 1H chemical shift changes in spectra of free Pac11 and Dyn2-bound Pac11 collected at 900 MHz. A scaling factor of 0.17 was used on 15N chemical shift to eliminate the differences in the 15N and 1H chemical shift ranges. For titration and dynamics experiments, peak intensities were measured as peak heights. To account for differences in concentration across the titration series, a normalization factor was determined from the signal to noise ratio of residue 1 in Pac11-Dyn2 titration or residue 87 in Pac11-Nip100 titration. Changes in peak intensities IBound/IFree were calculated as the ratios of signal intensity in spectra of the complex and free Pac11. T1, T2, and steady-state NOE values were determined as described previously (12, 25).
Chemical Shift-based Structures
An ensemble of structures for apo Pac11 1–87 was generated using the program CS-Rosetta (26) and chemical shift assignments for the 1Hα, 1HN, 13Cα, 13Cβ, 13C′, and 15N atoms. The CS-Rosetta calculations were carried out on the server at the Biological Magnetic Resonance Bank using the chemical shifts data. The average root mean square deviation for the 10 structural models that have the lowest energy structures is 16.2 Å. This large deviation is due to the expected differences in the disordered regions. All 10 structures have similar N-terminal α-helix spanning residues 1–24 with relatively lower average root mean square deviation of 2.3 Å.
Sequence Analysis
Domain boundaries of Pac11 were determined using NCBI BLAST. Coiled-coil domains were predicted by the Coils program (27), and secondary structure was predicted by Psipred v3.3 (28).
Results
Construct Design and Characterization
The S. cerevisiae dynein intermediate chain Pac11 1–87 construct includes the sequence-predicted coiled-coil domain (1–24), as well as two Dyn2 recognition motifs, QT1 (45–54) and QT2 (75–84) (Fig. 1, A and D). Pac11 1–87Δ66–73 includes the same domains and is used to determine the effect of the 66–73 deletion on Dyn2 and Nip100 binding affinities. The Nip100 214–389, Nip100 CC1B, contains the coiled-coil domain identified in mammalian homolog p150Glued as sufficient to bind dynein intermediate chain (11). Pac11 1–87 is primarily disordered with a small percentage of CD-detected helical structure indicated by negative ellipticity at 222 nm (Fig. 1B) and is monomeric with a MALS-determined molecular mass of 12.3 kDa (calculated MW is 10.6 kDa). Nip100 CC1B and Dyn2 are stable dimers as determined by MALS.
FIGURE 1.

Sequence and solution analyses of apo Pac11 1–87. A, binding site organization of IC (from Drosophila melanogaster) and Pac11 (IC ortholog from yeast) showing predicted N-terminal SAH, and C-terminal WD repeat (WD40) domains. Pac11 has two Dyn2 binding sites, whereas Drosophila IC has binding sites for three different light chains: Tctex1, LC8, and LC7. The N-terminal SAH domain identified in these studies replaces the coiled-coil designation commonly assumed from sequence-based structure prediction. Constructs used in this work: Pac11 1–87 and Pac11 1–87Δ66–73 are also shown. B, far UV CD spectrum of Pac11 1–87 recorded at 25 °C; negative ellipticity at 222 nm indicates partial helical structure. C, [15N,1H]TROSY HSQC spectrum of Pac11 1–87 showing backbone assignments. The spectrum was acquired at 15 °C on a 900-MHz Bruker Avance NMR spectrometer. D, the secondary structure of apo Pac11 1–87 determined from the Cα and Cβ 13C chemical shifts in the bar graph is diagramed above the graph as a stable helix 1–24 (black) and a nascent helix 66–73 (white). The top diagram gives the algorithm-predicted secondary structure of the same sequence. Below the bar graph, a domain diagram of Pac11 1–87 gives the sequence of the two Dyn2 binding sites QT1 and QT2. The sequence of the N-terminal 24 residues fits the definition of a SAH as described in the text. Underlined are all possible Lys-Glu interactions, and gray filled circles indicate all possible Arg-Glu interactions.
Resonance Assignments and Secondary Structure of Pac11 1–87
The 15N-1H HSQC spectrum of apo Pac11 1–87 (Fig. 1C) exhibits a limited range of amide proton chemical shifts (7.90–8.85 ppm), indicating a predominantly disordered protein. Backbone assignments were determined for 82 of 84 non-proline residues. Secondary chemical shifts indicate high helix propensity for residues 1–24 and lower helix propensity for residues 66–73 (Fig. 1D). These propensities match the sequence-based algorithmic predictions of helix (28) for apo Pac11, except the NMR-detected 66–73 helix is slightly longer and considerably weaker than the predicted 65–69 helix (Fig. 1D, top panel).
Although N-terminal residues of Pac11 1–87 are predicted to form a coiled coil, they lack the hydrophobic seam found in coiled coils. Instead, the 1–24 segment is rich in highly charged residues (65.2% Arg, Lys, and Glu) (Fig. 1D), suggesting helix-stabilizing electrostatic interactions between residues i and i + 4 (e.g. Lys5–Glu9 and Lys15–Glu19) and i and i + 3 (e.g. Glu8–Arg11), characteristic of a single α-helix (SAH) domain (29). Hereafter, we refer to helix 1–24 as SAH and nascent helix 66–73 as LH (for linker helix). The linker region (helix 25–44) between SAH and QT1 is L1, and the linker region (helix 58–65) between QT1 and LH is L2.
Pac11-Dyn2 and Pac11-Nip100 CC1B Interactions
Pac11 1–87 binds dimeric Dyn2 with a stoichiometry of 1:2 (n value of 2) and an apparent Kd value of 0.04 μm (Fig. 2A and Table 1). Because the stoichiometry is computed for binding sites, 1:2 means two Pac11 monomers bind two Dyn2 dimers. In comparison, Dyn2 binding to a Pac11 peptide containing only one Dyn2 binding motif (QT2) has a Kd value of 0.62 μm and a stoichiometry of 1:1 (30). Deletion of LH residues 66–73 in Pac11 does not significantly affect Dyn2 binding affinity (Table 1).
TABLE 1.
Thermodynamic parameters for association of Pac11 1–87 and Pac11 1–87Δ66–73 with Dyn2 and Nip100 CC1B
| Protein | Ligand | n | Kd | Δbi]G0 | ΔH0 | −TΔS |
|---|---|---|---|---|---|---|
| μm | kcal/mol | |||||
| Pac11a | Dyn2 | 2.0 ± 0.1 | 0.04 ± 0.01 | −10.1 ± 0.1 | −7.2 ± 0.6 | −2.9 ± 0.7 |
| Pac11Δ66–73a | Dyn2 | 1.8 ± 0.2 | 0.04 ± 0.01 | −10.1 ± 0.1 | −6.8 ± 0.2 | −3.3 ± 0.04 |
| Nip100b | Pac11 | 0.97 ± 0.005 | 5.6 ± 0.07 | −7.1 ± 0.02 | −8.0 ± 0.5 | 0.8 ± 0.5 |
a The data are the averages of duplicate ITC runs. Pac11 denotes Pac11 1–87.
b The data are the averages of duplicate ITC runs. Nip100 denotes Nip100 CC1B.
Pac11 binding affinity for Nip100 is much lower than for Dyn2. The Pac11-Nip100 CC1B interaction measured by ITC has a stoichiometry of 1:1 (n value of 1; two Pac11 monomers bind one Nip100 dimer) and an apparent Kd value of 5.6 μm (Fig. 2C and Table 1). The absence of LH in Pac11 1–87Δ66–73 significantly reduces Nip100 binding affinity (Fig. 2, C and D).
NMR Studies of Dyn2 Binding to Pac11
In NMR spectra of 15N-labeled Pac11 1–87, taken before and after addition of unlabeled Dyn2 at varying molar ratios, two titration effects are readily apparent for peaks in the amide NH spectral region (Fig. 3A); some NH peaks are attenuated, but their lost intensity is observed in a new peak at a different chemical shift, whereas other NH peaks lose intensity that is not detected elsewhere in the spectrum. Resonance assignments of all peaks were determined using standard three-dimensional experiments. Secondary chemical shifts of observable peaks in the spectrum of Dyn2-bound Pac11 (Fig. 3B, red) are the same as for apo Pac11 (Fig. 3B, black), indicating that, for residues that can be detected in Dyn2-bound Pac11, there is no change in secondary structures compared with apo Pac11 (e.g. SAH peaks 1–24).
FIGURE 3.

NMR titrations of Pac11 1–87 with Dyn2. A, superposition of 900-MHz [15N,1H]TROSY HSQC spectra collected at 15 °C of Pac11 1–87 in the apo form (black) and with Dyn2 added at a Pac11:Dyn2 molar ratio of 1:2.2 (red). With Dyn2, some peaks disappear (black labels), and some peaks shift (green labels with green arrows between black and red peaks for the same NH in apo and Dyn2-bound forms). Inset, enlargement of the region enclosed by dotted lines. B, secondary chemical shifts of observable peaks in spectra of Dyn2-bound Pac11 1–87 (Pac11:Dyn2 molar ratio 1:2.2) (red) compared with those of free Pac11 1–87 (black of Fig. 1D). C, bar graph of residue number versus chemical shift change (Δppm) of the same NH peak in spectra of Pac11 without and with Dyn2 (ratio 1:2.2). D, changes in relative intensity of Pac11 1–87 NH peaks upon addition of Dyn2 in HSQC spectra collected at 700 MHz at 25 °C are shown as a bar graph of residue number versus relative peak intensity (Ibound/Ifree). Ibound is the peak intensity for samples at the indicated Pac11:Dyn2 ratio, except for residues 58–67, for which Ibound is the combined intensity of both peaks for the same NH. Ifree is the peak intensity of the same NH in spectra of apo Pac11 with no added Dyn2. Pac11:Dyn2 ratios are 1:0.5 (purple), 1:0.7 (gray), 1:1.0 (yellow), and 1:2.2 (red). Peaks with intensities near the noise level were not included in the final titration (molar ratio 1:2.2). E, various sequence regions of Pac11 1–87 are differently affected by Dyn2 binding (ratio 1:2.2). Some regions behave uniformly; their peaks either disappear (black boxes; QT1, QT2, and LH residues), undergo significant chemical shift changes (green box; L2 residues), or retain full intensity with no chemical shift change (red, no box). LH residues (dark gray cylinder) form a helix that is more stable in the Dyn2-bound form.
The first titration effect is illustrated in Fig. 3A, which overlays HSQC spectra of Pac11 1–87 without Dyn2 (black) and with a Pac11:Dyn2 molar ratio of 1:2.2 (red). With Dyn2, peaks of Pac11 residues 58–67 in linker region L2 are observed at a new chemical shift as shown in Fig. 3C, where chemical shift changes are quantified. Although the 58–67 chemical shifts change with added Dyn2, the combined intensity of the two peaks for each NH does not change. A second NH peak at a different chemical shift, with no loss in combined intensity, indicates slow exchange between apo and Dyn2-bound ensembles in which L2 residues experience different local environments and hence different average chemical shifts. For both apo and Dyn2-bound Pac11, L2 peaks are sharp and within the spectral region considered random coil. We conclude that, in Dyn2-bound Pac11, the L2 domain is an ensemble of conformations that still retain a high degree of local flexibility but are, on average, slightly more ordered than in apo Pac11, as evidenced from the small increase in steady-state NOEs (see Fig. 6).
FIGURE 6.

Dynamics of apo Pac11, Pac11-Dyn2, and Pac11-Nip100. Longitudinal 15N relaxation (T1), transverse relaxation (T2), and steady-state heteronuclear NOE values Isat/Iunsat) are plotted in A–C for apo Pac11 1–87, in D–F for Dyn2-bound Pac11 1–87, Pac11:Dyn2 molar ratio of 1:2.2, and in G–I for Nip100-bound Pac11 1–87, Pac11:Nip100 molar ratio of 1:1.2. A dashed line is shown in each plot to facilitate visual comparison. Dynamics parameters of residues for which peaks disappear in bound forms are left blank in the bar graphs. The models (top panels) depict Pac11 1–87 without and with bound ligand, based on data in Figs. 3 and 4; apo Pac11 1–87 is primarily disordered (dotted lines) with secondary structure the same as Fig. 1D; ligand-bound Pac11 1–87 models show secondary structures when Dyn2 (top middle panel, SAH domain as a black cylinder, QT1 and QT2 as arrows, and LH as a dark gray cylinder) and Nip100 (top right panel, SAH domain as black cylinder and LH as a light gray cylinder) are bound. The dark gray LH in Dyn2-bound Pac11 contains residues that lose intensity, whereas the light gray LH in Nip100-bound Pac11 contains residues for which intensity loss is field strength-dependent. The effect of Dyn2 binding on Pac11 is the same for data collected at 700- and 900-MHz spectrometers. Solid lines correspond to residues that become more ordered in the complex, whereas dotted lines correspond to residues that remain disordered.
The second titration effect, attenuation of peak intensity as Dyn2 is added, is quantified in Fig. 3D, where bar heights indicate normalized peak intensity, and bar colors code the Pac11:Dyn2 ratio. Peak intensity that is first diminished and then completely lost as Dyn2 concentration is increased is observed for residues 44–57 and 68–87, two segments that encompass residues in or immediately flanking binding motifs QT1 and QT2 and LH (Fig. 3, D and E).
The titration of peak intensity as apo Pac11 is converted to the Pac11-Dyn2 complex is explained by one or both of two scenarios. In the first, these residues interact with a large, collapsed domain and so tumble with that domain; the consequent increase in their rotational correlation time and the associated decrease in NMR relaxation time render their peaks undetectable. A second possible explanation for the total loss of peak intensity at saturating Dyn2 concentration is intermediate exchange between two or more conformational ensembles of Dyn2-bound Pac11 forms. The QT1 and QT2 domains best fit the first explanation as their motifs are incorporated into the three-dimensional fold of the Dyn2 dimer (20) with which they would tumble. Although LH peaks disappear in a manner similar to residues in the QT domains, their tight integration into the nearby QT2 is not consistent with their NMR spectral behavior when Nip100 is added to apo Pac11 (Fig. 4) discussed below, nor with the unchanged binding energetics of Dyn2 to Pac11 versus Pac11Δ66–73 (Table 1).
FIGURE 4.

NMR titrations of Pac11 1–87 with Nip100 CC1B. A, superposition of 900 MHz [15N,1H]TROSY HSQC spectra collected at 15 °C of Pac11 1–87 in the apo form (black) and with added Nip100 CC1B at a Pac11:Nip100 ratio of 1:1.2 (red). B, changes in relative intensity of Pac11 1–87 NH peaks upon addition of Nip100 CC1B in HSQC spectra collected at 700 MHz at 25 °C are shown as a bar graph of residue number versus relative peak intensity (Ibound/Ifree). Pac11:Nip100 molar ratios are 1:0.1 (purple), 1:0.3 (gray), 1:0.5 (yellow), and 1:1.2 (red). Peak intensities near the noise level are not included for spectra at the highest molar ratio (1:1.2). C and D, peak heights for residues in free Pac11 1–87 (black) and Nip100-bound Pac11 (red, Pac11 1–87: Nip100 CC1B molar ratio of 1:1.2) in spectra collected at 700 and 900 MHz. E, regions of Pac11 1–87 sequence affected by Nip100 CC1B binding (ratio 1:1.2). Color coding is similar to Fig. 3E. LH residues are shown in purple to indicate higher helical preference (deduced from peak attenuation) than in apo Pac11.
NMR Studies of Nip100 CC1B Binding to Pac11
NMR spectra of 15N-labeled Pac11 1–87, taken before and after addition of unlabeled Nip100 CC1B (Fig. 4), identify large segments of contiguous Pac11 residues for which NH peaks are attenuated as Nip100 is added. Comparing the results of titration experiments in Figs. 3D and 4B, it is striking that the overall patterns of titrated peak intensity show a rough reciprocity; in one graph the two segments of tall red bars (relative peak intensity unchanged at highest ligand concentration) tend to be in regions that in the other graph have no red bars (all intensity lost at highest ligand concentration). Peaks that markedly decrease in intensity with added Nip100 are those of N-terminal residues 2–46 and residues 63–73.
Peak attenuation caused by direct interactions (line broadening associated with slower tumbling time) versus attenuation caused by conformational exchange (line broadening caused by intermediate exchange) may be distinguished by comparing Pac11 spectra of free versus Nip100-bound samples collected at 700 MHz (Fig. 4C) and at 900 MHz (Fig. 4D). Broadening caused by conformational exchange is sensitive to field strength. At higher field there is an increased Δω, the difference in Hz between two exchange peaks, but no change in kex, the molecular exchange rate between conformations. At 700 MHz, a conformational exchange rate on the order of Δω would cause line broadening of an NH peak. At 900 MHz, the same conformational exchange rate may be smaller than Δω, and by definition in the slow exchange regime, with the result that 900 MHz spectra have less broadened peaks for the same NH.
The data in Fig. 4 (B–D), taken together, differentiate three structural ensembles affected by Nip100 binding: SAH, 2–24, L1, 25–46, and LH, 63–73. In Fig. 4B, SAH peak intensities have a distinctive attenuation pattern: a fairly uniform and greater loss of intensity at substoichoimetric Nip100 concentrations (e.g. gray and yellow bars are <50%). L1 peaks differ in having relatively nonuniform and higher intensity at the same Nip100 concentrations, consistent with SAH being the Pac11 region that interacts directly with Nip100. Further, the intensities of SAH and L1 residues in apo Pac11 spectra have different field strength dependences (black bars in Fig. 4, C and D); the intensities of L1 peaks relative to SAH peaks are lower at 700 MHz as compared with 900 MHz. This implies that SAH and L1 residues form different ensembles, each having distinctive conformational dynamics, consistent with the conclusion that in apo Pac11, only residues 2–24 form a single α-helix.
The dynamic ensemble structure of LH is clearly distinguishable from both SAH and L1. The significantly higher intensities of LH peaks observed in 900 MHz spectra of Nip100-bound Pac11 (residues 63–73; red bars in Fig. 4, C and D) imply slow exchange at the higher field, between LH conformations separated by a significant energy barrier. Although peaks 63–73 in 700-MHz spectra are apparently exchange-broadened, in 900-MHz spectra they are sharpened and more intense because of a shift from an intermediate to a slow exchange regime, with a possible contribution from increased sensitivity.
Effect of Dyn2 on Nip100 Binding to Pac11
Gel filtration elution profiles (Fig. 5A) indicate that the presence of Dyn2 increases the stability of the Pac11 1–87-Nip100 CC1B complex. When a sample of Pac11 1–87 and Nip100 CC1B at equimolar concentrations (two Pac11 monomers to one Nip100 dimer) was loaded on an analytical column, the two elution peaks (Fig. 5A, red) correspond to Nip100 CC1B dimer (42.8 kDa) and to Pac11 1–87 monomer (10.6 kDa), which migrates earlier than expected for a globular protein of similar size. The absence of detectable Pac11-Nip100 complex is consistent with their low binding affinity given in Table 1.
FIGURE 5.
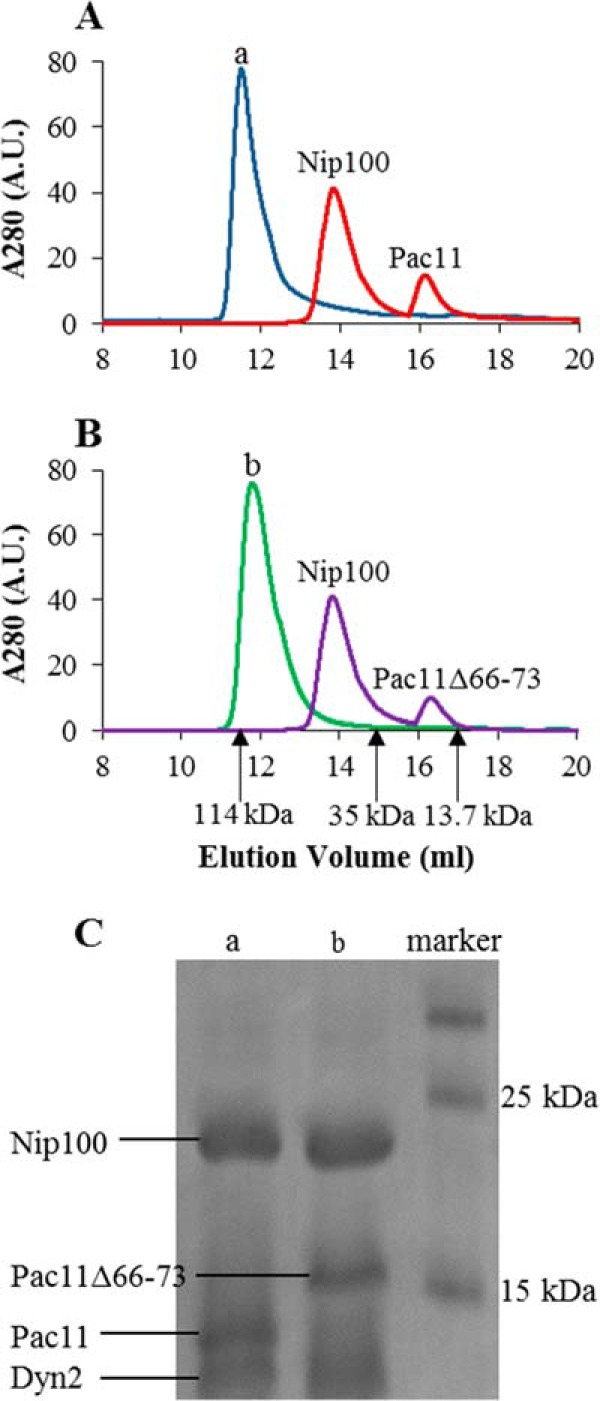
Elution profiles of Pac11 1–87 and Pac11 1–87Δ66–73 in ternary complexes with Nip100 and Dyn2. A, elution profiles of Nip100 CC1B and Pac11 1–87, with and without Dyn2, are shown with a void volume of 8 ml. Samples containing Nip100 and Pac11 1–87 elute as two peaks (red). With added Dyn2, the complex elutes as a single peak (blue). B, elution profiles of Nip100 CC1B and Pac11 1–87Δ66–73, with and without Dyn2, on the same column. Samples containing Nip100 and Pac11 1–87Δ66–73 elute as two peaks (purple). With added Dyn2, the same sample elutes as a single peak (green) for the ternary complex. Arrows indicate elution volumes of molecular mass markers: the 114-kDa complex of ICTL7-Tctex1-LC8-LC7 (chosen because it forms a dynamic IDP complex) (16), 35-kDa β-lactoglobulin, and 13.7-kDa ribonuclease A. C, SDS-PAGE of fractions from elution peaks (lanes a and b) demonstrate the components of the ternary complexes.
When a sample of a complex of Pac11 1–87, Nip100 CC1B and Dyn2, at a molar ratio of 1:1:2 was loaded, the major feature of the elution profile (Fig. 5A, blue) is a single intense peak with a MALS-determined molecular mass of 127 kDa, consistent with a Pac11-Dyn2-Nip100 ternary complex, which has an expected molecular mass of 110 kDa (two chains of Pac11 1–87, two Dyn2 dimers, and one Nip100 CC1B dimer). The ternary complex is confirmed in lane a of the SDS-PAGE results in Fig. 5C.
Similar elution profiles are obtained for Pac11 1–87Δ66–73, a Pac11 variant lacking LH residues (Fig. 5B). Whether with Nip100 alone or with both Nip100 and Dyn2, no difference in elution volume of the resultant complexes is observed. The ternary complex with Pac11 1–87Δ66–73 in the high molecular mass peak is confirmed in lane b of Fig. 5C. Apparently LH residues do not contribute to the relative stability of Pac11-Nip100 versus Pac11-Nip100-Dyn2.
NMR-detected Dynamics of Pac11 1–87
Backbone dynamics of Pac11 1–87 were determined from 15N T1, T2, and steady-state heteronuclear NOE experiments (Fig. 6). The T1 values are fairly uniform throughout the sequence with an overall average of 0.64 s (Fig. 6A). The T2 values, in contrast, show highly heterogeneous dynamics. The heterogeneity in T2 relaxation with residues in the SAH and LH domains evincing low T2 values (average T2 value of 0.11 and 0.21 s, respectively) compared with the overall average value of 0.25 s is indicative of nonrandom structure for these segments (Fig. 6B). Steady-state heteronuclear NOE measurements, which provide indications of ordered structure on the nanosecond to picosecond time scale, suggest order in residues 1–24 and to a lesser extent in residues 65–81, segments that have positive NOE values with averages of 0.45 and 0.17, respectively (Fig. 6C). The rest of the sequence is primarily disordered with residues exhibiting near 0 or negative NOE values.
To examine the effect of Dyn2 binding, similar dynamics experiments were carried out for the Pac11-Dyn2 complex. Because peaks for residues 44–57 and 68–87 disappear in spectra of the bound form, comparison of the dynamics was assessed only for the remaining detectable peaks. Except for a more pronounced dip around residue 31 in T1 and a significant drop in T2 for the same region, indicating increase in ordered structure, the T1 and T2 values (Fig. 6, D and E) are similar on average to those of the free protein. NOE values (Fig. 6F) indicate a small gain in ordered structure for some regions: for residues around 41, NOE values change from negative to near 0, and for residues 58–67 NOE values increase from 0.08 to 0.16. In sum, dynamics measurements indicate no change for residues within the SAH domain and a small increase in ordered structure in L1 and L2.
For the Pac11-Nip100 CC1B complex, although many peaks disappear, relaxation parameters for the remaining peaks are essentially the same as for free Pac11. Interesting to note are the more negative NOE values and slightly higher T2 values for residues in L2 and at the C-terminal end distant from binding, suggesting increased flexibility in this region upon Nip100 binding. Increased flexibility on both sides of LH makes the peak attenuation observed in LH even more striking.
Discussion
High resolution methods for monitoring structural changes of large, partially disordered, flexible, macromolecular assemblies are few. Our approach—production of appropriate model polypeptides amenable to NMR spectroscopy and titration calorimetry and further development of NMR ligand titration techniques (12, 15, 25, 31, 32)—has been extremely useful in characterization of dynein intermediate chain complexes and is generally applicable to characterization of other large dynamic complexes.
The N-terminal 87-residue segment of Pac11, containing two Dyn2 recognition motifs (QT1 and QT2) and the binding site for Nip100, is primarily monomeric and disordered except for a SAH (residues 1–24) and a short nascent helix (LH, residues 66–73) in the 20-amino acid segment separating the Dyn2 recognition motifs. Recognition sites and changes in structure upon binding to either Dyn2 or to Nip100 are inferred from NMR titration results (Figs. 3 and 4), based on peak attenuation patterns and/or changes in chemical shift with added Dyn2 or Nip100 and on the field strength dependence of peak attenuation. Increased ordered structure in Pac11 complexes is monitored at the residue level by comparison of 15N relaxation data for apo Pac11 and for Pac11-Dyn2 and Pac11-Nip100 complexes.
An N-terminal SAH Domain Is a Conserved Structural Feature of Dynein Intermediate Chain Responsible for Binding Dynactin
Three models of apo Pac11 1–87 corresponding to the lowest energy structures are presented as an overlay in Fig. 7A. The ordered SAH domain aligns well in all three conformations (long red ribbon); in one conformation LH is a short segment exhibiting some helical propensity (short red ribbon); in the rest of the chain, all three conformations have considerable disorder. Dynamics measurements (Fig. 6), in particular the significantly lower T2 values for residues 1–24, support the conclusion that this segment is an ordered SAH domain of the type first identified in murine myosin 10 (33), where it serves as a stiff, processive extension of the myosin lever (34).
FIGURE 7.
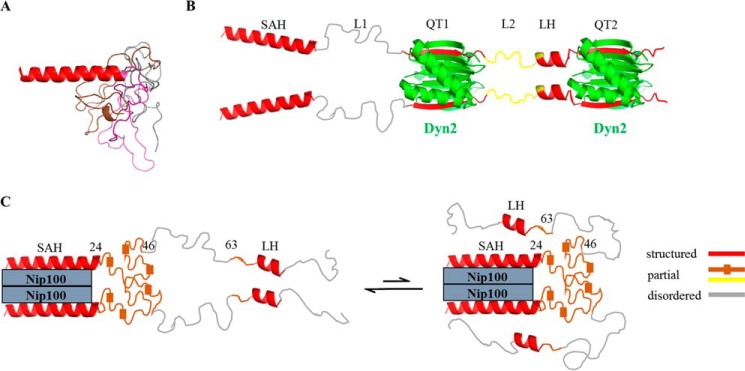
Structural models of apo Pac11 1–87, Pac11-Dyn2, and Pac11-Nip100. A, apo Pac11 1–87 is shown as an overlay of three CS Rosetta-based models. In each low energy structure, SAH residues 1–24 (red) form a single α-helix (long red ribbon on left), and, as they are aligned in this view, only one ribbon is apparent; for the rest of the sequence (25–87), all three backbone conformations are shown (gray, brown, and pink) including one corresponding to LH residues 66–73. B, Pac11 1–87 in a complex with two Dyn2 dimers. Domains SAH (1–24), L1 (25–43), QT1 (44–57), L2 (58–67), LH (68–73), and QT2 (75–87) are labeled. The Pac11-Dyn2 structures at QT1 and QT2 are from the crystal structure (Protein Data Bank, entry 4HT6), with Dyn2 dimers in green, and bound Pac11 β-sheet strands in red. Dyn2 binding aligns the two Pac11 chains, highly orders most of LH (red ribbon), and partially orders residues L2 (yellow backbone). C, Pac11 1–87 in a complex with Nip100 CC1B. Nip100 directly binds the SAH domain and orders L1 residues 25–46 (brown with small boxes to indicate local ordered structure), as well as LH residues 63–73 (red ribbon), whereas the rest of the chain remains disordered (gray). The partially disordered brown region in C contains residues that lose intensity, whereas the partially disordered yellow region in B contains residues that undergo chemical shift changes. An alternative model consistent with the NMR peak attenuation data is shown on the right, with the LH domain making tertiary contacts with either the SAH or Nip100. All structures were generated using PyMOL (48).
Several characteristics of Pac11 and IC in higher eukaryotes support the generalization that an N-terminal SAH domain is a conserved feature of dynein intermediate chain. The domain architecture is similar for apo forms of S. cerevisiae Pac11 and Drosophila IC, as illustrated in Fig. 1A. At the N terminus, each has a sequence predicted by standard algorithms to be coiled coil. However, as noted here for IC and Pac11 and in Ref. 33 for murine myosin, the predicted coiled-coil sequence lacks coiled coil-stabilizing hydrophobic residues and has residues characteristic of a SAH domain conducive to helix-stabilizing electrostatic interactions. Similar to Pac11, in its first 40 residues Drosophila IC favors α-helical structure with restricted motions detected by NMR dynamics experiments (12). Significantly, the yeast Pac11 N-terminal SAH domain binds dynactin (via Nip100) as demonstrated here, and Drosophila and mammalian IC N-terminal SAH domains bind dynactin (via p150Glued) (11, 12). An elongated SAH may favor binding of this relatively short sequence to the coiled-coil domain of Nip100 or p150Glued. In summary, although the N-terminal 40–50-amino acid segment in IC of higher eukaryotes is commonly assumed to be a coiled coil based on prediction algorithms, we conclude instead that they form a single α-helix to which a subunit of dynactin binds.
Dyn2 Binding Orders LH Residues as Well as QT1 and QT2 Domains
The aligned IDP duplex formed by two Pac11 1–87 chains and two Dyn2 dimers is illustrated in Fig. 7B. Incorporation of Pac11 QT recognition motifs into Dyn2 β-sheets is evident in an x-ray structure for Dyn2 bound to a short peptide corresponding to QT2 (30), other LC8 partner peptide structures with similar motifs (35, 36), and the NMR titration results in Fig. 3D. A complete loss of peak intensity of residues in and around QT1 and QT2 sequences 44–54 and 75–84 indicates the expected effect of protein-protein interactions at the Pac11-Dyn2 interfaces (Fig. 3D).
However, along with residues in and near QT1 and QT2, also attenuated are residues 68–73 within LH, which in apo Pac11 forms a nascent helix 66–73 (Fig. 3E). Although LH residues lose all peak intensity in the complex (Fig. 3D), they are likely not incorporated into the well packed QT2 interface of Pac11-Dyn2 because deletion of LH affects neither Dyn2 binding affinity (Table 1) nor Dyn2 stabilization of the Pac11-Nip100-Dyn2 ternary complex (Fig. 5). An explanation for LH peak attenuation is that ordering of LH helices accompanies Dyn2 binding. LH residues in the Pac11-Dyn2 complex, shown in Fig. 7B as separate red ribbons, may tend to self-associate. Such interchain self-association of LH sequences between QT recognition motifs is reminiscent of the Ana2 (the anastral spindle-2 centriole duplication factor) system involving two LC8 recognition motifs flanking a 34-amino acid predicted helix. The self-association of this helix was proposed to be involved in formation of four-helix bundle resulting in higher order oligomerization of Ana2 (37). Similarly for Pac11, it is possible that binding of two Dyn2 at two somewhat separated motifs promotes formation of ordered self-associated helices as a new surface for binding other partners.
Dyn2 binding has no effect on the structure and dynamics of the distant SAH domain, which comprises the Nip100 site. This observation implies that the increased binding of Pac11 to Nip100 upon Dyn2 binding (Fig. 5) is due solely to bivalency.
Nip100 Binding to Pac11 SAH Domain Orders Adjacent L1 and Distal LH Residues
Dimeric Nip100 CC1B binds two chains of Pac11 1–87 (Table 1) as illustrated in Fig. 7C. Although NH peaks of SAH (2–24), L1 (25–46), and LH (63–73) are all diminished with added Nip100, their attenuation patterns and field strength dependence imply that these three regions form local dynamic conformational ensembles having different responses to Nip100 binding. The rest of the Pac11 backbone remains highly disordered in the complex.
We conclude that direct interactions of Nip100 coiled-coil domain with Pac11 are localized to residues in the SAH. Attenuation of NH peaks of proximal L1 and of the more distant LH is primarily due to self-organization of these segments into domains that are somewhat more ordered but still flexible. A dynamic L1 domain is visualized in Fig. 7C as brown backbone chains that are somewhat collapsed. A dynamic LH domain is visualized as favoring helical conformations, possibly self-associated helices. Residues within these domains could transiently interact with Nip100 or pack against the SAH domain (Fig. 7C, right panel), consistent with diminished binding of Nip100 to a Pac11 variant having LH residues deleted (Fig. 2D).
The salient outcome of these conclusions is that Pac11 contains domains that form elements of local dynamic structure, which respond differently to ligand binding and duplex formation. Functional implications include new conformations that may selectively bind additional ligands that are not necessarily bivalent. Such species could arise from an ensemble shift in conformational populations associated with complex formation. For example, dynein assembly of intermediate chains and light chains transiently bind other partners, such as ZW10 subunit of the RZZ complex in higher eukaryotes (38), and Num1 (39), which might bind newly favored conformations. Further, in the IC sequences of higher eukaryotes the LH domain preceding QT2 is replaced by an extended motif for binding dynein light chain Tctex1, suggesting the possibility of a ligand that binds Tctex1 in higher eukaryotes and Pac11 LH in yeast.
IDP Duplex Scaffolds
This work identifies residue-specific binding effects of dimeric proteins Nip100 and Dyn2 on apo Pac11, a monomeric, IDP. The Pac11-Dyn2 complex is one example of a more general class of IDP systems in which two IDP monomers bind one or more LC8-like proteins to form a duplex scaffold composed of two IDP chains in parallel alignment (15, 31, 40, 41). Along the scaffold are multiple bivalent sites for assembly of various essential bivalent proteins. In the functional assembly, the scaffold does not fold into an arrangement of packed macromolecules; rather the overall complex retains an inherent flexibility in IDP “linker” sequences between bound proteins. The developing insight is that, in these disordered linker sequences, the duplex often self-organizes new domains in response to binding partner ligands. The new domains may self-associate and/or offer new binding surfaces for additional ligands, not necessarily bivalent. A “new domain” in this sense is not a folded unit but rather a dynamic ensemble in which the relative populations of local, interconverting, and widely varying conformations can be shifted when the duplex binds partner ligands. In other words, a new domain is a sequence element of local dynamic structure in which conformational populations may shift when the IDP chain is constrained by binding partner ligands. In apo IDPs, these domains may or may not be experimentally detected by a tendency to form secondary structure. However, when the IDP is incorporated into a duplex by binding a cross-linking ligand, the domains are detected as contiguous residues that, for example, are self-associated (one segment from each chain), that display increased secondary structure, and/or that have NMR peaks that are sensitive to changes in field strength. New elements of dynamic structure identified for the IDP duplex scaffold of Pac11 are LH domains in response to Pac11 binding of Dyn2 or Nip100 and an L1 domain in response to binding of Nip100.
These results reinforce several generalizations about IDP duplex scaffolds and underscore the interplay of intrinsic disorder, bivalency, and propensity to form local dynamic structure in propagating long range effects of ligand binding to IDP scaffolds. First, binding contacts of bivalent partner proteins are limited to IDP residues in and near the recognition motif. Second, the flexible linkers that retain disorder in the duplex are not featureless peptide sequences connecting binding motifs; rather they contain elements of dynamic structure from which conformations specific for self-association and/or for binding additional ligands may be selected. Last, the biological relevance of IDP duplex scaffolds extends beyond dynein; an array of similar IDP scaffolds is expected for assemblies that function in an astonishingly broad range of biological systems (42, 43), including interactions with the DNA damage response protein ASCIZ, tumor suppressor protein Kibra, mitotic spindle assembly protein Chica and in rabies virus (44–47).
Author Contributions
E. B. conceived and coordinated the study. J. J. and E. B. designed, performed, analyzed, interpreted all the data and wrote the paper. F. L. collected the NMR experiments for assignments and dynamics and all the 900 MHz data and provided assistance with interpretation of NMR experiments. All authors reviewed the results and approved the final version of the manuscript.
Acknowledgments
We thank Prof. Peter Knight for suggesting the presence of SAH domain in IC and Prof. Clare Woodward and the Barbar lab for valuable discussions. We acknowledge access to the Research Infrastructure activity in the 7th Framework Programme.
This work was supported, in whole or in part, by National Institutes of Health Grant GM 084276 (to E. B.), the protein core facility in the Oregon State University Environmental Health Sciences Center through NIEHS, National Institutes of Health Grant 00210 and by Bio-NMR, Project Number 261863 (Frankfurt, Germany). The authors declare that they have no conflicts of interest with the contents of this article.
- IC
- intermediate chain
- SAH
- single α-helix
- IDP
- intrinsically disordered protein
- HSQC
- heteronuclear single quantum coherence
- LH
- linker helix, or short nascent helix
- TROSY
- transverse relaxation optimized spectroscopy.
References
- 1. Vallee R. B., Williams J. C., Varma D., Barnhart L. E. (2004) Dynein: an ancient motor protein involved in multiple modes of transport. J. Neurobiol. 58, 189–200 [DOI] [PubMed] [Google Scholar]
- 2. Yang Z., Tulu U. S., Wadsworth P., Rieder C. L. (2007) Kinetochore dynein is required for chromosome motion and congression independent of the spindle checkpoint. Curr. Biol. 17, 973–980 [DOI] [PMC free article] [PubMed] [Google Scholar]
- 3. Kini A. R., Collins C. A. (2001) Modulation of cytoplasmic dynein ATPase activity by the accessory subunits. Cell Motil. Cytoskeleton 48, 52–60 [DOI] [PubMed] [Google Scholar]
- 4. Vallee R. B., McKenney R. J., Ori-McKenney K. M. (2012) Multiple modes of cytoplasmic dynein regulation. Nat. Cell Biol. 14, 224–230 [DOI] [PubMed] [Google Scholar]
- 5. Schroer T. A. (2004) Dynactin. Annu. Rev. Cell Dev. Biol. 20, 759–779 [DOI] [PubMed] [Google Scholar]
- 6. Gill S. R., Schroer T. A., Szilak I., Steuer E. R., Sheetz M. P., Cleveland D. W. (1991) Dynactin, a conserved, ubiquitously expressed component of an activator. J. Cell Biol. 115, 1639–1650 [DOI] [PMC free article] [PubMed] [Google Scholar]
- 7. King S. J., Schroer T. A. (2000) Dynactin increases the processivity of the cytoplasmic dynein motor. Nat. Cell Biol. 2, 20–24 [DOI] [PubMed] [Google Scholar]
- 8. Kardon J. R., Reck-Peterson S. L., Vale R. D. (2009) Regulation of the processivity and intracellular localization of Saccharomyces cerevisiae dynein by dynactin. Proc. Natl. Acad. Sci. U.S.A. 106, 5669–5674 [DOI] [PMC free article] [PubMed] [Google Scholar]
- 9. Adames N. R., Cooper J. A. (2000) Microtubule interactions with the cell cortex causing nuclear movements in Saccharomyces cerevisiae. J. Cell Biol. 149, 863–874 [DOI] [PMC free article] [PubMed] [Google Scholar]
- 10. Stuchell-Brereton M. D., Siglin A., Li J., Moore J. K., Ahmed S., Williams J. C., Cooper J. A. (2011) Functional interaction between dynein light chain and intermediate chain is required for mitotic spindle positioning. Mol. Biol. Cell 22, 2690–2701 [DOI] [PMC free article] [PubMed] [Google Scholar]
- 11. McKenney R. J., Weil S. J., Scherer J., Vallee R. B. (2011) Mutually exclusive cytoplasmic dynein regulation by NudE-Lis1 and dynactin. J. Biol. Chem. 286, 39615–39622 [DOI] [PMC free article] [PubMed] [Google Scholar]
- 12. Morgan J. L., Song Y., Barbar E. (2011) Structural dynamics and multiregion interactions in dynein-dynactin recognition. J. Biol. Chem. 286, 39349–39359 [DOI] [PMC free article] [PubMed] [Google Scholar]
- 13. Williams J. C., Roulhac P. L., Roy A. G., Vallee R. B., Fitzgerald M. C., Hendrickson W. A. (2007) Structural and thermodynamic characterization of a cytoplasmic dynein light chain-intermediate chain complex. Proc. Natl. Acad. Sci. U.S.A. 104, 10028–10033 [DOI] [PMC free article] [PubMed] [Google Scholar]
- 14. Siglin A. E., Sun S., Moore J. K., Tan S., Poenie M., Lear J. D., Polenova T., Cooper J. A., Williams J. C. (2013) Dynein and dynactin leverage their bivalent character to form a high-affinity interaction. PLoS One 8, e59453. [DOI] [PMC free article] [PubMed] [Google Scholar]
- 15. Nyarko A., Song Y., Nováček J., Žídek L., Barbar E. (2013) Multiple recognition motifs in nucleoporin Nup159 provide a stable and rigid Nup159-Dyn2 assembly. J. Biol. Chem. 288, 2614–2622 [DOI] [PMC free article] [PubMed] [Google Scholar]
- 16. Hall J., Song Y., Karplus P. A., Barbar E. (2010) The crystal structure of dynein intermediate chain-light chain roadblock complex gives new insights into dynein assembly. J. Biol. Chem. 285, 22566–22575 [DOI] [PMC free article] [PubMed] [Google Scholar]
- 17. Salzmann M., Pervushin K., Wider G., Senn H., Wüthrich K. (1998) TROSY in triple-resonance experiments: new perspectives for sequential NMR assignment of large proteins. Proc. Natl. Acad. Sci. U.S.A. 95, 13585–13590 [DOI] [PMC free article] [PubMed] [Google Scholar]
- 18. Favier A., Brutscher B. (2011) Recovering lost magnetization: polarization enhancement in biomolecular NMR. J. Biomol. NMR 49, 9–15 [DOI] [PubMed] [Google Scholar]
- 19. Löhr F., Schmidt J. M., Rüterjans H. (1999) Simultaneous measurement of 3JHN, Hα and 3JHα, Hβ coupling constants in 13C,15N-labeled proteins. J. Am. Chem. Soc. 121, 11821–11826 [Google Scholar]
- 20. Farrow N. A., Muhandiram R., Singer A. U., Pascal S. M., Kay C. M., Gish G., Shoelson S. E., Pawson T., Forman-Kay J. D., Kay L. E. (1994) Backbone dynamics of a free and phosphopeptide-complexed Src homology 2 domain studied by 15N NMR relaxation. Biochemistry 33, 5984–6003 [DOI] [PubMed] [Google Scholar]
- 21. Lakomek N.-A., Ying J., Bax A. (2012) Measurement of 15N relaxation rates in perdeuterated proteins by TROSY-based methods. J. Biomol. NMR 53, 209–221 [DOI] [PMC free article] [PubMed] [Google Scholar]
- 22. Goddard T. D., Kneller D. G.. SPARKY3, University of California, San Francisco [Google Scholar]
- 23. Johnson B. A. (2004) Using NMRView to visualize and analyze the NMR spectra of macromolecules. Methods Mol. Biol. 278, 313–352 [DOI] [PubMed] [Google Scholar]
- 24. Kjaergaard M., Brander S., Poulsen F. M. (2011) Random coil chemical shift for intrinsically disordered proteins: effects of temperature and pH. J. Biomol. NMR 49, 139–149 [DOI] [PubMed] [Google Scholar]
- 25. Benison G., Nyarko A., Barbar E. (2006) Heteronuclear NMR identifies a nascent helix in intrinsically disordered dynein intermediate chain: implications for folding and dimerization. J. Mol. Biol. 362, 1082–1093 [DOI] [PubMed] [Google Scholar]
- 26. Shen Y., Lange O., Delaglio F., Rossi P., Aramini J. M., Liu G., Eletsky A., Wu Y., Singarapu K. K., Lemak A., Ignatchenko A., Arrowsmith C. H., Szyperski T., Montelione G. T., Baker D., Bax A. (2008) Consistent blind protein structure generation from NMR chemical shift data. Proc. Natl. Acad. Sci. U.S.A. 105, 4685–4690 [DOI] [PMC free article] [PubMed] [Google Scholar]
- 27. Lupas A., Van Dyke M., Stock J. (1991) Predicting coiled coils from protein sequences. Science 252, 1162–1164 [DOI] [PubMed] [Google Scholar]
- 28. Buchan D. W., Minneci F., Nugent T. C., Bryson K., Jones D. T. (2013) Scalable web services for the PSIPRED protein analysis workbench. Nucleic Acids Res. 41, W349–W357 [DOI] [PMC free article] [PubMed] [Google Scholar]
- 29. Peckham M., Knight P. J. (2009) When a predicted coiled coil is really a single α-helix, in myosins and other proteins. Soft Matter 5, 2493–2503 [Google Scholar]
- 30. Rao L., Romes E. M., Nicholas M. P., Brenner S., Tripathy A., Gennerich A., Slep K. C. (2013) The yeast dynein Dyn2-Pac11 complex is a dynein dimerization/processivity factor: structural and single-molecule characterization. Mol. Biol. Cell 24, 2362–2377 [DOI] [PMC free article] [PubMed] [Google Scholar]
- 31. Nyarko A., Barbar E. (2011) Light chain-dependent self-association of dynein intermediate chain. J. Biol. Chem. 286, 1556–1566 [DOI] [PMC free article] [PubMed] [Google Scholar]
- 32. Nyarko A., Song Y., Barbar E. (2012) Intrinsic disorder in dynein intermediate chain modulates its interactions with NudE and dynactin. J. Biol. Chem. 287, 24884–24893 [DOI] [PMC free article] [PubMed] [Google Scholar]
- 33. Knight P. J., Thirumurugan K., Xu Y., Wang F., Kalverda A. P., Stafford W. F. 3rd, Sellers J. R., Peckham M. (2005) The predicted coiled-coil domain of myosin 10 forms a novel elongated domain that lengthens the head. J. Biol. Chem. 280, 34702–34708 [DOI] [PubMed] [Google Scholar]
- 34. Baboolal T. G., Sakamoto T., Forgacs E., White H. D., Jackson S. M., Takagi Y., Farrow R. E., Molloy J. E., Knight P. J., Sellers J. R., Peckham M. (2009) The SAH domain extends the functional length of the myosin lever. Proc. Natl. Acad. Sci. U.S.A. 106, 22193–22198 [DOI] [PMC free article] [PubMed] [Google Scholar]
- 35. Hall J., Karplus P. A., Barbar E. (2009) Multivalency in the assembly of intrinsically disordered dynein intermediate chain. J. Biol. Chem. 284, 33115–33121 [DOI] [PMC free article] [PubMed] [Google Scholar]
- 36. Benison G., Karplus P. A., Barbar E. (2007) Structure and dynamics of LC8 complexes with KXTQT-motif peptides: swallow and dynein intermediate chain compete for a common site. J. Mol. Biol. 371, 457–468 [DOI] [PubMed] [Google Scholar]
- 37. Slevin L. K., Romes E. M., Dandulakis M. G., Slep K. C. (2014) The mechanism of dynein light chain LC8-mediated oligomerization of the Ana2 centriole duplication factor. J. Biol. Chem. 289, 20727–20739 [DOI] [PMC free article] [PubMed] [Google Scholar]
- 38. Whyte J., Bader J. R., Tauhata S. B., Raycroft M., Hornick J., Pfister K. K., Lane W. S., Chan G. K., Hinchcliffe E. H., Vaughan P. S., Vaughan K. T. (2008) Phosphorylation regulates targeting of cytoplasmic dynein to kinetochores during mitosis. J. Cell Biol. 183, 819–834 [DOI] [PMC free article] [PubMed] [Google Scholar]
- 39. Farkasovsky M., Küntzel H. (2001) Cortical Num1p interacts with the dynein intermediate chain Pac11p and cytoplasmic microtubules in budding yeast. J. Cell Biol. 152, 251–262 [DOI] [PMC free article] [PubMed] [Google Scholar]
- 40. Kidane A. I., Song Y., Nyarko A., Hall J., Hare M., Löhr F., Barbar E. (2013) Structural features of LC8-induced self-association of swallow. Biochemistry 52, 6011–6020 [DOI] [PMC free article] [PubMed] [Google Scholar]
- 41. Barbar E., Nyarko A. (2015) Polybivalency and disordered proteins in ordering macromolecular assemblies. Semin. Cell Dev. Biol. 37, 20–25 [DOI] [PMC free article] [PubMed] [Google Scholar]
- 42. Barbar E. (2008) Dynein light chain LC8 is a dimerization hub essential in diverse protein networks. Biochemistry 47, 503–508 [DOI] [PubMed] [Google Scholar]
- 43. Rapali P., Szenes Á., Radnai L., Bakos A., Pál G., Nyitray L. (2011) DYNLL/LC8: a light chain subunit of the dynein motor complex and beyond. FEBS J. 278, 2980–2996 [DOI] [PubMed] [Google Scholar]
- 44. Rapali P., García-Mayoral M. F., Martínez-Moreno M., Tárnok K., Schlett K., Albar J. P., Bruix M., Nyitray L., Rodriguez-Crespo I. (2011) LC8 dynein light chain (DYNLL1) binds to the C-terminal domain of ATM-interacting protein (ATMIN/ASCIZ) and regulates its subcellular localization. Biochem. Biophys. Res. Commun. 414, 493–498 [DOI] [PubMed] [Google Scholar]
- 45. Rayala S. K., den Hollander P., Manavathi B., Talukder A. H., Song C., Peng S., Barnekow A., Kremerskothen J., Kumar R. (2006) Essential role of KIBRA in co-activator function of dynein light chain 1 in mammalian cells. J. Biol. Chem. 281, 19092–19099 [DOI] [PubMed] [Google Scholar]
- 46. Dunsch A. K., Hammond D., Lloyd J., Schermelleh L., Gruneberg U., Barr F. A. (2012) Dynein light chain 1 and a spindle-associated adaptor promote dynein asymmetry and spindle orientation. J. Cell Biol. 198, 1039–1054 [DOI] [PMC free article] [PubMed] [Google Scholar]
- 47. Raux H., Flamand A., Blondel D. (2000) Interaction of the rabies virus P protein with the LC8 dynein light chain. J. Virol. 74, 10212–10216 [DOI] [PMC free article] [PubMed] [Google Scholar]
- 48. Delano W. L. (2002) PyMOL Molecular Graphics System, DeLano Scientific LLC, San Carlos, CA [Google Scholar]