

Abstract
In vitro preclinical models for the assessment of drug-induced liver injury (DILI) are usually based on cryopreserved primary human hepatocytes (cPHH) or human hepatic tumor-derived cell lines; however, it is unclear how well such cell models reflect the normal function of liver cells. The physiological, pharmacological, and toxicological phenotyping of available cell-based systems is necessary in order to decide the testing purpose for which they are fit. We have therefore undertaken a global proteomic analysis of 3 human-derived hepatic cell lines (HepG2, Upcyte, and HepaRG) in comparison with cPHH with a focus on drug metabolizing enzymes and transport proteins (DMETs), as well as Nrf2-regulated proteins. In total, 4946 proteins were identified, of which 2722 proteins were common across all cell models, including 128 DMETs. Approximately 90% reduction in expression of cytochromes P450 was observed in HepG2 and Upcyte cells, and approximately 60% in HepaRG cells relative to cPHH. Drug transporter expression was also lower compared with cPHH with the exception of MRP3 and P-gp (MDR1) which appeared to be significantly expressed in HepaRG cells. In contrast, a high proportion of Nrf2-regulated proteins were more highly expressed in the cell lines compared with cPHH. The proteomic database derived here will provide a rational basis for the context-specific selection of the most appropriate ‘hepatocyte-like’ cell for the evaluation of particular cellular functions associated with DILI and, at the same time, assist in the construction of a testing paradigm which takes into account the in vivo disposition of a new drug.
Keywords: DMETS, metabolism, hepatocytes, DILI
Drug-induced liver injury (DILI) is a major cause of human morbidity and mortality. In addition, DILI is responsible for considerable attrition during drug development and represents a significant burden on public health budgets (Chen et al., 2014). A key reason for this problem is our inability to predict DILI at the preclinical stage using currently available model systems. Such models include in vivo animal models and in vitro models based on human-derived liver cells. Species differences in drug disposition and mechanisms of cytotoxicity can make whole animal studies unreliable for absolute extrapolation to man: it has been estimated that in vivo DILI testing will only correctly predict a DILI liability about 50% of the time (Olson et al., 2000) whereas in vitro models are predictive only on 1 in 4 occasions (Xu et al., 2004). In addition, whole animal models are costly and of low throughput. Therefore, it is essential to develop in vitro models that are more predictive of DILI, particularly those that are based on human or ‘humanized’ component cells. There are currently limited sources of fresh human hepatocytes worldwide, particularly within the EU. Cryopreserved primary human liver cells do provide a potential alternative and carry the advantage that they can be phenotypically pre-characterized prior to use, and batch-to-batch consistency is likely to be higher than their fresh counterparts. However, such cells are costly and their metabolic function may be compromised by the freezing process (Guillouzo et al., 2007; Stephenne et al., 2010). Due to these difficulties associated with the use of fresh or cryopreserved primary human liver cells for toxicological purposes, preclinical models are often constructed with human tumor-derived cell lines or genetically manipulated hepatocytes, both of which provide a reproducible and expandable alternative. Such cells thus have the ideal properties of consistency and convenience for developing high-throughput and low cost drug screening systems; however, it is unclear how well such cells reflect the normal physiology of liver cells in the context of an intact liver.
The IMI-funded MIP-DILI (Mechanism-Based and Integrated Systems for the Prediction of Drug-Induced Liver Injury) consortium aims to deliver improved models for DILI prediction through a deeper understanding of the underlying physiology, pharmacology, and toxicology of in vivo and in vitro models. As part of this consortium, we have attempted a physiological characterization of cells in use by industry for comparative evaluation of the major determinants/drivers of ADMETOX: Phase I–III proteins. We conducted an unbiased global comparison of the proteomes of 2 commonly used immortalized human liver cell lines, HepG2 and HepaRG, and a genetically-modified proliferative primary human liver cell model (Upcyte cells) (Stephenne et al., 2007), and related these to cryopreserved primary human hepatocytes (cPHH). Because the disposition of a drug may have a major bearing on its toxicity, we have focussed in the first instance on drug metabolizing enzymes and transport (DMET) proteins, and on proteins involved in cytoprotection within the cells: notably those regulated by the Nrf2-Keap1 signaling pathway.
The scope of this work was to assess the relative differences in protein expression between the cell lines and not to provide absolute quantification as has been done for a selection of DMETS in liver tissues and primary hepatocytes in recent years (Ji et al., 2012; Ohtsuki et al., 2012; Schaefer et al., 2012; Xu et al., 2014). Furthermore, the aim of this study was not to rank the cell lines, but rather to deliver a comprehensive protein expression dataset that provides a useful resource for the context-specific selection of the most appropriate cell type for a given purpose. It is hoped that this information will provide the basis and direction for a rational approach to the development of new, more sophisticated in vitro models for the prediction of DILI and facilitate the interpretation of the derived data.
EXPERIMENTAL PROCEDURES
Cell Culture
All cells were cultured under conditions established in-house or that were recommended by the supplier. This meant that there were small differences in the procedures used across the different cell types, but that they conformed as closely as possible to those used typically for those specific cells.
Cryopreserved primary human hepatocytes
Three donors of cPHH (KaLy-Cell, Plobsheim, France) (Supplementary Table S6) were thawed in KaLy-Cell thawing medium (KLC-TM; proprietary formulation) and subsequently centrifuged at 168 × g for 20 min at room temperature. The supernatants were discarded and the cell pellets resuspended in KLC-washing medium (KLC-WM; proprietary formulation) followed by centrifugation at 100 × g for 5 min at room temperature. The supernatants were again discarded and the cell pellets resuspended and cultured in KLC-seeding medium (KLC-SM) which was composed of Williams’ Medium E (Life Technologies, Paisley, UK) supplemented with 10% heat inactivated foetal calf serum (FCS, Life Technologies), 1 μM dexamethasone (Sigma-Aldrich, St Louis, Missouri), 4 μg/ml insulin (Life Technologies) and 10 U penicillin/10 µg streptomycin (Life Technologies). The attachment efficiency of cryopreserved hepatocytes varied between donors with cell densities ranging between 300 000 and 400 000 cells/well of a 24 well plate. Cell number and viability were determined using the trypan blue exclusion method.
HepG2 cells
A specific clone of HepG2 cells was purchased from the European Collection of Cell Cultures for use within the MIP-DILI consortium. The HepG2 cells were cultured in Dulbecco’s Modified Eagle’s Medium (DMEM; Lonza, Basel, Switzerland) supplemented with 10% FBS (Lonza), 1% penicillin/streptomycin (Lonza), 1% L-glutamine (Lonza) and 1% non-essential amino acids (Sigma-Aldrich). Routine passage was performed with Trypsin-EDTA (Lonza) when the cells were 80% confluent in culture. Approximately 10 million cells were cultured and harvested for proteomic analysis. Cells were cultured in 24 well plates with a seeding density of 250 000 cells/well. Cell number and viability were determined using the trypan blue exclusion method.
Fresh HepaRG cells
Frozen undifferentiated HepaRG cells were purchased from Biopredic International (Saint-Gregoire, France) and differentiated in-house into fresh fully-differentiated HepaRG cells under a license agreement, according to the supplier’s protocol. Approximately 10 million cells were cultured and harvested for proteomic analysis. Cells were cultured in 24 well plates with a seeding density of 225 000 cells/well.
Upcyte hepatocytes
Upcyte hepatocytes from 1 donor (Medicyte, Heidelberg, Germany) were thawed in Upcyte TM composed of Upcyte high performance medium (Medicyte; proprietary formulation) and 10% FCS (Fisher Scientific, Paisley, UK). The cells were then centrifuged at 90 × g for 5 min at room temperature, the supernatant discarded and the cell pellet resuspended and cultured in fresh Upcyte high performance medium (Medicyte, Heidelberg, Germany). Approximately 10 million cells were cultured and harvested for proteomic analysis. Cells were cultured in 24 well plates with a seeding density of 150 000 cells/well. Cell number and viability were determined using the trypan blue exclusion method.
Stable-Isotope Labeling (iTRAQ)
Approximately 10 million of cPHH, HepG2, Upcyte, or HepaRG cells were plated at the appropriate cell density for a 24-well plate format and cultured at 37°C/5% CO2/95% air. The length of time during which the cells were cultured depended on the cell type. The cells were then harvested in ice-cold phosphate buffer by gentle scraping and centrifuged at 2000 g for 5 min. The supernatant was discarded and the cell pellets stored at −80°C until analysis.
Each cell pellet was thawed and lysed immediately by sonication in an equal volume to packed cells of 0.5 M triethylammonium bicarbonate/0.1% sodium dodecyl sulfate (SDS). The resulting cell lysate was centrifuged at 14 000 g for 15 min at 4°C and the supernatant was recovered. Protein concentration was determined by the Bradford assay (Bradford, 1976).
Sample labeling was carried out according to the manufacturer’s instructions (iTRAQ Reagents Multiplex kit; AB Sciex, Foster City, California). Briefly, 100 μg of protein from each sample was reduced using 50 mM tris-(2-carboxyethyl) phosphine for 1 h at 60°C, alkylated with 10 mM s-methyl methanethiosulfonate (MMTS) for 10 min at room temperature and digested with 10 μg trypsin overnight at 37°C, prior to labeling with one of the individual 8-plex-iTRAQ tags for 2 h at room temperature. Samples were pooled and the pH adjusted to <3 with phosphoric acid before being separated on a polysulfoethyl A (200 × 4.6 mm, 5 μm, 200 Å; PolyLC Columbia, Maryland) strong cation exchange column. Strong cation exchange chromatography was performed on an Agilent 1100 system using Buffer A (10 mM KH2PO4 in 25% ACN, pH 3.0) and Buffer B (10 mM KH2PO4, 1 mM KCl in 25% ACN, pH 3.0) on a 95-min gradient with a flow rate of 1 ml/min. Collected fractions were dried using a vacuum centrifuge and resuspended in 40 μl of 0.1 % formic acid prior to mass spectrometry (MS) analysis.
nanoLC-MS/MS Analysis
Peptide fractions were injected using an Eksigent cHiPLC Nanoflex system equipped with a trap column (C18-CL 3 μm, 0.5 mm, 120 Å) and a separation column (C18-CL 3 μm, 15 cm, 120 Å ChromXP) on a 2-h gradient. MS analysis was performed on a TripleTOF 5600 system (AB Sciex) in information dependent acquisition mode. MS spectra were acquired across the mass range of 400–1650 m/z using 250 ms accumulation time per spectrum. The MS/MS was carried out across the scanning range of 100–1400 m/z. A maximum of 25 precursors per cycle were chosen for fragmentation using 100 ms accumulation time and a rolling collision energy increased by 5 from standard settings to improve the detection of the reporter ions. Protein identification and quantification was performed by ProteinPilot software v3.0 (AB Sciex) using the Paragon algorithm and the UniProt/SwissProt database. The data were normalized for errors due to differential sample loading and co-eluting peptide signal by bias and background correction, respectively. A fixed modification of MMTS-labeled cysteine was used, biological modifications were allowed, and the detected protein threshold was set to 10 %. Ratios for each iTRAQ label were obtained using a pooled sample as a reference which consisted of combined aliquots of each individual sample tested.
Western blot analysis
To confirm the proteomic results, Western blot analysis was performed on the same samples that were used for iTRAQ. Briefly, 10 µg of denatured protein from each sample were loaded onto home-made 10 % acrylamide gels and the proteins separated in 3-(N-Morpholino) propane sulfonic acid-SDS running buffer at 90 V for 10 min and a further 60 min at 170 V. The resolved proteins were subsequently transferred onto a nitrocellulose membrane for 1 h at 80 V in transfer buffer (50 mM glycine/25 mM Tris) with 20% MeOH (v/v). To ensure complete transfer of proteins, a visual check of the nitrocellulose membrane was performed after staining with Ponceau Red. The transferred proteins were then blocked with 10% milk in Tris-Buffered Saline/0.1% Tween 20 at 5°C for 1 h. Incubation conditions of the primary and secondary antibodies were dependent on the proteins of interest. Conditions used to detect for CYP1A2, 2D6, 2E1, and 3A4 as well as GSTP1 and UDPGT 1A1 are detailed in Supplementary Table S7.
Data analysis
Pilot Descriptive Statistics version 2.6.2 (Sciex) was used to assess the quantification false discovery rate (FDR) for each of the iTRAQ datasets. An internal replicate of a pooled sample containing all the different cell types was included in 2 of the iTRAQ lanes (119 and 121) to enable the intra-assay consistency of the quantification to be evaluated. The analysis revealed that in all 3 datasets, a 1% FDR was equivalent to a p-value threshold for protein quantification of .01. Using this value, only 6 (0.16%), 4 (0.09%), and 3 (0.07%) proteins exhibited significant fold changes in the 119:121 ratio across the 3 runs, respectively.
Raw p-values were generated using a 2-tailed t test, and were subsequently adjusted for multiple hypothesis testing using the Benjamini and Hochberg correction. Heat maps were generated using the programming language R-3.0.1 (http://www.r-project.org/). Hierarchical clustering was calculated using Euclidean distance metric with complete linkage. Canonical pathways were generated using Ingenuity Pathway Analysis (IPA) software (Ingenuity, Mountain View, California; www.ingenuity.com) using inputs of gene identifiers, log2 fold changes, and p-values between 2-group comparisons.
RESULTS
Global Protein Expression in HepG2, Upcyte, and HepaRG Cells Relative to cPHHs
iTRAQ-based relative quantification of protein profiles were determined for HepG2, Upcyte, and HepaRG cells, and compared with the protein profile of cPHH. A total of 4696 unique proteins were identified across the 4 cell models, of which 2722 were common and quantified in each of the 3 independent biological replicates of every cell type at an FDR of < 1% (Table 1). A list of the Phase I, II, III, and Nrf2-regulated proteins for which relative quantification was obtained in every cell type is presented in Supplementary Tables S2–S5. Representative examples of mass spectra obtained for 4 DMET proteins of relevance to DILI (Cyp2E1, GSTmu, BSEP, and MDR1) along with the iTRAQ reagent motif used for relative quantification across the cell lines, are included in the Supplementary Data (Supplementary Fig. S1). Hierarchical clustering of the 2722 common proteins (Fig. 1) indicated that cPHH were clearly segregated from the other cell types, but that the overall expression profile of the HepaRG cells was closer to that of the cPHH than were those of the HepG2 or Upcyte cells. Furthermore, the clustering observed between the HepG2 and Upcyte cells suggests very similar protein expression profiles between these 2 cell types.
TABLE 1.
Global Hepatic Protein Expression in cPHHs, HepaRG, HepG2, and Upcyte cells
| Biological replicate | No. of proteins identified | No. of proteins at 1% FDR | Proteins quantified |
|---|---|---|---|
| 1 | 4335 | 3722 | 3197 |
| 2 | 4887 | 4636 | 4397 |
| 3 | 4891 | 4355 | 3794 |
| Total number of unique proteins | 4696 | ||
| Total number of common proteins | 2722 | ||
HepaRG, HepG2, and Upcyte cells as well as 3 donors of cPHHs were assessed for their basal expression of liver proteins by LC-MS/MS. Three biological replicates were performed from which 2722 proteins were found to be common between the 4 cell models.
FIG. 1.
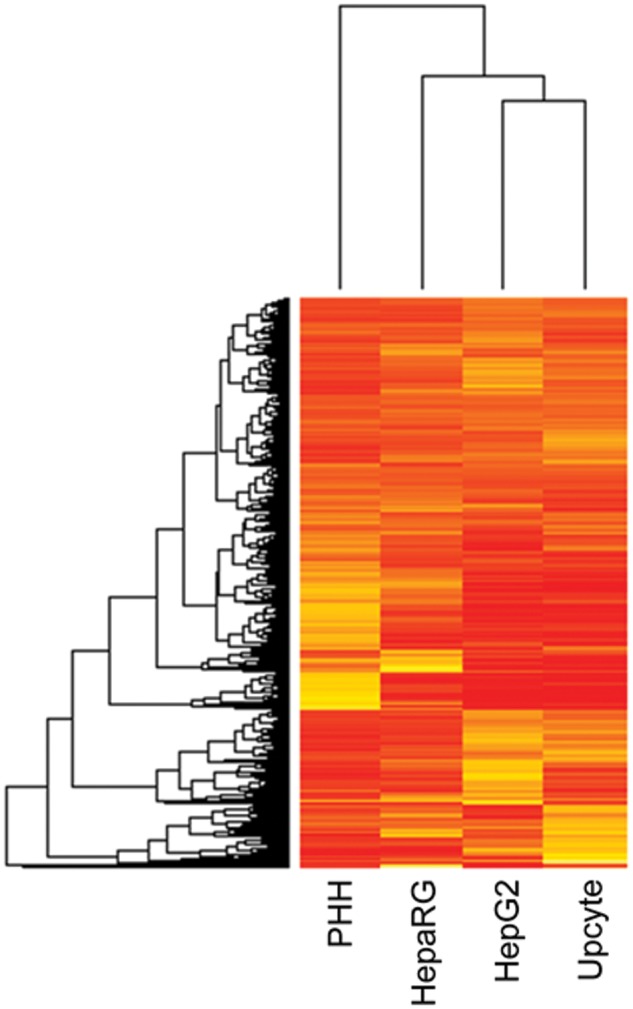
A heat map representation of the 2722 common proteins identified in all 4 cell systems. Heirarchical clustering was calculated using Euclidean distance metric with complete linkage. Rows represent protein IDs and columns represent the different samples analyzed. Values range from low to high using increments of dark and light, respectively.
Using the p-values (−log10 p-value) and log2 fold change for each protein, volcano plots were generated (Fig. 2) to compare the level of significance and magnitude of change across the total proteomes of the HepG2, Upcyte, and HepaRG cells compared with cPHH. In agreement with the global heat map in Figure 1, the volcano plots comparing the HepG2 and Upcyte cells with the cPHH demonstrated a similar distribution of points, with a large number of proteins being significantly lower in expression in the HepG2 and Upcyte cells compared with the cPHH. A more uniform distribution was observed in the volcano plot that compared the HepaRG cells with the cPHH, demonstrating less divergence of protein expression and therefore a more closely associated overall protein expression profile to the cPHH. In general, all the 3 cell lines showed lower expression of a number of proteins associated with the mitochondrion, steroid metabolism, and drug metabolism. On the other hand, some protein groups were significantly more abundant in the cell lines relative to the cPHH, including some transcriptional regulators, such as high mobility group protein HMGI-C, and proteins involved in cell motility, such as myristoylated alanine-rich C-kinase substrate.
FIG. 2.

Comparison of basal hepatic proteins expressed in HepG2, Upcyte, and HepaRG cells with cPHHs. Volcano plots of HepG2, Upcyte, and HepaRG cells relative to cPHHs indicating statistical significance (−log10 p-value) versus log2 fold change. Blue (dark) circles indicate proteins with a p-value of < .05.
In order to identify common pathways that were most significantly represented in all 3 cell lines, canonical pathway analysis was undertaken using IPA. IPA calculates the significance value of a given canonical pathway as the probability that the pathway or function is associated with the data set by random chance. This is done by considering the number of proteins in the experimental data set that participate in that process, compared with the total number of proteins that are known to be associated with that process in the selected reference set (Ingenuity Knowledge Base). Table 2 shows the 20 top canonical pathways based on the total protein group analyzed and includes the log2 fold change in expression for each of these pathways in each of the 3 different cell lines relative to the cPHH. From the 20 canonical pathways, 14 were downregulated in HepG2s, HepaRGs, and Upcytes when compared with cPHH. Upregulation was observed in pathways involved in cell proliferation. It appears that there is an overall downregulation of the majority of cell functions in the cancerous cell lines and the Upcytes when compared with cPHH with HepaRGs having a less pronounced difference and appearing to be more closely related to cPHH.
TABLE 2.
The top 20 canonical pathways and the average magnitude of change in protein expression of the individual cell lines relative to cPHHs.
| HepG2 versus cPHH | HepaRG versus cPHH | Upcyte versus cPHH | |
|---|---|---|---|
| Pathway | Mean Log2 Fold Change | Mean Log2 Fold Change | Mean Log2 Fold Change |
| EIF2 signaling | 1.54 | 0.68 | 1.12 |
| Mitochondrial dysfunction | −2.92 | −1.00 | −2.79 |
| Oxidative phosphorylation | −2.89 | −1.19 | −3.06 |
| Regulation of eIF4 and p70S6K signaling | 1.44 | 0.81 | 1.19 |
| tRNA charging | 0.83 | 0.34 | 0.51 |
| Serotonin degradation | −4.46 | −1.79 | −4.95 |
| Ethanol degradation II | −3.27 | −1.41 | −4.29 |
| Mammalian target of rapamycin signaling | 1.36 | 0.67 | 0.98 |
| Fatty acidβ-oxidation I | −3.57 | −1.56 | −3.6 |
| Noradrenaline and adrenaline degradation | −3.85 | −1.57 | −4.46 |
| TCA Cycle II | −3.4 | −0.76 | −3.29 |
| Xenobiotic metabolism signaling | −2.61 | −0.97 | −2.92 |
| Superpathway of cholesterol biosynthesis | −1.49 | −0.16 | −0.75 |
| Valine degradation I | −4.65 | −1.56 | −4.47 |
| Nrf2−mediated oxidative stress response | −1.18 | −0.22 | −1.32 |
| Nicotined Degradation II | −5.37 | −2.19 | −5.20 |
| Superpathway of methionine degradation | −2.23 | −1.20 | −2.66 |
| Remodeling of epithelial adherens junctions | 0.69 | 0.61 | 1.28 |
| Bile acid biosynthesis neutral pathway | −4.30 | −1.24 | −5.04 |
| Protein ubiquitination pathway | 0.84 | 0.12 | 0.40 |
Expression of Proteins Involved in Determining the Disposition and Toxicity of Xenobiotics
In order to determine the quality of the 3 cell lines with respect to drug disposition, a heat map was generated based on the expression of 128 proteins defined by inspection as being involved in drug metabolism or transport (DMET proteins, Fig. 3). This comprised of 50 Phase I, 51 Phase II, and 27 Phase III (transporter) proteins. In a similar pattern to the global heat map in Figure 1, the cPHH were clearly segregated but also demonstrated varying degrees of association with the other 3 cell types, the closest being the HepaRG followed by the HepG2 and Upcyte cells. These observations were further demonstrated in Figure 4 where volcano plots of the total proteome were generated and the DMET proteins including cytochrome P450 (CYP450), Phase II and drug transporter proteins were highlighted for each cell type to show the significance and magnitude of change of these proteins relative to cPHH.
FIG. 3.
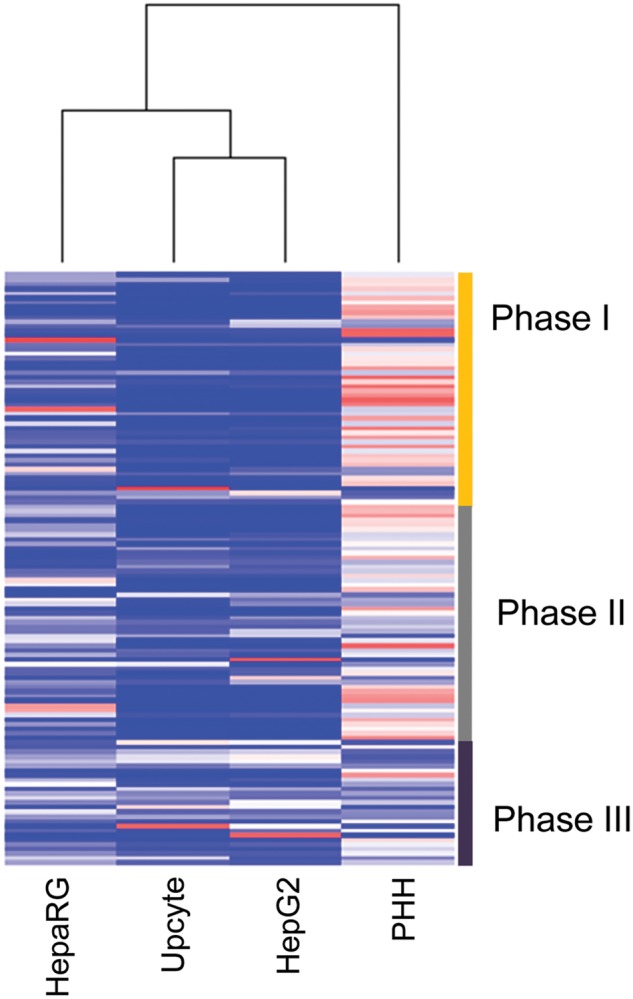
DMET proteins in cPHHs, HepG2, HepaRG, and Upcyte cells. Heat map representing the basal expression of the 128 DMET proteins that are common in all 4 cell systems. Values range from low to high using increments of blue (dark) and red (light) respectively. Sidebar divides the heat map into phase I, II and III proteins. Full color version available online.
FIG. 4.

Comparison of DMET proteins expressed in HepG2, Upcyte, and HepaRG cells with cPHHs s. Volcano plots of HepG2, Upcyte, and HepaRG cells versus cPHHs indicating statistical significance (−log10 p-value) versus log2 fold change for CYP450, 28 major phase II drug metabolizing enzymes and phase III transporter proteins.
Because it is known that metabolic activation to a chemically reactive species underlies the toxicology of some drugs, such as paracetamol, and that this process most commonly proceeds via a CYP450-mediated mechanism (Antoine et al., 2008; McGill and Jaeschke, 2013), expression of this group of enzymes was specifically compared across the 3 cell lines relative to the cPHH. Figure 5A shows the log2 fold change in expression of the 15 CYP450 enzymes identified in the HepG2, Upcyte, and HepaRG cells compared with cPHH. In general, there is lower CYP450 protein expression in the HepG2, Upcyte, and HepaRG cells compared with the cPHH, a decrease which is less pronounced in the HepaRG cells. Furthermore, CYP3A4 was observed to be highly abundant in the HepaRG cells compared with cPHH, which is consistent with previous reports showing that the expression of CYP3A4 following the differentiation of HepaRG cells exceeded that of other CYP450 isoforms and was ∼2.5-fold higher than the basal expression in fresh PHH (Aninat et al., 2006; Guillouzo, et al., 2007).
FIG. 5.

Comparison of log2 fold changes of expression in individual CYP450, phase II metabolizing enzymes and phase III transport protein expression in HepG2, Upcyte, and HepaRG cells relative to cPHHs. Error bars have been omitted for clarity. For a full list of error values and Phase II enzymes please refer to Supplementary Tables S2–S4. Proteins labeled with an asterisk (*) indicates major drug transport proteins identified by The International Transporter Consortium.
The expression of phase II enzymes in each of the cell lines relative to cPHH including 9 glutathione S-transferase (GST) and 11 uridine diphosphate glucuronosyltransferase (UDPGT) proteins are shown in Figure 5B. In general, there is low expression of GST and UDPGT proteins in the HepG2, Upcyte, and HepaRG cells compared with cPHH, but less decrease in the HepaRG cells. However, there are also exceptions to this trend including a higher abundance of GSTA1, GSTT1, GSTO1, UDPGT 1-6, 1-9, and 2A3 proteins in the HepaRG cells compared with cPHH. Interestingly, higher levels of GSTM3 were observed in the HepG2 and Upcyte cells but not in the HepaRG cells relative to cPHH, as is also the case with the phase II enzyme N-acetyltransferase 10 (NAT10). Furthermore, sulfotransferase 1A3/1A4 (SULT1A3/1A4) and to a lesser extent, thiopurine S-methyltransferase (TPMT) were also more highly expressed in the HepG2 cells but not in the Upcyte and HepaRG cells relative to cPHH.
The International Transporter Consortium has proposed 18 drug transport proteins in hepatocytes for evaluation during drug development (Hillgren et al., 2013), some of which were identified across the 4 cell models assessed in this study and are highlighted in Figure 5C. The abundance of these proteins was generally lower in the HepG2, Upcyte, and HepaRG cells compared with cPHH, but to a lesser degree in the HepaRG cells. Interestingly, MRP1 protein level was higher in the HepG2, Upcyte, and HepaRG cells as well as MRP3 and P-gp in the HepaRG cells compared with cPHH.
To confirm our proteomic results, Western blot analysis was performed on several DMET proteins that were identified in all the 3 cell lines as well as in each of the 3 cPHH donors (Fig. 6). Overall, the expression profile of CYP1A2, 2D6, 2E1, and 3A4 as well as GSTP1 and UDPGT 1A1 in the HepG2, Upcyte, and HepaRG cells relative to each of the cPHH donors, as detected by Western blot and mass spectrometry, were in agreement.
FIG. 6.
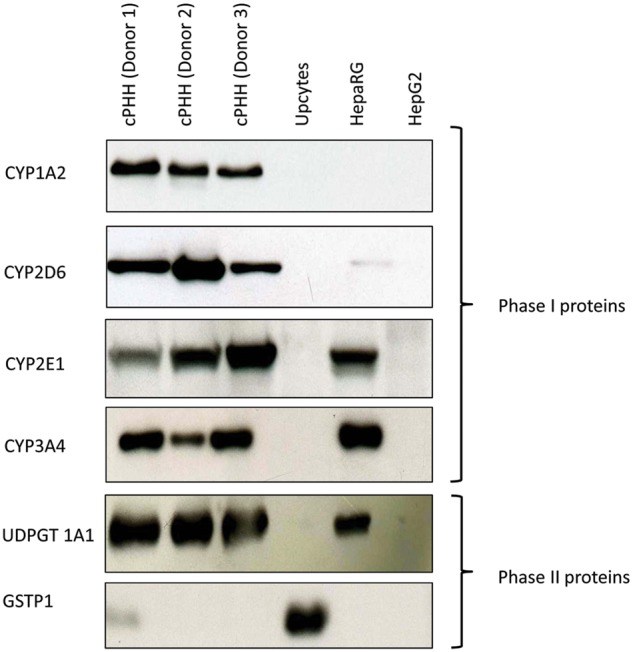
Western blot of phase I and phase II proteins in cPHHs, Upcyte, HepaRG, and HepG2 cells. Phase I CYP450 1A2, 2D6, 2E1, and 3A4 as well as phase II UDPGT 1A1 and GSTP1 Western blots were performed and used as a secondary technique to confirm our LC-MS/MS proteomic data.
Expression of Cytoprotective (Nrf2-Regulated) Proteins in HepG2, Upcyte, and HepaRG Cells Relative to cPHH
An important determinant of cytotoxicity is the ability of a cell to defend itself against toxic insults, either through detoxification of electrophilic and oxidative species, or through the expression of antioxidants such as peroxiredoxins and glutathione. The Nrf2/Keap1 signaling pathway is a key regulator of the constitutive and inducible expression of a range of proteins linked to cell defence against electrophiles and oxidative stress (Copple et al., 2010). This includes some phase II detoxification enzymes and antioxidant proteins, such as those involved in glutathione synthesis. Due to the significance of the Nrf2/Keap1 signaling pathway during cell defence, a list of consensus human Nrf2-regulated proteins from our proteomic data was compiled based on in-house and literature data (Supplementary Table S5; Jung et al., 2013; Walsh et al., 2014), from which the expression profile of these identified human Nrf2-regulated proteins were analyzed. Figure 7A represents volcano plots of the total proteome, highlighting the significance and magnitude of change in the expression of Nrf2-associated proteins in the HepG2, Upcyte, and HepaRG cells relative to cPHH. In general, the majority of these proteins have lower expression in the HepG2 and Upcyte cells but also with a few that were more highly expressed relative to cPHH. On the other hand, there is generally an equal distribution of Nrf2-associated proteins that were either lower or higher in abundance in the HepaRG2 cells compared with cPHH which is further highlighted in Figure 7B. Interestingly, there are more Nrf2-regulated proteins that were more highly expressed in the 2 cancer-derived cell lines, HepG2 and HepaRG cells relative to cPHH than in the Upcyte cells which were derived from fresh primary hepatocytes.
FIG. 7.

Nrf2-regulated protein expression in HepG2, Upcyte, and HepaRG cells relative to cPHHs. The above analyses were performed according to a list of consensus human Nrf2-regulated proteins that was compiled based on in-house and literature data (Copple et al., 2010; Jung et al., 2013).
DISCUSSION
Human liver-derived immortalized cell lines are routinely used within a drug development context as an aid to safety assessment and for candidate selection decision making. A survey of European Federation of Pharmaceutical Industries and Associations (EFPIA) partners in the MIP-DILI consortium indicated that all partners use HepG2 cells at some stage within their preclinical safety assessment program (results not shown). Thus, there is a need for well-characterized, proliferative cell lines of liver origin, since the availability of alternative primary cells, such as human hepatocytes, is limited and suffers from inconsistency across donors and instability with respect to DMET expression (Fraczek et al., 2013). cPHHs are more readily available and have the advantages of good intra-donor batch-to-batch reproducibility and metabolic characterization prior to use. However, cPHH are expensive and still suffer from inter-donor variability. Recently, developments within the field have delivered 2 novel cell models as potential replacements for the traditional cell lines, such as HepG2, and possibly a valid alternative to primary human hepatocytes: HepaRG and Upcyte cells. HepaRG cells were derived from a patient with hepatocellular carcinoma (Gripon et al., 2002). They are proliferative progenitor cells that can be differentiated into either hepatocyte or biliary cell lineages, depending on the culture conditions employed (Parent et al., 2004). Furthermore, once differentiated into hepatocyte-like cells, they are reported to express useful levels of CYP450 and other DMET proteins and are thus potentially suited to toxicological drug screening (Aninat et al., 2006). Upcyte hepatocytes are primary human hepatocytes that have been transfected with viral vectors carrying ‘proliferating genes’ to a proprietary specification (Upcyte technology; Burkard et al., 2012). Thus they are not equivalent to a conventional cell line as their life span is ‘extended’ rather than immortal (Burkard et al., 2012). Nevertheless, they have the advantage that cells can be derived on a large scale from multiple donors, thereby allowing inter-individual variability to be considered as a factor during safety assessment. As with HepaRG cells, they are reported to express useful levels of DMETs and it is estimated that they resemble 4–5 day cultured fresh human hepatocytes in this respect (Burkard et al., 2012). To date, there has been no comprehensive genomic or proteomic analysis performed on the Upcyte cells, with the exception of this study.
Due to the deficiencies inherent to all single cell models in their ability to predict human DILI, many attempts to develop more complex models have been initiated, including multi-cell systems incorporating endothelial or immune cells, single or multi-cell spheroids, hollow fibre or scaffold-supported 3D-cultures and sophisticated ‘bioreactor’ models which may be single or multi-cellular in nature (Bale et al., 2014; Bhushan et al., 2013). All of these, however, are still reliant on a hepatocyte or hepatocyte-like cell at their core and the selection of the most appropriate ‘hepatocyte’ may be even more critical for the development of these models than for simpler systems, since physiologically appropriate cell–cell communication and contact is likely to underlie the faithful development of a liver-like architecture. As part of the remit of the MIP-DILI consortium, this study was undertaken to provide a comprehensive characterization of candidate hepatocyte cells in order to aid this selection process. Although this study does not represent an exhaustive assessment of all available cell models—for example stem cell-derived hepatocyte-like cells were not included in the analysis—the cells selected did represent a cross section of the different cell types that are currently commonly used within EFPIA drug safety programs. It was also not the intention of the consortium to ‘rate’ the different cell models; rather, our aim was to provide an objective global assessment of their total proteomes and in particular their DMET specific proteomes, as a knowledge base from which investigators could determine the most appropriate cell type for a specific purpose. It should also be noted that, by necessity, there were small differences in the conditions under which the different cell types were cultured. Culture conditions have been optimized for each line either in-house or by the commercial providers of the cells and it was deemed important to analyze the cells under conditions typically applied. It is thus possible that differences in culturing methodologies may impact on the levels of protein expression in the different lines; however, this was not specifically investigated in this study.
The study reported here provides relative quantification of 2722 proteins measured across each of the 3 proliferative cell models, and allows comparison of the equivalent protein within a primary human hepatocyte. Because fresh human hepatocytes are rarely used within a routine safety testing environment, we chose cryopreserved cells as the comparator. To date, very few similar proteomic studies have been reported in the literature comparing the global hepatic proteomes of liver cell systems. In agreement with the findings described here, the work of Rowe et al., (2013) also showed differences between the hepatic proteomes of cPHH and HepG2 cells. In addition, several microarray studies indicate that the gene expression profile in the HepaRG cells was more comparable with cPHH, as well as liver tissue, than HepG2 cells (Gerets et al., 2012; Hart et al., 2010; Jennen et al., 2010). Nonetheless, caution needs to be taken when extrapolating transcriptomic data to protein expression at the single gene level: a phenomenon that is now well-recognized in the field (Schwanhausser et al., 2011).
With respect to DMET expression, none of the 3 cell lines was equivalent to cPHH across the whole range of common DMET proteins identified in the study. In general, the CYP450 were mostly considerably under-expressed in all 3 cell lines—a result that is not that surprising given the rapidity with which expression of CYP450 disappears even in freshly isolated hepatocytes. There were some notable exceptions to this however (see Table 3 for a summary of DMET expression in the different cell lines relative to cPHH). As was seen with phase I metabolizing enzymes, most of the transporters analyzed also showed a lower expression in HepG2, Upcyte, and HepaRG cells than in the cPHH. However, the extent of the difference was not as dramatic as seen with most CYP450s and there were some notable exceptions to the general trend. For example, MRP1 was highly expressed in HepG2, HepaRG and Upcyte cells and the transporter proteins P-gp and MRP3 were also highly abundant in the HepaRG cells.
TABLE 3.
Expression of key DMETs in HepG2, Upcyte, and HepaRG Cells Relative to cPHHs
| HepG2 |
Upcyte |
HepaRG |
||||
|---|---|---|---|---|---|---|
| Protein | Equivalent (±50%) | Overexpressed (>150%) | Equivalent (±50%) | Overexpressed (>150%) | Equivalent (±50%) | Overexpressed (>150%) |
| CYP450s | CYP20A | CYP20A | CYP3A4 | |||
| CYP3A5 | ||||||
| CYP4FB | ||||||
| Phase II enzymes | GSTM3 | NAT10 | GSTM3 | GSTA1 | GSTO1 | |
| GSTT1 | ST1A3 | NAT10 | GSTK1 | UD1-6 | ||
| TPMT | GSTT1 | |||||
| MGST3 | ||||||
| NAT10 | ||||||
| TPMT | ||||||
| UD1-9 | ||||||
| UD2A3 | ||||||
| Transporters | ABCF3 | ABCE1 | ABCF3 | ABCE1 | ABCBA | ABCF1 |
| MDR1 | ABCF1 | MDR1 | ABCF1 | ABCB7 | ABCF2 | |
| MRP1 | ABCF2 | MRP1 | ABCF2 | ABCE1 | MRP3 | |
| GTR1 | GTR1 | ABCF3 | MDR1 | |||
| MRP1 | ||||||
| MRP2 | ||||||
| GTR1 | ||||||
| Nrf2 target proteins | AK1C3 | 6PGD | GSH0F | 6PGD | AK1A1 | 6PGD |
| GSH1 | AK1BA | EST1 | ALDR | ALDR | AL3A1 | |
| GSH0 | ALDR | TRXR1 | FRIH | ST2A1 | AK1BA | |
| EST1 | G6PD | G6PD | EST2 | AK1C2 | ||
| GSHR | FRIH | AK1C3 | ||||
| NQO1 | GPX1 | G6PD | ||||
| PRDX1 | EST1 | GSH1 | ||||
| PRDX2 | SODC | GSH0 | ||||
| THIO | SODM | GSHR | ||||
| PRDX1 | ||||||
| PRDX2 | ||||||
| PRDX6 | ||||||
| THIO | ||||||
| TRXR1 | ||||||
Proteins that are expressed at a similar level (expression is within 50% of cPHH, either up or down regulated) or overexpressed (>150% of cPHH levels) are indicated by the gene code.
With respect to cellular defence, a set of proteins regulated by the transcription factor Nrf2 was defined and expression across the panel compared between the cell types. Interestingly, the average expression across this set of Nrf2-regulated proteins was much higher in the 2 cancer-derived cells lines, HepG2 (2.3-fold higher than cPHH) and HepaRG (6.6-fold higher) whereas in Upcyte cells, which are a modified primary cell, the average expression was about half that seen in the cPHH. Indeed, it has been found that up-regulation of Nrf2 in tumors is a relatively common phenotypic change that can be caused by somatic mutations both within the Nrf2-binding domains themselves, as well as in the Keap1 inhibitor molecule (Ganan-Gomez et al., 2013; Ohta et al., 2008; Shibata et al., 2008). NQO1 expression, widely used as a surrogate marker of Nrf2 activity was 35-fold higher in HepG2 cells than in primary hepatocytes.
In summary, therefore, none of the 3 cell lines was comparable to cryopreserved primary cells cultured under standard conditions with respect to CYP450 expression, and thus the use of these cells for assessing drug bioactivation or reactive metabolite formation is unlikely to yield toxicologically relevant data. HepaRG cells do express good levels of CYP3A4, however other key P450s associated with toxic metabolite formation (eg, CYP1A2, CYP2C9, and CYP2E1) were expressed at relatively low levels. In contrast, all 3 of the cell lines expressed useful levels of some phase II enzymes. Both HepG2 and Upcyte cells expressed the major glutathione transferase, GSTM3, at levels commensurate with primary cells, and thus may have value for studying GSH conjugation. HepaRG cells showed a strong Phase II expression profile, with multiple GSTs (though interestingly not GSTM3) expressed at cPHH equivalent levels, along with some UDP-GTs. Transport protein expression was also well represented across the cell lines, and for studies involving specific transporters the cell lines may have a useful role, obviating the need for primary cells. Similarly, several Nrf2 regulated proteins were expressed at cPHH cell levels—some considerably overexpressed—confirming the value of such cell models for assessing cellular adaption to xenobiotic-induced stress through the antioxidant pathway.
IPA identified mitochondrial dysfunction as the biological process most significantly associated with proteins that are lower in expression in the HepG2, Upcyte, and HepaRG cells compared with cPHH (Table 2). This is consistent with the manner in which these cells are maintained in culture where glucose rich medium is routinely used. As a consequence, these cells generate their energy through glycolysis rather than oxidative phosphorylation (the Crabtree effect [Golshani-Hebroni and Bessman, 1997; Rodriguez-Enriquez et al., 2001]) and thus mitochondrial protein expression may fall as a consequence. This demonstrates the significant role of the mitochondria in maintaining the hepatic phenotype of liver in vitro models.
It is generally acknowledged that a single cell-type 2D model is unlikely to recapitulate the complexity of xenobiotic-induced liver injury and considerable research efforts are now directed towards the development of more sophisticated liver models, such as multi-cell, 3D and liver on chip systems. The ability of hepatocytes in culture to coalesce into spheroids has been exploited by several investigators. For example, the hanging drop system developed by InSphero has been adapted for use with both single and multi-cell formats of primary or cancer-derived hepatocytes, producing microtissues of a few thousand cells. The use of hanging drop spheroids for the culture of HepG2 and HepaRG cells has been reported to enhance P450 mRNA expression and inducibility compared with simple 2D cultures, and the benchmark values reported here for these cell types will be of value in assessing the enhanced phenotype at the protein level (Takahashi et al., 2015). Proteomic analysis of acetaminophen-treated hanging drop hepatocyte spheroids recently led to the discovery of novel mitochondrial protein adducts, indicating that bioactivation to NAPQI can occur in this model (Bruderer et al., 2015). Micropatterened culture platforms have also been reported to extend the maintenance of functionality of primary hepatocytes. Co-culture of human hepatocytes and fibroblasts on such micropatterned plates (Hepatopac system) have shown good ability to predict clearance of a panel of test compounds (Chan et al., 2013), and the inclusion of Kupffer cells of the innate immune system allows the model to begin to address mechanisms of idiosyncratic DILI (Nguyen et al., 2015). These, and other innovative liver models such as Organovo’s 3D bioprinted systems and perfused microtitre plate cultures (Domansky et al., 2010), all share the same requirement for a human-derived hepatic cell at their core. The choice of such cells for a given application is likely to be dictated by the fundamental phenotypic characteristics of the various primary or immortalized hepatocytes available and a comprehensive knowledge of the protein expression profiles of each cell model, as provided here, is an important resource to inform this selection. In conclusion, there is currently no ideal in vitro equivalent to the primary human hepatocyte for drug safety testing. It is also probable that fresh human hepatocytes themselves are already deficient in much DMET function by the time they have become stable enough to be used reproducibly in culture, meaning that data obtained from immortalized cell lines resemble even less that which would pertain within the context of an intact human liver. Nevertheless, there is an urgent need for stable, reproducible cell lines to replace primary cells for the development of the next generation of in vitro liver models: A clear requisite for new multi-cellular systems under development is the stable expression of pharmacological phenotype akin to that which exists in the human liver in order to evaluate the consequences of drug bioactivation and/or accumulation with confidence. The data presented here will serve as a useful resource in determining whether a particular liver-derived cell type is appropriate for a given purpose.
SUPPLEMENTARY DATA
Supplementary data are available online at http://toxsci.oxfordjournals.org/.
FUNDING
This work was supported by the MIP-DILI project, a European Community grant under the Innovative Medicines Initiative (IMI) Program [115336].
Supplementary Material
ACKNOWLEDGMENTS
The authors of this article are members of the |Innovative Medicines Initiative MIP-DILI (Mechanism based Integrated systems for the Prediction of Drug Induced Liver Injury) Consortium.
Glossary
ABBREVIATIONS
- ACN
acetonitrile
- cPHH
cryopreserved primary human hepatocytes
- CYP450
cytochrome P450
- DILI
drug-induced liver injury
- DMEM
dulbecco's modified eagle’s medium
- DMET
drug metabolizing enzymes and transporter proteins
- ECACC
European Collection of Cell Cultures
- EDTA
ethylenediaminetetraacetic acid
- EFPIA
European Federation of Pharmaceutical Industries and Associations
- eIF2
eukaryotic initiation factor 2
- eIF4
eukaryotic initiation factor 4
- FBS
fetal bovine serum
- FCS
fetal calf serum
- FDR
false discovery rate
- GST
glutatione S-transferase
- HMGI-C
high-mobility-group IC
- iTRAQ
isobaric tag for relative and absolute quantitation
- KCl
potassium chloride
- KH2PO4
potassium phosphate
- KLC-SM
KaLy-Cell seeding medium
- KLC-TM
KaLy-Cell thawing medium
- KLC-WM
KaLy-Cell washing medium
- MeOH
methanol
- MIP-DILI
Mechanism-based Integrated Systems for the Prediction of Drug-induced Liver Injury
- MMTS
s-methyl methanethiosulfonate
- MOPS-SDS
3-(N-morpholino) propane sulfonic acid-sodium dodecyl sulfate
- MRP
multidrug resistance-associated protein
- MS
mass spectrometry
- mTOR
mammalian target of rapamycin
- NEAA
non-essential amino acid
- NQO1
NAD(P)H dehydrogenase quinone 1
- Nrf2
nuclear factor (erythroid-derived 2)-like 2
- P-gp
P-glycoprotein
- SULT, 1A3/1A4
sulfotransferase 1A3/1A4
- TBST
tris-Buffered Saline/Tween 20
- TCEP
tris-(2-carboxyethyl) phosphine
- TEAB
triethylammonium bicarbonate
- TPMT
thiopurine S-methyltransferase
- UDPGT
uridine diphospho-glucuronosyltransferase
REFERENCES
- Aninat C., Piton A., Glaise D., Le Charpentier T., Langouet S., Morel F., Guguen-Guillouzo C., Guillouzo A. (2006). Expression of cytochromes P450, conjugating enzymes and nuclear receptors in human hepatoma HepaRG cells. Drug Metab. Dispos. 34, 75–83. [DOI] [PubMed] [Google Scholar]
- Antoine D. J., Williams D. P., Park B. K. (2008). Understanding the role of reactive metabolites in drug-induced hepatotoxicity: State of the science. Expert Opin. Drug Metab. Toxicol. 4, 1415–1427. [DOI] [PubMed] [Google Scholar]
- Bale S. S., Vernetti L., Senutovitch N., Jindal R., Hegde M., Gough A., McCarty W. J., Bakan A., Bhushan A., Shun T. Y., et al. (2014). In vitro platforms for evaluating liver toxicity. Exp. Biol. Med. 239, 1180–1191. [DOI] [PMC free article] [PubMed] [Google Scholar]
- Bhushan A., Senutovitch N., Bale S. S., McCarty W. J., Hegde M., Jindal R., Golberg I., Berk Usta O., Yarmush M. L., Vernetti L., et al. (2013). Towards a three-dimensional microfluidic liver platform for predicting drug efficacy and toxicity in humans. Stem Cell Res. Ther. 4(Suppl. 1), S16. [DOI] [PMC free article] [PubMed] [Google Scholar]
- Bradford M. M. (1976). A rapid and sensitive method for the quantitation of microgram quantities of protein utilizing the principle of protein-dye binding. Anal. Biochem. 72, 248–254. [DOI] [PubMed] [Google Scholar]
- Bruderer R., Bernhardt O. M., Gandhi T., Miladinovic S. M., Cheng L. Y., Messner S., Ehrenberger T., Zanotelli V., Butscheid Y., Escher C., et al. (2015). Extending the limits of quantitative proteome profiling with data-independent acquisition and application to acetaminophen-treated three-dimensional liver microtissues. Mol. Cell Proteomics 14, 1400–1410. [DOI] [PMC free article] [PubMed] [Google Scholar]
- Burkard A., Dahn C., Heinz S., Zutavern A., Sonntag-Buck V., Maltman D., Przyborski S., Hewitt N. J., Braspenning J. (2012). Generation of proliferating human hepatocytes using Upcyte(R) technology: Characterisation and applications in induction and cytotoxicity assays. Xenobiotica 42, 939–956. [DOI] [PubMed] [Google Scholar]
- Chan T. S., Yu H., Moore A., Khetani S. R., Tweedie D. (2013). Meeting the challenge of predicting hepatic clearance of compounds slowly metabolized by cytochrome P450 using a novel hepatocyte model, HepatoPac. Drug Metab. Dispos. 41, 2024–2032. [DOI] [PubMed] [Google Scholar]
- Chen M., Bisgin H., Tong L., Hong H., Fang H., Borlak J., Tong W. (2014). Toward predictive models for drug-induced liver injury in humans: Are we there yet? Biomark. Med. 8, 201–213. [DOI] [PubMed] [Google Scholar]
- Copple I. M., Goldring C. E., Kitteringham N. R., Park B. K. (2010). The keap1-nrf2 cellular defense pathway: Mechanisms of regulation and role in protection against drug-induced toxicity. Handb. Exp. Pharmacol., 233–266. [DOI] [PubMed] [Google Scholar]
- Domansky K., Inman W., Serdy J., Dash A., Lim M. H., Griffith L. G. (2010). Perfused multiwell plate for 3D liver tissue engineering. Lab. Chip 10, 51–58. [DOI] [PMC free article] [PubMed] [Google Scholar]
- Fraczek J., Bolleyn J., Vanhaecke T., Rogiers V., Vinken M. (2013). Primary hepatocyte cultures for pharmaco-toxicological studies: At the busy crossroad of various anti-dedifferentiation strategies. Arch. Toxicol. 87, 577–610. [DOI] [PubMed] [Google Scholar]
- Ganan-Gomez I., Wei Y., Yang H., Boyano-Adanez M. C., Garcia-Manero G. (2013). Oncogenic functions of the transcription factor Nrf2. Free Radic. Biol. Med. 65, 750–764. [DOI] [PubMed] [Google Scholar]
- Gerets H. H., Tilmant K., Gerin B., Chanteux H., Depelchin B. O., Dhalluin S., Atienzar F. A. (2012). Characterization of primary human hepatocytes, HepG2 cells, and HepaRG cells at the mRNA level and CYP activity in response to inducers and their predictivity for the detection of human hepatotoxins. Cell Biol. Toxicol. 28, 69–87. [DOI] [PMC free article] [PubMed] [Google Scholar]
- Golshani-Hebroni S. G., Bessman S. P. (1997). Hexokinase binding to mitochondria: A basis for proliferative energy metabolism. J. Bioenerg. Biomembr. 29, 331–338. [DOI] [PubMed] [Google Scholar]
- Gripon P., Rumin S., Urban S., Le Seyec J., Glaise D., Cannie I., Guyomard C., Lucas J., Trepo C., Guguen-Guillouzo C. (2002). Infection of a human hepatoma cell line by hepatitis B virus. Proc. Natl. Acad. Sci. USA 99, 15655–15660. [DOI] [PMC free article] [PubMed] [Google Scholar]
- Guillouzo A., Corlu A., Aninat C., Glaise D., Morel F., Guguen-Guillouzo C. (2007). The human hepatoma HepaRG cells: A highly differentiated model for studies of liver metabolism and toxicity of xenobiotics. Chem. Biol. Interact. 168, 66–73. [DOI] [PubMed] [Google Scholar]
- Hart S. N., Li Y., Nakamoto K., Subileau E. A., Steen D., Zhong X. B. (2010). A comparison of whole genome gene expression profiles of HepaRG cells and HepG2 cells to primary human hepatocytes and human liver tissues. Drug Metab. Dispos. 38, 988–994. [DOI] [PMC free article] [PubMed] [Google Scholar]
- Hillgren K. M., Keppler D., Zur A. A., Giacomini K. M., Stieger B., Cass C. E., Zhang L., International Transporter C. (2013). Emerging transporters of clinical importance: An update from the International Transporter Consortium. Clin. Pharmacol. Ther. 94, 52–63. [DOI] [PubMed] [Google Scholar]
- Jennen D. G., Magkoufopoulou C., Ketelslegers H. B., van Herwijnen M. H., Kleinjans J. C., van Delft J. H. (2010). Comparison of HepG2 and HepaRG by whole-genome gene expression analysis for the purpose of chemical hazard identification. Toxicol. Sci. 115, 66–79. [DOI] [PubMed] [Google Scholar]
- Ji C., Tschantz W. R., Pfeifer N. D., Ullah M., Sadagopan N. (2012). Development of a multiplex UPLC-MRM MS method for quantification of human membrane transport proteins OATP1B1, OATP1B3 and OATP2B1 in in vitro systems and tissues. Anal. Chim. Acta. 717, 67–76. [DOI] [PubMed] [Google Scholar]
- Jung K. A., Choi B. H., Nam C. W., Song M., Kim S. T., Lee J. Y., Kwak M. K. (2013). Identification of aldo-keto reductases as NRF2-target marker genes in human cells. Toxicol. Lett. 218, 39–49. [DOI] [PubMed] [Google Scholar]
- McGill M. R., Jaeschke H. (2013). Metabolism and disposition of acetaminophen: Recent advances in relation to hepatotoxicity and diagnosis. Pharm. Res. 30, 2174–2187. [DOI] [PMC free article] [PubMed] [Google Scholar]
- Nguyen T. V., Ukairo O., Khetani S. R., McVay M., Kanchagar C., Seghezzi W., Ayanoglu G., Irrechukwu O., Evers R. (2015). Establishment of a hepatocyte-kupffer cell coculture model for assessment of proinflammatory cytokine effects on metabolizing enzymes and drug transporters. Drug Metab. Dispos. 43, 774–785. [DOI] [PubMed] [Google Scholar]
- Ohta T., Iijima K., Miyamoto M., Nakahara I., Tanaka H., Ohtsuji M., Suzuki T., Kobayashi A., Yokota J., Sakiyama T., et al. (2008). Loss of Keap1 function activates Nrf2 and provides advantages for lung cancer cell growth. Cancer Res. 68, 1303–1309. [DOI] [PubMed] [Google Scholar]
- Ohtsuki S., Schaefer O., Kawakami H., Inoue T., Liehner S., Saito A., Ishiguro N., Kishimoto W., Ludwig-Schwellinger E., Ebner T., et al. (2012). Simultaneous absolute protein quantification of transporters, cytochromes P450, and UDP-glucuronosyltransferases as a novel approach for the characterization of individual human liver: Comparison with mRNA levels and activities. Drug Metab. Dispos. 40, 83–92. [DOI] [PubMed] [Google Scholar]
- Olson H., Betton G., Robinson D., Thomas K., Monro A., Kolaja G., Lilly P., Sanders J., Sipes G., Bracken W., et al. (2000). Concordance of the toxicity of pharmaceuticals in humans and in animals. Regul. Toxicol. Pharmacol. 32, 56–67. [DOI] [PubMed] [Google Scholar]
- Parent R., Marion M. J., Furio L., Trepo C., Petit M. A. (2004). Origin and characterization of a human bipotent liver progenitor cell line. Gastroenterology 126, 1147–1156. [DOI] [PubMed] [Google Scholar]
- Rodriguez-Enriquez S., Juarez O., Rodriguez-Zavala J. S., Moreno-Sanchez R. (2001). Multisite control of the Crabtree effect in ascites hepatoma cells. Eur. J. Biochem. 268, 2512–2519. [DOI] [PubMed] [Google Scholar]
- Rowe C., Gerrard D. T., Jenkins R., Berry A., Durkin K., Sundstrom L., Goldring C. E., Park B. K., Kitteringham N. R., Hanley K. P., et al. (2013). Proteome-wide analyses of human hepatocytes during differentiation and dedifferentiation. Hepatology 58, 799–809. [DOI] [PMC free article] [PubMed] [Google Scholar]
- Schaefer O., Ohtsuki S., Kawakami H., Inoue T., Liehner S., Saito A., Sakamoto A., Ishiguro N., Matsumaru T., Terasaki T., Ebner T. (2012). Absolute quantification and differential expression of drug transporters, cytochrome P450 enzymes, and UDP-glucuronosyltransferases in cultured primary human hepatocytes. Drug Metab. Dispos. 40, 93–103. [DOI] [PubMed] [Google Scholar]
- Schwanhausser B., Busse D., Li N., Dittmar G., Schuchhardt J., Wolf J., Chen W., Selbach M. (2011). Global quantification of mammalian gene expression control. Nature 473, 337–342. [DOI] [PubMed] [Google Scholar]
- Shibata T., Ohta T., Tong K. I., Kokubu A., Odogawa R., Tsuta K., Asamura H., Yamamoto M., Hirohashi S. (2008). Cancer related mutations in NRF2 impair its recognition by Keap1-Cul3 E3 ligase and promote malignancy. Proc. Natl. Acad. Sci. USA 105, 13568–13573. [DOI] [PMC free article] [PubMed] [Google Scholar]
- Stephenne X., Najimi M., Ngoc D. K., Smets F., Hue L., Guigas B., Sokal E. M. (2007). Cryopreservation of human hepatocytes alters the mitochondrial respiratory chain complex 1. Cell Transplant. 16, 409–419. [DOI] [PubMed] [Google Scholar]
- Stephenne X., Najimi M., Sokal E. M. (2010). Hepatocyte cryopreservation: Is it time to change the strategy? World J . Gastroenterol. 16, 1–14. [DOI] [PMC free article] [PubMed] [Google Scholar]
- Takahashi Y., Hori Y., Yamamoto T., Urashima T., Ohara Y., Tanaka H. (2015). Three-dimensional (3D) spheroid cultures improve the metabolic gene expression profiles of HepaRG cells. Biosci. Rep. 2015 May 7;35(3). pii: e00208. doi: 10.1042/BSR20150034. [DOI] [PMC free article] [PubMed] [Google Scholar]
- Walsh J., Jenkins R. E., Wong M., Olayanju A., Powell H., Copple I., O’Neill P. M., Goldring C. E., Kitteringham N. R., Park B. K. (2014). Identification and quantification of the basal and inducible Nrf2-dependent proteomes in mouse liver: Biochemical, pharmacological and toxicological implications. J. Proteomics 108, 171–187. [DOI] [PMC free article] [PubMed] [Google Scholar]
- Xu B., Gao S., Wu B., Yin T., Hu M. (2014). Absolute quantification of UGT1A1 in various tissues and cell lines using isotope label-free UPLC-MS/MS method determines its turnover number and correlates with its glucuronidation activities. J. Pharm. Biomed. Anal. 88, 180–190. [DOI] [PMC free article] [PubMed] [Google Scholar]
- Xu J. J., Diaz D., O’Brien P. J. (2004). Applications of cytotoxicity assays and pre-lethal mechanistic assays for assessment of human hepatotoxicity potential. Chem. Biol. Interact. 150, 115–128. [DOI] [PubMed] [Google Scholar]
Associated Data
This section collects any data citations, data availability statements, or supplementary materials included in this article.