Abstract
Optical microresonators1 which confine light within a small cavity are widely exploited for various applications ranging from the realization of lasers2 and nonlinear devices3, 4, 5 to biochemical and optomechanical sensing6, 7, 8, 9, 10, 11. Here we employ microresonators and suitable optical gain materials inside biological cells to demonstrate various optical functions in vitro including lasing. We explored two distinct types of microresonators: soft and hard, that support whispering-gallery modes (WGM). Soft droplets formed by injecting oil or using natural lipid droplets support intracellular laser action. The laser spectra from oil-droplet microlasers can chart cytoplasmic internal stress (~500 pN/μm2) and its dynamic fluctuations at a sensitivity of 20 pN/μm2 (20 Pa). In a second form, WGMs within phagocytized polystyrene beads of different sizes enable individual tagging of thousands of cells easily and, in principle, a much larger number by multiplexing with different dyes.
Luminescent probes including fluorescent dyes and proteins, quantum dots, bioluminescent molecules, and plasmonic nanoparticles have become indispensable tools in the fields of cell biology and medical sciences. While these molecular probes are immensely useful, their relatively broad emission spectra, typically in the range of 30 to 100 nm, limit the number of probes simultaneously usable without ambiguity, and often make their spectra indistinguishable from broad background emission of endogenous molecules in tissues. It is fundamentally challenging to engineer molecules with much narrower spontaneous emission12. However, photonic principles, such as optical resonance and stimulated emission, allow spectral narrowing (filtering) via successive coherent loss or gain. Generation of narrowband resonant emission from biological cells have been demonstrated by cellular lasers using external cavities13, 14 or photonic crystal needles15. Recently, we have sought to generate stand-alone cell lasers16, and herein describe effective approaches based on intracellular whispering-gallery mode (WGM) micro-resonators formed by soft and hard polymeric materials. WGMs are formed when light is circulating in a transparent spherical object by being trapped due to total internal reflection at the interface. WGM cavities can have sizes at the micro- and nano-scale17 although they are much larger than the conventional luminescent probes.
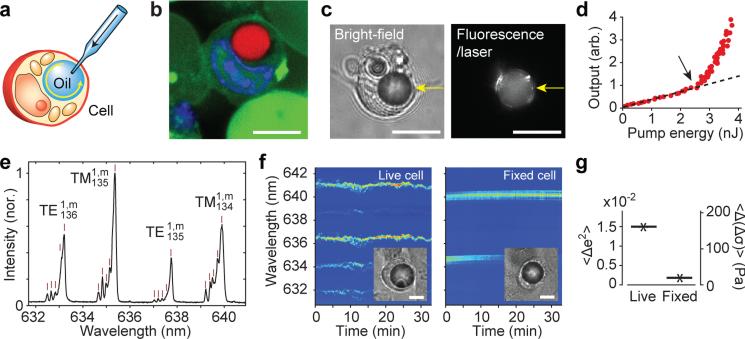
We first describe soft WGM cavities in the form of oil droplets in cells. We injected nile red dye-mixed polyphenyl ether (PPE), a chemically inert optical grade fluid with low viscosity (100 cP) and a refractive index (n) of 1.69 (Fig. 1a). The size of the droplets was controlled18 in a range of 4 to 20 μm, corresponding to a volume of 30 fL to 4000 fL (Supplementary Video 1 and Fig. 1b). Droplets larger than 7 μm show lasing upon pulsed excitation (λ=535 nm, 5 ns, 10 Hz) with thresholds as low as a few nanojoules per pulse (Fig. 1c-d). This energy level is non-harmful for the cell13, 14. The instantaneous heating of a droplet is calculated to be <1 °C, and the ambient temperature increase in the cytosol is negligible (see Supplementary Information). When the droplet is under uniaxial stress, its shape deviates from a sphere, and the deformation is manifested in the emission spectrum as splitting of laser lines (Fig. 1e). For small deformation, the shape can be approximated as a spheroid, which supports laser oscillation in the equatorial plane, which has the lowest curvature and, therefore, minimum optical loss. The modes are fitted to a model, and the equatorial and polar semi-axes, a and b, respectively, are determined (see Supplementary Information). From Laplace's law, the flattening stress, Δσ, is related to the local mean curvature of droplet surface19: Δσ = 2γ ΔH is surface tension and ΔH is the difference in the curvature (see Supplementary Information). For small eccentricity (e), i.e. e2<<1, the stress is approximated as:
| (1) |
For the droplet in Fig. 1e, we measure a=8.5 μm and b=8.3 μm; and with γ ≈ 45 mN/m for oil/water interface, we determine Δσ = 500 pN/μm2. Time-lapse traces of the output spectra revealed dynamic variations of the cellular stress in live cells (Fig. 1f). The mean fluctuation of the internal stress was measured to be ~0.15 nN/μm2 (Fig. 1g). From the baseline fluctuation in dead cells (<Δe2>=0.19%), the force sensitivity is ~20 pN/μm2 (20 Pa), which is an order of magnitude better than direct image-based analysis19.
Figure 1. Injected oil droplet laser.
a, Illustration of the injection of oil into the cytoplasm of a cell. b, Confocal fluorescence image of a cell with a PPE droplet doped with nile red dye (red). The cell nucleus (blue) became a kidney-shaped form, giving space to the droplet. c, Bright-field (left) and laser-output (right) images of a cell with a droplet (arrow) above the lasing threshold. d, Output light intensity from a droplet as a function of pump pulse energy, showing a distinct laser threshold (arrow). Dotted line, linear fit to the fluorescence output below the threshold. e, A typical output spectrum of the lasing modes. All the modes are first radial modes, two modes with TE and two with TM polarization. Each mode is split into multiple submodes. From their splitting in this data, the spheroid is determined to be of oblate shape with equatorial and polar semi-axes 8.3 and 8.5 μm respectively. f, Time-lapse variation of the output spectrum for a live cell (left) and a dead cell fixed with formaldehyde (right). g, Standard deviation of the square of eccentricity and corresponding internal stress for live and fixed (dead) cells. Scale bars, 10 μm in b-c and f.
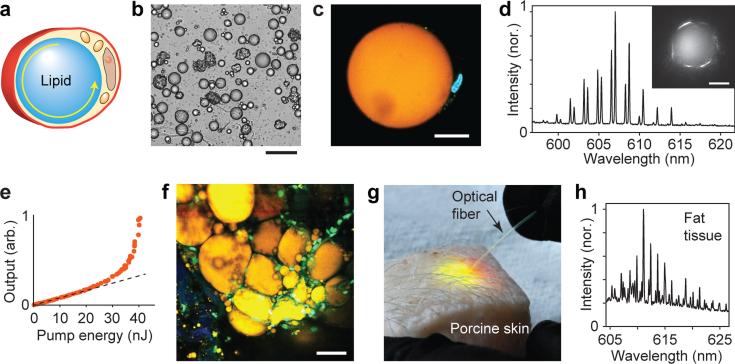
We next explored if cells naturally containing lipid droplets (n=1.47) can support laser oscillation (Fig. 2a). Adipocytes freshly extracted from porcine subcutaneous tissue contain a single lipid droplet with nearly perfect spherical geometry (Fig. 2b-c). After incubation with a lipophilic fluorescent dye and pumping with a pulsed laser, the cells exhibited lasing with WGM outputs (Fig. 2d) and distinct threshold (Fig. 2e). This represents a completely natural intracellular optical cavity. Next, we investigated the possibility of generating lasing from adipocytes in situ in tissues. Adipocytes in fat are closely packed and have random shapes (Fig. 2f), which have lower cavity Q-factor and require higher pump energy for lasing. To lower threshold, we injected a mixture of collagenase and lipophilic nile red dye into the subcutaneous fat. The collagenase releases adipocytes from the tissue matrix, so that they acquire spherical shapes20. An optical fibre was inserted through a needle puncture hole to excite the adipocytes with pulsed laser light and to collect the light emitted from the tissue (Fig. 2g). The adipocytes near the fibre tip readily showed lasing (Fig. 2h). In some cases also adipocytes at the rim of fat tissue that had more round shape showed lasing (Supplementary Fig. 1) eliminating the need of collagenase.
Figure 2. Adipocyte lasers.
a, Illustration of a typical mature subcutaneous adipocyte with a lipid droplet. b, Individual adipocytes extracted from subcutaneous porcine fat. c, A confocal image of an adipocyte containing a large lipid droplet (orange), occupying the majority of the cell volume. The nucleus (blue) is visible next to the droplet. Scale bar, 20 μm. d, Spectrum from a 45 μm adipocyte above lasing threshold, showing typical WGM spectral peaks. Inset, a fluorescence image of the cell above lasing threshold. e, Output energy as a function of the pump energy. Dotted line, linear fit to the fluorescence output below the laser threshold. f, Two-photon confocal image of adipocytes in situ in a subcutaneous fat tissue, after intradermal injection of nile red dye (yellow). g, Generating cellular laser emission from within tissue. The pump is fibre-optically into the subcutaneous fat layer after injecting a mixture of collagenase and nile red dye. h, The spectrum of light collected by the optical fibre from the tissue. Scale bars, 200 μm in b, 20 μm in c, d and f.
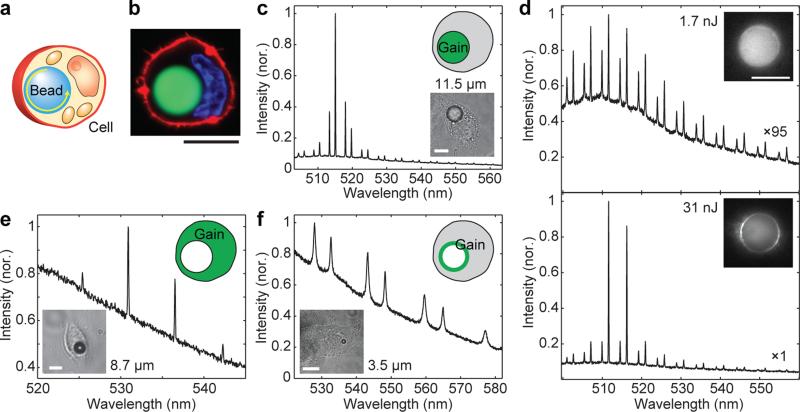
Solid microspheres, such as polystyrene microspheres, offer a simple way to devise non-deformable, intracellular lasers (Fig. 3a). Polystyrene beads are readily internalized by endocytosis 21, 22 (Fig. 3b). We have observed that both macrophages and non-phagocytic cells, such as HeLa and NIH3T3, engulf beads up to 20 μm in diameter (d), large enough to exhibit lasing at low pump energy. Viability of HeLa cells 24h after they engulfed one or more polystyrene beads (>6 μm) was 98.4% ± 0.6%, compared to 99.4% ± 0.2% for cells without beads. WGM lasers offer multiple options for the position of the gain medium, including inside the resonator, outside the resonator, and on the surface of the bead. We tested these three cases. First, fluorescent dye-embedded polystyrene beads provided gain within the beads. Beads larger than d=11 μm supported lasing inside cells at pump energy levels below a few nanojoules (Fig. 3c and d, Supplementary Fig. 2). The bead surface can be functionalized with probe molecules, such as antibodies or deoxyribonucleic acid (DNA), for intracellular molecular sensing6, 7, 8, 9, 10, 11. Second, a cell tracker dye, 5-chloromethylfluorescein diacetate (CMFDA), retained in the cytosol served as the gain medium for BaTiO3 beads. Lasing down to 8 μm BaTiO3 beads was observed (Fig. 3e). The gain medium interacts freely with the cell, generating amplified signals modulated by the cavity resonance. Thirdly, the surface of high-index (n=1.9) BaTiO3 beads was coated with fluorescent dye (Alexa Fluor 488). Although a monolayer of dye did not provide enough gain for lasing, its emission spectrum is strongly modulated by high-Q (700) resonance in beads down to d=3.5 μm, with relatively low fluorescence background (Fig. 3f). Any combinations of the three gain locations are of course possible. Furthermore, the gain and sensing media may be collocated or separated.
Figure 3. Three different types of solid intracellular microcavities.
a, Illustration of a bead inside a cell. b, Confocal fluorescence image of a HeLa cell containing a polystyrene bead (green), nucleus (blue) and plasma membrane (red). c, Laser emission from a fluorescent polystyrene bead inside a cell. d, Emission spectra and images (insets) of a fluorescent polystyrene bead below and above lasing threshold (3.2 nJ). e, Laser output from a 8.7 μm non-fluorescent BaTiO3 bead embedded in a cell that contains CMFDA dye in its cytoplasm. f, Spontaneous emission from a 3.5 μm BaTiO3 bead coated with Alexa 488 dye below laser threshold. Scale bars, 10 μm.
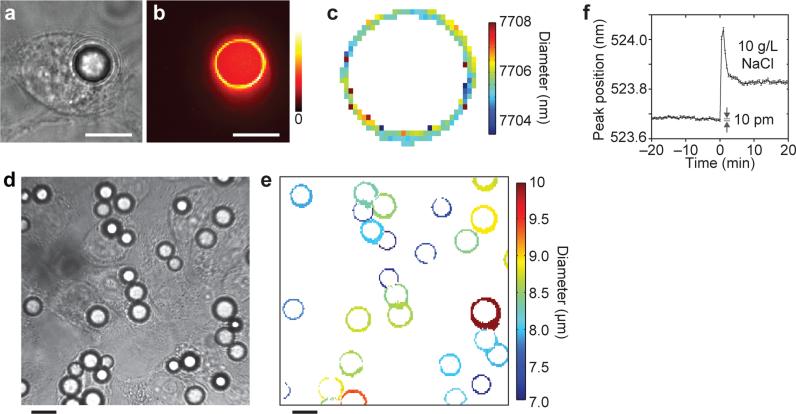
The precise wavelengths of the multiple spectral peaks from a bead above or below lasing threshold (Fig. 3) are uniquely determined from the size of the bead. We measured the output spectra from fluorescent polystyrene beads from each spatial location in a mid-plane of the cell (Fig. 4a) in a confocal hyperspectral imaging setup with numerical aperture of 1.25 and continuous-wave pumping with a 455-nm light emitting diode (LED). The spatial map of the intensity of resonance peaks shows a ring shape (Fig. 4b), representing light circulating in the bead and leaking out in the tangential direction. By fitting the spectra with WGM mode theory23, the effective bead diameter (d) was calculated at each pixel. The diameter around circumference varies by 1-2 nm, which may reflect the deviation of the actual bead from a perfect sphere (Fig. 4c). The precision of the mean diameter is about 50 pm (Supplementary Fig. 3), which represents a remarkable sensitivity of WGM analysis (50 pm / 7.7 μm = 6.5×10⁻⁶). The same type of analysis can be done for beads operated above threshold by pulsed pumping. However, when the number of lasing modes is less than 3-4, the size measurement is frustrated or has an error as much as 1-2 free spectral ranges (~100 nm) (Supplementary Fig. 4).
Figure 4. Tagging and sensing applications of solid intracellular microcavities.
a, Bright field image of a HeLa cell containing a polystyrene fluorescent bead. b, False colour image of the cell, representing intensity of the oscillating WGMs. c, A bead diameter map calculated from confocal hyperspectral images of the WGM output. d, Multiple HeLa cells containing beads and e, the corresponding bead diameter map. f, Time-lapse measurement of a resonant peak from a glass bead inside a HeLa cell. The addition of 2 g/L of sodium chloride at t=0 caused the peak wavelength to shift. Scale bars, 10 μm.
An intriguing application of this precision measurement is to use beads with different diameters to tag individual cells (Fig. 4d-e, Supplementary Fig. 5, and Supplementary Video 2). The diameter interval between beads should be large enough to accommodate the typical wavelength variation of 2 nm due to refractive index changes by intracellular dynamics (Δλ/λ ≈ Δn/ n + Δd/d), where n is effective refractive index for the oscillating mode). With polydispersed beads in a range from 8 to 12 μm and a bin size of 2 nm, we can distinguish 2,000 individual beads. By using different fluorescent dyes with distinct emission bands this number can be increased easily by several folds. Furthermore, each cell can engulf multiple particles (Supplementary Fig. 6b). Using three beads per cell and 5 different fluorescence dyes with non-overlapping spectra, it would be possible to individually tag 2000×5C3 = 2×10¹¹ cells, which is comparable to the number of entire cells in the human body and many orders of magnitude more than state-of-the-art techniques such as stochastic brainbow recombination24 for in vivo cell tracking, as well as high-throughput on-chip cytometry and cell-based analysis.
To demonstrate intracellular sensing, we measured the spectral changes of Alexa Fluor 488 coated soda lime glass beads in HeLa cells while the cell culture media was supplied with an additional 2 g/L of sodium chloride. Exposure of cells to hypertonic solution causes intracellular water to quickly diffuse out of the cell, reducing the cell volume. The shrinking is followed by a partial recovery by regulatory volume increase25. The change in cell volume changes the concentration of the molecules in the cytoplasm therefore also changing the refractive index. The time dependence of the shift in the position of a WGM (Fig. 4f) corresponds to Δn ≈ 1.0×10⁻², which is close to the calculated value of 7.6×10⁻³ from Boyle-van't Hoff law (see Supplementary Information). As a control experiment, adding the same volume of media without changing the osmolarity produces no response (Supplementary Fig. 7).
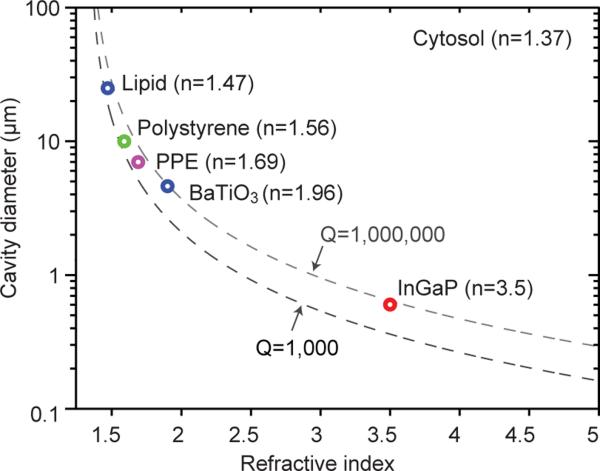
Here we have demonstrated stand-alone cell lasers by employing an intracellular WGM microresonator, dye gain medium, and far-field optical pumping with nanosecond pulses. Pulse duration of 100 ps could reduce threshold pump energy (by ~50 times) while supporting distinct WGM modes in microresonators. The shape of intracellular WGM cavities is not limited to spheres. Cylinders, torus and disks can also be used. The micrometre size may offer flexibility in cavity engineering for specific mode selection or direction-dependent radiation26. Biodegradable polymers27 may improve biocompatibility. Smaller cavities causing minimal perturbations on cells would also be useful. This requires high refractive index materials (Fig. 5). Semiconductor materials (n>3) should enable sub-micron WGM lasers28. Realization of metamaterials with extremely high refractive index29 could also enable sub-micron lasers. Plasmon-based spasers can be as small as tens of nanometres30, but WGM analysis demonstrated here are most effective with microresonators accommodating multiple optical wavelengths.
Figure 5. Size of intracellular microlasers.
Q-factors of WGMs are highly dependent on the refractive index and cavity size. The two dashed lines represent theoretical calculation of two Q-factors of 106 and 103, respectively. The circles represent the measured minimum size of laser achieved inside a cell for lipid droplet in an adipocyte, polystyrene bead and PPE droplet inside a HeLa cell, and BaTiO3 beads in 15 mM Pyrromethene solution, as well as InGaP disc lasers in the air28.
Methods
Optical setup
For the pumping of the cell lasers and the collection of light, a 40× 1.25 NA or a 100× 1.40 NA oil immersion objective was used. The pumping was achieved using an optical parametric oscillator with 5 ns pulse duration, tuned to 475 nm for green dyes or 535 nm for red dyes. The laser beam was slightly divergent at the objective entrance pupil, so that the focus at the sample was located slightly further away from the objective focal plane; the beam diameter at the objective focal plane was approximately 20 μm wide. For measurements of polystyrene microsphere modes below laser threshold (Fig. 4), a 455 nm LED was used as an excitation source. The collected light was sent through a dichroic mirror and split 50:50 to CCD camera and imaging spectrometer (300 mm focal length, 0.05 nm resolution). For all the measurements except for hyperspectral imaging, the spectrum was collected through the entrance slit of the spectrometer and therefore represents an integration along a line crossing the centre of a bead or droplet. For hyperspectral imaging the spectrometer slit was replaced by a 10-μm pinhole, and a 2D raster scan was performed with 0.1 s per pixel acquisition time. The spectral peaks above a broad fluorescence background were integrated to get the laser intensity image shown in Fig. 4b. The individual spectral peaks after subtracting the background were fitted with a Lorentzian curve to get their central wavelengths, which were subsequently fitted to equation (1), with a = b.
Cell culture
HeLa, NIH3T3 and RAW 264.7 cell lines were grown at 37°C with 5% CO2 in full growth medium (Dulbecco's Modified Eagle Medium supplemented with 10% fetal bovine serum and 1% pen-strep). The cells were incubated in full growth medium supplied with beads for 12 h before laser experiments. The viability assay was performed 24 h after the cells were injected with PPE or they were supplied with beads using ethidium homodimer-1.
Oil injection
Non-toxic, low-viscosity high-index polyphenyl ether oil (PPE, SL-5267, Santolubes) was doped with 5 mM nile red (9-diethylamino-5-benzo[α]phenoxazinone) prior to its injection into HeLa and NIH3T3 cells. The injection was performed using a microinjector (FemtoJet, Eppendorf) and a glass micropipette with 1.0 μm outer diameter (Femtotip, Eppendorf). The size of the injected droplets was controlled by the injection time ranging from 0.2 s to 1 s, with an injecting pressure of 1700 kPa.
Adipocytes
Fresh subcutaneous fat tissue was collected from the neck of a two-month old pig, minced and mixed with equal volume of phosphate buffered saline (PBS) supplied with 2 mg/mL collagenase (type 1A). The mixture was incubated with frequent shaking at 37 °C for 30 min. The suspension was filtered through 250 μm nylon mesh to remove undigested tissue and centrifuged at 65 g for 5 min to collect top layer of fat. The adipocytes were stained by adding 1% of 10 mM nile red in acetone. In the tissue laser experiments, 1 mL of PBS containing 1 mg/mL collagenase and 1% of 10 mM nile red in acetone was injected in the subcutaneous porcine fat. The tissue was incubated at 37 °C for 15 min. For excitation and light collection a multimode fiber with core diameter 200 μm was used.
Fluorescent beads
Three different bead types were used: 8 μm mean diameter green fluorescent polystyrene spheres (Thermo Scientific, Fluoro-Max, 18% coefficient of variation), 15-19 μm soda lime glass beads (Cospheric), and polydisperse BaTiO3 beads with a broad size distribution of 1-40 μm (GL0175B, Mo-Sci). Polystyrene beads were incubated for 30 min at room temperature in 1 wt% poly-L-lysine hydrobromide (MW 30,000-70,000) in water and washed three times. Soda lime and BaTiO3 spheres were coated with Alexa Fluor 488 tetrafluorophenyl (TFP) ester dye (Life Technologies) as follows. Beads were washed with acetone and incubated in acetone containing 2% v/v 3-aminopropyltriethoxysilane for 15 min with mixing. The beads were washed two times with acetone, one time with water and dried at 120 °C for 30 min. The beads were re-dispersed in 0.1 M sodium bicarbonate buffer, pH 9.0. 100 μg of Alexa Fluor TFP ester dissolved in 10 μL dimethyl sulfoxide was added to 200 μL of bead dispersion in the sodium bicarbonate buffer. After 2 h incubation, the beads were washed five times with water and transferred to phosphate buffered saline. All the above washing steps were performed by centrifugation at 5000 g for 5 min and exchange of the medium.
Supplementary Material
Acknowledgements
This research was supported in part by the U.S. National Science Foundation (ECCS-1101947, EEC-1358296, ECCS-1505569) and National Institutes of Health (P41 EB015903). M.H. was supported in part by the Marie Curie International Outgoing Fellowship N° 627274 within the 7th European Community Framework Programme. The authors thank Jie Zhao and Wellman Centre Photopathology Core for technical support. Part of this work was performed at the Centre for Nanoscale Systems (CNS) in Harvard University, which is a member of the National Nanotechnology Infrastructure Network (NNIN) and supported by the National Science Foundation under NSF award no. ECS-0335765.
Footnotes
Author Contributions
M.H. and S.H.Y. designed the study. M.H. carried out the experiments and analysed the data. M.H. and S.H.Y. wrote the manuscript.
Supplementary information is available in the online version of the paper.
Competing financial interests
The authors declare no competing financial interests.
References and Notes
- 1.Vahala KJ. Optical microcavities. Nature. 2003;424:839–846. doi: 10.1038/nature01939. [DOI] [PubMed] [Google Scholar]
- 2.Qian SX, Snow JB, Tzeng HM, Chang RK. Lasing droplets - highlighting the liquid-air interface by laser-emission. Science. 1986;231:486–488. doi: 10.1126/science.231.4737.486. [DOI] [PubMed] [Google Scholar]
- 3.Hill MT, et al. A fast low-power optical memory based on coupled micro-ring lasers. Nature. 2004;432:206–209. doi: 10.1038/nature03045. [DOI] [PubMed] [Google Scholar]
- 4.Kippenberg TJ, Holzwarth R, Diddams SA. Microresonator-based optical frequency combs. Science. 2011;332:555–559. doi: 10.1126/science.1193968. [DOI] [PubMed] [Google Scholar]
- 5.Spillane SM, Kippenberg TJ, Vahala KJ. Ultralow-threshold Raman laser using a spherical dielectric microcavity. Nature. 2002;415:621–623. doi: 10.1038/415621a. [DOI] [PubMed] [Google Scholar]
- 6.Armani AM, Kulkarni RP, Fraser SE, Flagan RC, Vahala KJ. Label-free, single-molecule detection with optical microcavities. Science. 2007;317:783–787. doi: 10.1126/science.1145002. [DOI] [PubMed] [Google Scholar]
- 7.Vollmer F, Arnold S. Whispering-gallery-mode biosensing: label-free detection down to single molecules. Nat. Methods. 2008;5:591–596. doi: 10.1038/nmeth.1221. [DOI] [PubMed] [Google Scholar]
- 8.Zhu JG, et al. On-chip single nanoparticle detection and sizing by mode splitting in an ultrahigh-Q microresonator. Nat. Photonics. 2010;4:46–49. [Google Scholar]
- 9.Fan XD, White IM. Optofluidic microsystems for chemical and biological analysis. Nat. Photonics. 2011;5:591–597. doi: 10.1038/nphoton.2011.206. [DOI] [PMC free article] [PubMed] [Google Scholar]
- 10.Baaske MD, Foreman MR, Vollmer F. Single-molecule nucleic acid interactions monitored on a label-free microcavity biosensor platform. Nat. Nanotechnol. 2014;9:933–939. doi: 10.1038/nnano.2014.180. [DOI] [PubMed] [Google Scholar]
- 11.Himmelhaus M, Francois A. In-vitro sensing of biomechanical forces in live cells by a whispering gallery mode biosensor. Biosens. Bioelectron. 2009;25:418–427. doi: 10.1016/j.bios.2009.07.021. [DOI] [PubMed] [Google Scholar]
- 12.Zhang J, Campbell RE, Ting AY, Tsien RY. Creating new fluorescent probes for cell biology. Nat. Rev. Mol. Cell Biol. 2002;3:906–918. doi: 10.1038/nrm976. [DOI] [PubMed] [Google Scholar]
- 13.Gather MC, Yun SH. Single-cell biological lasers. Nat. Photonics. 2011;5:406–410. [Google Scholar]
- 14.Jonáš A, et al. In vitro and in vivo biolasing of fluorescent proteins suspended in liquid microdroplet cavities. Lab. Chip. 2014;14:3093–3100. doi: 10.1039/c4lc00485j. [DOI] [PubMed] [Google Scholar]
- 15.Shambat G, et al. Single-cell photonic nanocavity probes. Nano Lett. 2013;13:4999–5005. doi: 10.1021/nl304602d. [DOI] [PMC free article] [PubMed] [Google Scholar]
- 16.Fan X, Yun S-H. The potential of optofluidic biolasers. Nat. Methods. 2014;11:141–147. doi: 10.1038/nmeth.2805. [DOI] [PMC free article] [PubMed] [Google Scholar]
- 17.Hill MT, Gather MC. Advances in small lasers. Nat. Photonics. 2014;8:908–918. [Google Scholar]
- 18.Zhang Y, Yu LC. Microinjection as a tool of mechanical delivery. Curr. Opin. Biotechnol. 2008;19:506–510. doi: 10.1016/j.copbio.2008.07.005. [DOI] [PubMed] [Google Scholar]
- 19.Campàs O, et al. Quantifying cell-generated mechanical forces within living embryonic tissues. Nat. Methods. 2014;11:183–189. doi: 10.1038/nmeth.2761. [DOI] [PMC free article] [PubMed] [Google Scholar]
- 20.Gardan D, Gondret F, Louveau I. Lipid metabolism and secretory function of porcine intramuscular adipocytes compared with subcutaneous and perirenal adipocytes. Am. J. Physiol. Endocrinol. Metabol. 2006;291:E372–E380. doi: 10.1152/ajpendo.00482.2005. [DOI] [PubMed] [Google Scholar]
- 21.Cannon GJ, Swanson JA. The macrophage capacity for phagocytosis. J. Cell Sci. 1992;101:907–913. doi: 10.1242/jcs.101.4.907. [DOI] [PubMed] [Google Scholar]
- 22.Kobayashi S, et al. Artificial induction of autophagy around polystyrene beads in nonphagocytic cells. Autophagy. 2010;6:36–45. doi: 10.4161/auto.6.1.10324. [DOI] [PubMed] [Google Scholar]
- 23.Gorodetsky ML, Fomin AE. Geometrical theory of whispering-gallery modes. IEEE J. Sel. Topics Quantum Electron. 2006;12:33–39. [Google Scholar]
- 24.Livet J, et al. Transgenic strategies for combinatorial expression of fluorescent proteins in the nervous system. Nature. 2007;450:56–62. doi: 10.1038/nature06293. [DOI] [PubMed] [Google Scholar]
- 25.Schultz SG. Molecular biology of membrane transport disorders. Springer; 1996. [Google Scholar]
- 26.Wang QJ, et al. Whispering-gallery mode resonators for highly unidirectional laser action. Proc. Natl. Acad. Sci. U. S. A. 2010;107:22407–22412. doi: 10.1073/pnas.1015386107. [DOI] [PMC free article] [PubMed] [Google Scholar]
- 27.Nizamoglu S, Gather MC, Yun SH. All-biomaterial laser using vitamin and biopolymers. Adv. Mater. 2013;25:5943–5947. doi: 10.1002/adma201300818. [DOI] [PubMed] [Google Scholar]
- 28.Zhang Z, et al. Visible submicron microdisk lasers. Appl. Phys. Lett. 2007;90:111119–111119-111113. [Google Scholar]
- 29.Choi M, et al. A terahertz metamaterial with unnaturally high refractive index. Nature. 2011;470:369–373. doi: 10.1038/nature09776. [DOI] [PubMed] [Google Scholar]
- 30.Stockman MI. Spasers explained. Nat. Photonics. 2008;2:327–329. [Google Scholar]
Associated Data
This section collects any data citations, data availability statements, or supplementary materials included in this article.


