

Abstract
The capture of circulating tumor cells (CTCs) from cancer patient blood enables early clinical assessment as well as genetic and pharmacological evaluation of cancer and metastasis. Although there have been many microfluidic immunocapture and electrokinetic techniques developed for isolating rare cancer cells, these techniques are often limited by a capture performance tradeoff between high efficiency and high purity. We present the characterization of shear-dependent cancer cell capture in a novel hybrid dielectrophoresis (DEP)-immunocapture system consisting of interdigitated electrodes fabricated in a Hele-Shaw flow cell that was functionalized with a monoclonal antibody, J591, which is highly specific to prostate-specific membrane antigen (PSMA)-expressing prostate cancer cells. We measured the positive and negative DEP response of a prostate cancer cell line, LNCaP, as a function of applied electric field frequency, and showed that DEP can control capture performance by promoting or preventing cell interactions with immunocapture surfaces, depending on the sign and magnitude of the applied DEP force, as well as on the local shear stress experienced by cells flowing in the device. This work demonstrates that DEP and immunocapture techniques can work synergistically to improve cell capture performance, and it will aid in the design of future hybrid DEP-immunocapture systems for high-efficiency CTC capture with enhanced purity.
Keywords: circulating tumor cell, dielectrophoresis, immunocapture, microfluidic, prostate cancer
1 Introduction
Circulating tumor cells (CTCs) are cells that have been shed into the circulatory system from a tumor source, and are believed to contribute to cancer metastasis [1, 2]. The enumeration of CTCs isolated from cancer patient blood samples can serve as a prognostic indicator of cancer and predictor of patient survival [3–6]. In addition, genetic and pharmacological evaluation of CTCs can lead to a better understanding of cancer metastasis as well as improved drug therapies [7–11]. However, CTCs are rare—as few as one cell per 108 blood cells [12, 13]. The only system for detecting CTCs that is approved by the U.S. Food and Drug Administration, CellSearch® (Veridex, LLC), requires immunomagnetic tagging and cell fixation, which inhibits further biological analyses on captured CTCs. Given this drawback, the isolation of viable CTCs from cancer patient blood presents a technical challenge for those who wish to study them.
Researchers have developed a variety of techniques for isolating rare cancer cells from blood [2, 14, 15]. Examples of microfluidic approaches include micropillar arrays [9, 16, 17], chaotic mixers [18, 19], filters [20, 21], and devices with other micro- and nanostructured surfaces [22–26]. Of those techniques that are capable of processing whole blood, immunocapture methods have shown the greatest potential for capturing rare cancer cells with high efficiency (62–95%) [16–19]. Studies that used the epithelial cell-adhesion molecule (EpCAM) to capture lung, prostate, pancreatic, and colorectal CTCs have reported a wide range of capture purities (9–67%) [16, 18, 19]. Our group has combined immunospecificity with optimization of cell adhesion and transport mechanisms to create Geometrically Enhanced Differential Immunocapture (GEDI) [27], and reported a capture purity of 62% with prostate CTCs by use of a monoclonal antibody, J591, that is highly specific to prostate-specific membrane antigen (PSMA) [17]. The main contributing factor to CTC capture impurities is the nonspecific adhesion of leukocytes to immunocapture surfaces. Thus, although immunocapture techniques typically produce high CTC capture efficiencies from whole blood, capture purity can still potentially be improved to facilitate subsequent biological studies on the CTCs.
Whereas microfluidic immunocapture techniques rely on surface immunological interactions to isolate rare cancer cells, electrokinetic techniques such as dielectrophoresis primarily rely on differences in the cell populations’ electrical properties [28]. Dielectrophoresis (DEP) refers to the net migration of polarized particles due to interactions with an electric field gradient, and operates in two regimes: when a particle is more polarizable than its suspending medium, positive DEP occurs and the particle is attracted to stronger field regions; conversely, when a particle is less polarizable than the medium, negative DEP occurs and the particle is repelled from stronger field regions [29, 30]. The sign and magnitude of the DEP force is dictated by the real part of the Clausius-Mossotti factor, which describes the relationship between the electrical properties of the particle and the medium as a function of the applied AC electric field frequency [31]. This relationship forms the basis for the majority of DEP cell separation and isolation techniques [32].
Although numerous microfluidic DEP methods for cancer cell capture in artificial samples exist, there has not been a study that demonstrates DEP capture of viable CTCs from whole blood of cancer patients [14]. A majority of DEP cancer cell isolation techniques use model cancer cell lines spiked in buffer media or diluted blood; such techniques include DEP flow-field fractionation (DEP-FFF) [33–36], insulative and contactless DEP [37–40], and streamline separations using angled electrodes [41–44]. These studies separate cancer cells from other blood constituents based on their differences in DEP response in a specific applied frequency range. This binary separation mechanism makes DEP an attractive tool for cell separation, as DEP requires no biochemical treatment or labeling to achieve high capture efficiency and purity. However, to date, studies using DEP methods for CTC capture have only reported high capture performance for model cancer cell lines spiked in preprocessed blood with concentrations ranging from one cancer cell per 104–106 blood cells [33, 34, 36, 39, 40, 42, 44]. The commercially licensed ApoStream™ (ApoCell) system, which uses DEP-FFF, has reported capture efficiencies in the range of 50–80% for ovarian and breast cancer cell lines spiked in peripheral blood mononuclear cells (PBMCs) with concentrations as low as one cancer cell per 106 blood cells, but noted that efficiency decreased after running samples through the system multiple times to increase capture purity [35]. DEP capture performance has also been shown to decrease drastically with concentrations lower than one cancer cell per 106 blood cells [33]. Thus, although the use of DEP methods often produces high purities for cell separation, their application for CTC capture from whole blood is currently limited by low throughput and efficiency.
Given that DEP and immunocapture techniques both have unique advantages as well as areas for improvement, the development of a platform capable of high capture efficiency and purity could be facilitated by incorporating both methods [14]. In this study, we characterized the performance of a hybrid DEP-immunocapture system by quantifying cell adhesion to immunocapture surfaces as a function of the local shear stress experienced by cells. This characterization of the shear-dependence of immunocapture was performed in a Hele-Shaw flow cell using a prostate cancer cell line, LNCaP, and the monoclonal antibody, J591, which is highly specific to PSMA [45, 46]. We show that, depending on the applied electric field frequency, DEP effects can control the capture performance of prostate cancer cells by attracting them to or repelling them from immunocapture surfaces. To our knowledge, this is the first reported study of a hybrid DEP-immunocapture characterization system for cancer cell capture, and our results inform the design of future hybrid DEP-immunocapture devices for high-purity CTC isolation.
2 Materials and methods
2.1 Hele-Shaw flow cell design
To optimize a microfluidic immunocapture system, the flow conditions that affect cell capture performance must be characterized. Such characterization is often difficult or expensive to perform in typical immunocapture devices, given their 3D topologies, cost of fabrication, and sample processing time. A Hele-Shaw flow cell, depicted in Figure 1, was designed to facilitate the analysis of flow conditions, specifically shear stress, and its effect on the immunocapture of LNCaPs. The device exhibits Stokes flow owing to its small channel depth and attendant low Reynolds number. As the device’s width and length are large, its velocity field is approximately equivalent to a solution of a 2D irrotational, incompressible stagnation point flow [47].
Figure 1.
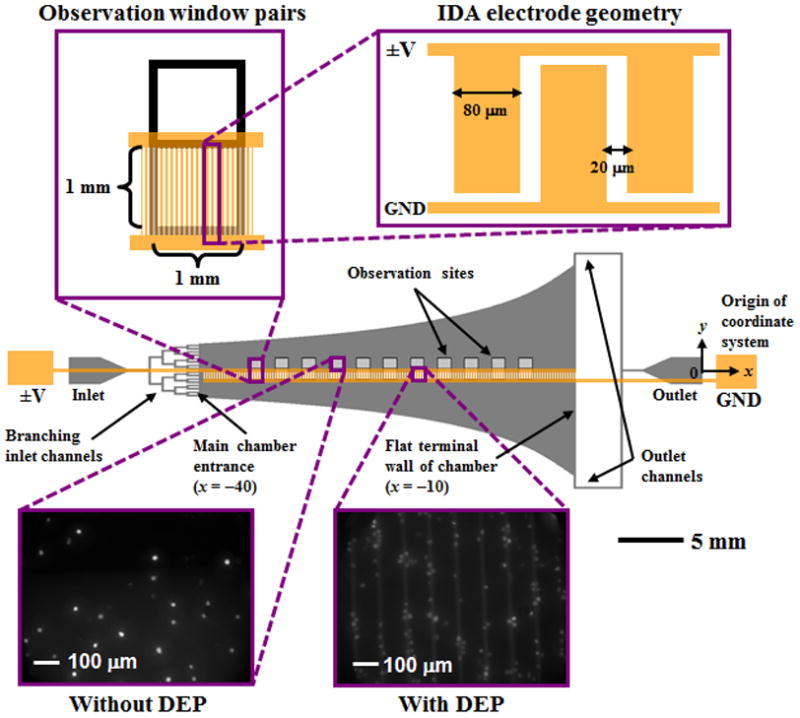
Schematic of the Hele-Shaw flow cell and its interdigitated array (IDA) electrodes with lead connections to an applied voltage (±V) and ground (GND). Inset images show details of the IDA electrode geometry and fluorescently labeled LNCaPs captured with and without DEP effects on the immunocapture surface immobilized with the antibody J591 at various observation sites (corresponding to a range of shear stresses). Captured cells in each pair of observation windows were enumerated and compared at all observation sites. The main chamber was 30 mm long, with an initial width of w0=5 mm at its entrance and a flat wall at its terminal end. The channel height was 48 μm, and the branching inlet and outlet channels were 156 μm wide. The width, w, at any x along the curved channel was w=−(40 mm)w0/x, given a coordinate system with an origin 40 mm to the right of the main chamber entrance. The shear stress in the main chamber ranged from 0 to 0.029 Pa, as shown in Figure 2.
Our Hele-Shaw flow cell is similar to but refined relative to previous designs [46–49]. The device geometry includes sidewalls that are sections of rectangular hyperbolas [47], which replicate the far field of a stagnation flow impinging on the coordinate origin of the hyperbolas. However, because the outlet boundaries of such a stagnation flow are impractical to implement, we use two point outlets [48] and terminate the hyperbolas 10 mm from their coordinate origin (Figure 1). On the device’s central axis, this flow asymptotes to a different stagnation flow, one whose coordinate origin is at the flat terminal wall. This geometry leads to a bilinear variation in shear stress along the length of the device’s central axis. Figure 2 shows this variation in shear stress as a function of distance from the entrance to the device’s main chamber (i.e., the output of the branching inlet channels).
Figure 2.
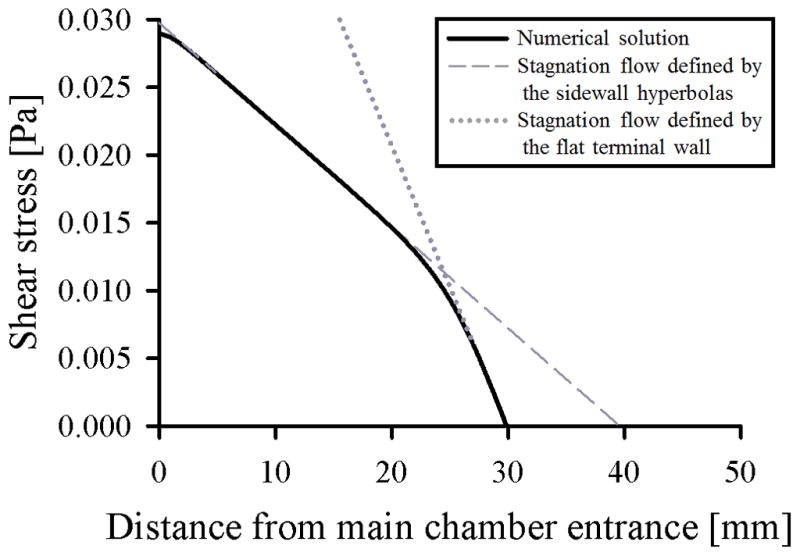
Shear stress at the immunocapture surface of the Hele-Shaw flow cell’s central axis as a function of distance from the entrance to the main chamber (solid line). 2D variation in shear stress was calculated from a 2D potential flow simulation using COMSOL Multiphysics®, and a Poiseuille distribution was assumed in the height coordinate. The bilinear variation in shear stress results from the transition between (1) a stagnation flow defined by the sidewall hyperbolas with a theoretical stagnation point 40 mm from the main chamber entrance (dashed line), and (2) a stagnation flow defined by the flat terminal wall with a stagnation point 30 mm from the main chamber entrance (dotted line), as depicted in Figure 1.
The Hele-Shaw flow cell allows for characterization of cell adhesion as a function of shear stresses corresponding to those experienced by cells in immunocapture devices [9, 46, 49]. To compare immunocapture performance of LNCaPs with and without DEP effects, interdigitated array (IDA) electrodes were fabricated along the length of the Hele-Shaw flow cell on only one side of its central axis (Figure 1). Branching inlet channels into the main chamber entrance ensure that entering cells are uniformly distributed across the chamber width. Approximately half of LNCaPs in the central axis region flow over the IDA electrodes and are affected by a DEP force when the electrodes are energized, whereas the other half of the cell population is unaffected by DEP. In this way, the immunocapture of LNCaPs with and without DEP effects can be directly compared as a function of shear stress.
2.2 Device fabrication
The Hele-Shaw flow cell was fabricated by bonding a channel defined in polydimethylsiloxane (PDMS) to glass. All photolithography and thin-film deposition work was performed at the Cornell NanoScale Science and Technology Facility (CNF). Device masters were fabricated by spin-coating silicon wafers with MicroChem SU-8 2000 to create a film thickness of 48 μm. The photoresist was exposed at 12 mW/cm2 for 40 seconds using an EV620 Contact Aligner on soft-contact mode, then developed in MicroChem SU-8 Developer for 2 minutes and rinsed with acetone, isopropyl alcohol (IPA), and deionized water (DI H2O). The wafers were then coated with 1H,1H,2H,2H-perfluorooctyltrichlorosilane (Sigma-Aldrich) to prevent PDMS adhesion.
IDA electrodes were fabricated using standard lift-off photolithography. Borofloat glass wafers were cleaned with hot piranha solution for 10 minutes and vapor-primed with hexamethyldisilazane (HMDS) for 30 minutes. The wafers were then spin-coated with Microposit S1818 photoresist at 3000 RPM for 30 seconds and baked at 115 °C for 90 seconds. The photoresist was exposed at 12 mW/cm2 for 60 seconds using the EV620 Contact Aligner on soft-contact mode, then developed in Microposit MF-321 for 2 minutes. Wafers were treated with oxygen plasma at 150 W and 80 °C for 60 seconds, then placed in a CVC SC4500 Combination Thermal/Electron-Gun Evaporator. A 250-nm layer of gold was deposited between 20-nm layers of chromium. Lift-off was performed in Microposit Remover 1165 for 12 hours, after which wafers were diced on a K&S 7100 Dicing Saw. The resulting IDA electrode devices were cleaned with Cyantek Nano-Strip for 20 minutes immediately before bonding to PDMS.
PDMS was prepared using a Sylgard® 184 Silicone Elastomer Kit with a 5:1 ratio of elastomer base to curing agent, and baked with the Hele-Shaw device master in an oven at 60 °C for 12 hours. The PDMS was then removed from the master, and inlet and outlet holes were punched with a Harris Uni-Core 1.5-mm biopsy punch. Both the patterned PDMS channel and glass with IDA electrodes were rinsed with acetone, IPA, and DI H2O, dried with an air gun, cleaned in a Harrick Plasma Cleaner for 60 seconds, bonded together, and baked in an oven at 60°C for 12 hours. IDA electrodes were then connected externally to wires with MG Chemicals 8331 Silver Conductive Epoxy, and inlet and outlet ports were connected to Tygon S-54-HL Microbore tubing.
2.3 Antibody functionalization
Immunocapture experiments were conducted with the humanized monoclonal biotinylated antibody J591 (manufactured by Lonza Biologics plc for BZL Biologics Inc.). This antibody has been shown to have high specificity for PSMA [45], and its use in the analysis of immunocapture performance of LNCaPs was characterized over a range of concentrations and shear stresses [46]. Additionally, J591 has been used to demonstrate high-efficiency immunocapture of prostate CTCs from prostate cancer patient blood samples [9, 17]. The glass surface of the Hele-Shaw flow cell was functionalized to immobilize the antibody using MPTMS-GMBS-NeutrAvidin-biotin chemistry following previously reported protocols [17, 46].
2.4 Cell culture maintenance
All experiments were conducted with LNCaPs, an immortalized PSMA-expressing prostate cancer cell line, purchased from the American Type Culture Collection. LNCaPs were cultured in Corning CellBIND T75 culture flasks at 37 °C in a 5% CO2 humidified environment. Cells were cultured in RPMI-1640 supplemented with 10% fetal bovine serum and 1% penicillin-streptomycin (Mediatech). To prepare for experiments, cells were trypsinized from the culture flasks, enumerated in a Hausser Scientific hemacytometer, and resuspended in one of three buffer solutions to a specified cell suspension density (see next section).
2.5 DEP characterization of LNCaPs
The expression for the time-averaged DEP force on a spherical particle in an infinite domain with homogeneous and isotropic complex permittivities is [30, 31]:
| (1) |
| (2) |
where a is the particle radius, E = E0 cos(ωt) is the externally applied AC electric field, ℜ(f̃CM) denotes the real part of the Clausius-Mossotti factor, ω is the angular frequency of the electric field, ε̃ = ε − iσ/ω is the complex permittivity, i = (−1)1/2, ε is the electrical permittivity, σ is the electrical conductivity, and the subscripts p and m denote the particle and the medium, respectively. When ℜ(f̃CM) > 0, positive DEP (pDEP) occurs; conversely, when ℜ(f̃CM) < 0, negative DEP (nDEP) occurs. The frequency at which ℜ(f̃CM) = 0, i.e., when the particle transitions from nDEP to pDEP (or vice versa), is called the “crossover” frequency. In our fabricated devices, the electric field above a pair of IDA electrodes (Figure 1) can be approximated by assuming that the gap between the electrodes is differentially small. The resulting expressions for the electric field and the DEP force on the particle are [50, 51]:
| (3) |
| (4) |
where θ̂ and r̂ are unit vectors in cylindrical coordinates, r is the radial distance from the center of the electrode gap, and V is the applied potential.
The most common DEP approach for isolating cancer cells from blood relies on a binary separation mechanism in which cancer cells and blood cells are actuated in different directions with pDEP and nDEP, respectively, in a specific applied frequency range [33, 35, 39]. To determine what frequency range to use for DEP separation of LNCaPs, we measured their crossover frequency and characterized their DEP response as a function of applied frequency. These experiments used a separate device consisting of IDA electrodes patterned on glass and bonded to a straight channel defined in PDMS with a depth of 50 μm and a width of 250 μm. This device (henceforth referred to as the IDA electrode device) was fabricated using the same protocol for the Hele-Shaw flow cell as described in a previous section, and the IDA electrodes had the same dimensions as detailed in Figure 1. The IDA electrode device was not functionalized with J591, allowing for immediate release of trapped LNCaPs when the electric field was turned off, and for several DEP characterization experiments to be performed serially in the same device.
In characterizing the DEP response of LNCaPs, three different buffer solutions were used: (1) an isotonic sugar in DI H2O solution consisting of 9.5% sucrose, 0.3% dextrose, and 0.1% Pluronic F68 (Sigma-Aldrich) with σm = 0.7 mS/m (similar to that used by other researchers [33, 35]), henceforth referred to as the low-conductivity sugar solution, (2) the same sugar solution with KCl added to produce σm = 70 mS/m, henceforth referred to as the high-conductivity sugar solution, and (3) phosphate buffered saline (PBS) diluted 20 times by volume in the low-conductivity sugar solution also to produce σm = 70 mS/m, henceforth referred to as the diluted PBS solution. To determine the crossover frequency range of LNCaPs, the cells were labeled with Calcein AM dye (Molecular Probes), resuspended in each of the three buffer solutions at a density of 1×10⁶ cells/mL, drawn into a plastic syringe (Becton Dickinson), manually flowed through the IDA electrode device, and visualized on a Nikon LV100 upright microscope. The electrodes were energized by an Agilent 33200A function generator at 6 volts peak-to-peak (Vpp) and frequencies ranging from 10 kHz to 10 MHz. We chose this voltage and frequency range to keep transmembrane loads and cell heating effects minimal, as previously determined by other studies [32]. At each applied frequency, we observed whether the LNCaPs were attracted to (pDEP) or repelled from (nDEP) the electrodes, and determined the frequency range in which the cells were unaffected by the DEP force (i.e., crossover frequency).
We measured the relative magnitude of the pDEP response of LNCaPs as a function of frequency using a previously reported automated DEP characterization process [51]. To summarize, LNCaPs were labeled with Calcein AM, suspended at 1×10⁶ cells/mL in each of the three buffer solutions, and flowed through the IDA electrode device at a rate of 0.2 mL/hr using a Chemyx Fusion 400 syringe pump. Voltages ranging from 2 to 8 Vpp and frequencies ranging from 40 kHz to 10 MHz were applied, and cell trapping on the first five electrodes was visualized on the Nikon LV100 upright microscope and quantified by fluorescence intensity using a custom LabVIEW (National Instruments) interface. A “trapping potential” was extrapolated for each applied frequency using a series of postprocessing analyses in MATLAB (MathWorks). This trapping potential, Vtrap, was defined as the minimum voltage needed to trap a threshold number of cells (as quantified by fluorescence intensity) to be considered a pDEP response, and was related to the magnitude of the DEP force by C0ℜ(f̃CM) = 1/Vtrap2 (following Equation 4), where C0 denotes an arbitrary constant related to the flow rate and electrode geometry [51]. Therefore, we report our DEP characterization data in terms of C0/Vtrap2 as a function of frequency to describe the proportionate DEP response of LNCaPs.
The pDEP characterization data was fit to a function for ℜ(f̃CM) by modeling the LNCaP cell as a single-shelled dielectric sphere. The interaction between the electric field and the cell occurs primarily at the cell membrane, although the physical and electrical properties of the membrane are often difficult to infer from experimental measurments [32]. Therefore, we modeled the electrical properties of the cell in terms of a specific membrane capacitance, Cmembrane, in addition to the cytoplasmic electrical properties [52]. The effective permittivity of the particle, ε̃p, in Equation 2 is then replaced by an effective permittivity for the cell, ε̃cell, that is a function of both Cmembrane and the cytoplasmic permittivity and conductivity [29]:
| (5) |
Under our experimental conditions (σm ≤0.7 mS/m and applied frequencies below 10 MHz), varying the cytoplasmic permittivity and conductivity did not significantly change the magnitude of ℜ(f̃CM). Therefore, we fixed their values to 50ε0 (ε0 = 8.85×10⁻¹² F/m) and 1000 mS/m, respectively, which are within the range of previously reported values for cancer cells [53, 54]. The cell radius was experimentally measured to be 10 ± 1 μm and was thus fixed to 10 μm in the model, leaving Cmembrane and C0 as the only free parameters in the ℜ(f̃CM) fit for the C0/Vtrap2 vs. applied frequency data.
2.6 Immunocapture of LNCaPs with DEP effects
To simulate the range of local shear stresses that cells experience in immunocapture devices and to characterize cell adhesion as a function shear stress, LNCaPs were flowed through the Hele-Shaw flow cell and captured cells were enumerated along the length of the device. For all immunocapture experimental conditions, two separate concentrations of antibody in solution were tested (i.e., incubated in the device): 5 μg/mL and 10 μg/mL. The cells were labeled with Calcein AM, suspended at 5×10⁵ cells/mL in the diluted PBS solution (σm = 70 mS/m), and flowed through the device at 0.2 mL/hr using a Chemyx Fusion 400 syringe pump for 10 minutes. Six separate conditions for the applied DEP force were tested: 6 Vpp at 10 kHz (where nDEP is expected), and 1 Vpp, 3 Vpp, 4.5 Vpp, 6 Vpp, and 10 Vpp at 10 MHz (where pDEP is expected). After each capture experiment, PBS was flowed through the device at 0.2 mL/hr for 10 minutes to wash away any non-adherent cells.
Fluorescent images of captured cells were taken at a 20× magnification at a series of predetermined observation sites along the length of the device, as shown in Figure 1. Cell count values were collected for 11 unique shear stress regions with at least three experimental replicates. For all shear stresses, the reported value corresponds to the shear stress at the immunocapture surface of the device in the center of the imaged area. Because streamlines in the Hele-Shaw flow cell diverge, the effective input density of cells is variable and must be corrected for—for this geometry, the expected input cell density is inversely proportional to the local shear stress. Thus, the reported captured cell densities are the number of cells imaged in a 1-mm2 region immediately to either side of the central axis of the device (i.e., with and without IDA electrodes) divided by the shear stress at the region’s location (shown in Figure 2) normalized by the inverse of the shear stress at the entrance of the device (where streamline divergence is minimal). This normalization procedure corrected for the diverging streamlines in the device; the normalized captured cell densities of immunocapture with and without DEP effects were then compared at each reported shear stress.
3 Results and discussion
3.1 DEP characterization of LNCaPs
To determine the AC electric field frequency-dependent DEP response of LNCaPs, we characterized their relative DEP magnitude and crossover frequency regions in a low and high-conductivity sugar solution as well as in PBS diluted in the low-conductivity sugar solution. The trapping potential was measured and the proportionate DEP response was calculated as a function of frequency, shown in Figures 3(a) and 3(b), respectively. We found that for the applied electric fields that were tested (10 kHz to 10 MHz, up to 10 Vpp), the cells exhibited no measurable pDEP response in both sugar solutions and PBS with σm > 100 mS/m. Therefore, we minimally diluted both buffer solutions to 70 mS/m, which is two to seven times higher than conductivities used in the majority of DEP cancer cell capture studies [33, 53–55]. We obtained similar DEP characterization data for the high-conductivity sugar solution and diluted PBS solution, which suggests that diluted PBS is an appropriate substitute for the isotonic sugar solution. PBS was chosen as a model for whole blood because both have similar osmolarities, ion concentrations, and conductivities (approximately σm = 1000 mS/m). Although blood is generally classified as a shear-thinning fluid with a higher viscosity than PBS, we expect that these hydrodynamic differences will discernibly impact the capture performance on a 2D immunocapture surface (e.g., Hele-Shaw flow cell), but minimally impact a 3D immunocapture device (e.g., GEDI [9, 17]) that more heavily relies on cell-to-post collisions for high-efficiency capture. Because we have demonstrated that cancer cells can be actuated by DEP in minimally diluted PBS, we expect to obtain similar results in minimally diluted blood, which can potentially result in a significantly higher throughput than current DEP devices used for rare cancer cell capture from blood.
Figure 3.
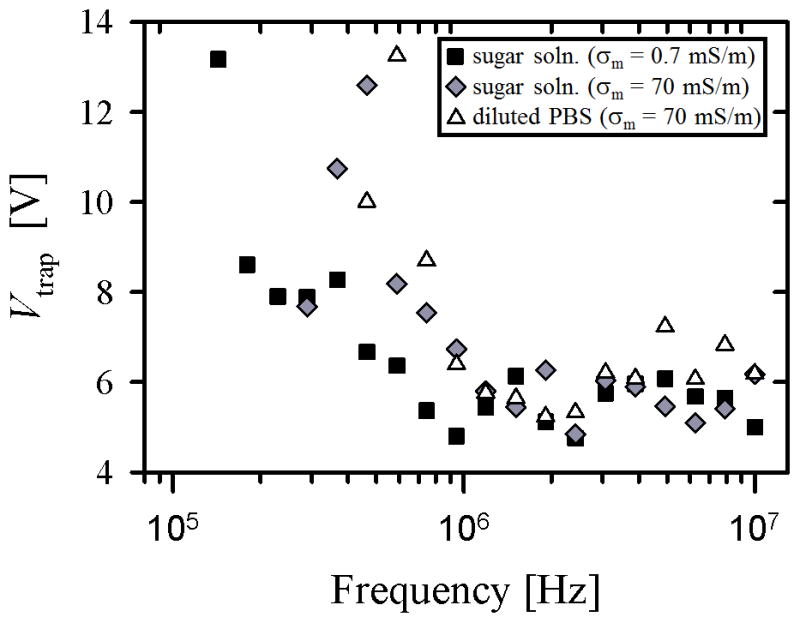
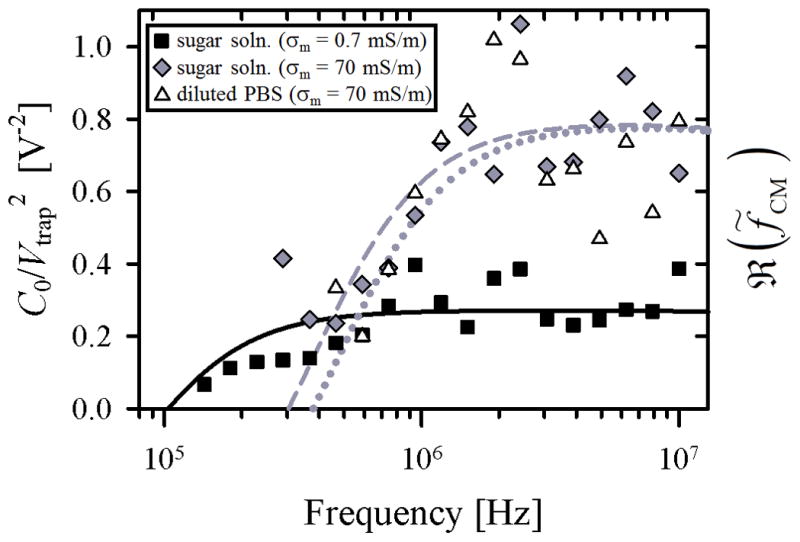
Trapping potential (Vtrap), 3(a), and proportionate DEP response (C0/Vtrap2), 3(b), as a function of applied cyclic frequency for LNCaPs suspended in three buffer solutions: (1) an isotonic sugar solution with σm = 0.7 mS/m (squares), (2) the same sugar solution with KCl added to produce σm = 70 mS/m (diamonds), and (3) PBS diluted 20 times by volume in the low-conductivity sugar solution to also produce σm = 70 mS/m (triangles). Each value represents the mean of 3 to 7 experimental replicates. Error bars are omitted for clarity; standard error of the mean values ranged from 0.2 to 4.6 Vpp for Vtrap and 0.008 to 0.2 Vpp−2 for C0/Vtrap2. Curve fits for ℜ(f̃CM) in 3(b) were calculated using Equations 2 and 5. Fit parameters were Cmembrane = 0.15 mF/m2 and C0 = 0.13 for the low-conductivity sugar solution (solid line), Cmembrane = 5 mF/m2 and C0 = 0.05 for the high-conductivity sugar solution (dashed line), and Cmembrane = 4 mF/m2 and C0 = 0.04 for the diluted PBS solution (dotted line).
The DEP response of LNCaPs measured in this work is qualitatively similar to that of cancer cells measured by other research groups [33, 36, 54]. Figure 3(a) shows that in the tested frequency range, the trapping potential decreased with increasing frequency, i.e., less voltage was needed to trap cells at higher frequencies. This trend suggests that the DEP response of the cells was stronger at higher frequencies, as confirmed in the proportionate DEP response data shown in Figure 3(b). A decrease in solution conductivity corresponded to a shift to lower frequencies in both the Vtrap data and the ℜ(f̃CM) curve fits; this shift was most clearly demonstrated in our crossover frequency measurements: approximately 300 kHz for σm = 70 mS/m and 100 kHz for σm = 0.7 mS/m. Despite this shift in frequency response, the trapping potential remained in the same range for both conductivities (Figure 3(a)), suggesting that the maximum value of ℜ(f̃CM) was comparable in both cases. Wu et al. reported similar trends in their capture voltage spectrum data for colorectal cancer cells, and obtained crossover frequencies in the same range using sucrose buffer solutions with σm = 50 mS/m and 100 mS/m [36].
The curve fits for ℜ(f̃CM) in Figure 3(b) were calculated by modeling the LNCaP cell as a single-shelled dielectric sphere with a frequency-dependent DEP response primarily dictated by a specific membrane capacitance, Cmembrane [52]. In the high-conductivity cases, the pDEP response and crossover frequency regions were fit well; the magnitude and frequency dependence, as well as the fit value for Cmembrane, were similar to those previously reported for other cancer cells [54–56]. Yang et al. reported on DEP separation of LNCaPs from colorectal cancer cells, but used a higher conductivity media (σm = 300 mS/m) at which LNCaPs experienced nDEP even in the MHz range [44]. Although we did not perform DEP characterization experiments at this conductivity, our model does predict similar nDEP behavior in those high conductivity and frequency ranges.
In the low-conductivity sugar solution, however, the best fit for Cmembrane and the measured crossover frequency resulted in a predicted ℜ(f̃CM) that was lower in magnitude than the other curve fits; this difference was not seen in the trapping potential values measured for both conductivities. Thus, the single-shell dielectric model seems able to describe only some aspects of the data. Despite this drawback, the model accurately predicted the DEP response of cancer cells suspended in media with σm > 1 mS/m (as experimentally verified in this study and others [33, 39, 54]), a range that includes whole blood, the suspending medium of most direct relevance for any CTC capture system. In this study, we measured the proportionate frequency-dependent pDEP response of LNCaPs, their crossover frequency, and predicted nDEP frequency range. Importantly, we obtained the strong pDEP response of LNCaPs by only diluting PBS by 20 times (in contrast to typical 100–1000 fold dilutions done by other researchers [33, 35, 39]). These results inform the design of future hybrid DEP-immunocapture systems for CTC isolation that, if multiplexed, have the potential to produce comparable capture efficiencies to existing immunocapture techniques (e.g., GEDI [9, 17]), with enhanced capture purity from the addition of DEP effects.
3.2 Immunocapture of LNCaPs with DEP effects
To study the effect of antibody concentration on immunocapture with and without DEP, we performed capture experiments in a microfluidic device of uniform, shallow depth (i.e., a Hele-Shaw flow cell) that was functionalized with two J591 incubating solution concentrations: 5 μg/mL and 10 μg/mL. In both cases, a range of voltages and frequencies were applied, and captured LNCaPs in regions up to 1 mm to either side of the device’s central axis (i.e., regions with and without IDA electrodes) were enumerated across a range of shear stresses. Figure 4 shows the calculated mean ratio of captured cell density with and without DEP effects across the entire range of shear stresses. As expected, there were fewer cells captured when a nDEP force was applied (ratio lower than 1), and more cells captured with an increasing pDEP force (ratio close to 1 when 1 Vpp was applied, and growing with increasing applied voltage). In comparing the two antibody incubating solution concentrations, when nDEP was applied at 10 kHz, fewer cells were repelled from the immunocapture surface in the 10 μg/mL case, thus resulting in a higher ratio of captured cell density with and without DEP. Furthermore, DEP-enhanced immunocapture at 10 MHz saturated for voltages above 4.5 Vpp with 10 μg/mL, whereas capture performance continued to improve up to 6 Vpp with 5 μg/mL. These results suggest that the immunocapture surface was saturated with antibody in the 10 μg/mL case (consistent with our previously reported results [46]). Although we demonstrated that the two antibody concentrations resulted in similar trends of immunocapture with and without DEP effects, the difference in capture performance is more evident with the lower concentration. Therefore, we only further analyzed and present data from the 5 μg/mL case.
Figure 4.
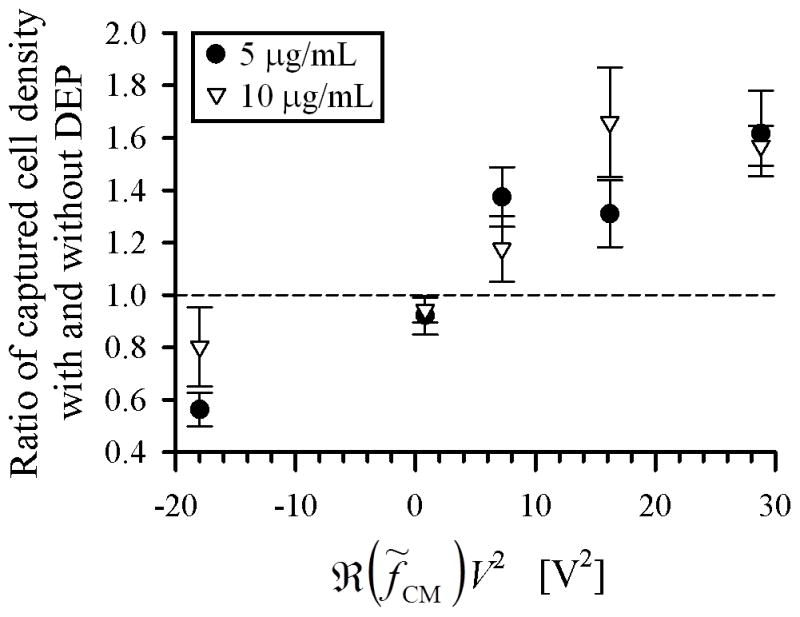
Ratio of captured cell density (normalized for streamline divergence) with and without DEP effects under various applied electric field frequency and voltage conditions for two J591 incubating solution concentrations: 5 μg/mL (circles) and 10 μg/mL (triangles). Ratios were averaged over captured cell density values across all shear stresses listed in Table 1. The no-DEP condition had 22 experimental replicates for the 10 μg/mL case and 15 replicates for the 5 μg/mL case; all other conditions had 3 to 7 replicates. Error bars represent standard error of the mean of ratios calculated at 11 shear stress values. The abscissa is plotted as ℜ(f̃CM)V2, which is proportional to the DEP force (Equation 4), to differentiate between nDEP and pDEP conditions. V was the applied voltage, and the values of ℜ(f̃CM) = −0.5 at 10 kHz and ℜ(f̃CM) = 0.8 at 10 MHz were obtained from the curve fits shown in Figure 3(b).
The captured cell density was quantified over a range of shear stress values for two applied frequencies (one of each chosen to induce pDEP or nDEP) and a series of increasing applied voltages; these values are listed in Table 1. We also performed experiments at 10 MHz with 10 Vpp, but found that the pDEP force was so strong that nearly all LNCaPs were captured at the first few electrodes nearest to the inlet, invalidating the weak-capture assumption required to interpret the data. The 10 Vpp data is thus omitted. Figure 5 shows representative cases of captured cell density with pDEP (10 MHz, 6 Vpp), nDEP (10 kHz, 6 Vpp), and no DEP applied. The observed trend of immunocapture with no DEP effects as a function of shear stress is consistent with those previously reported for LNCaPs [46]. In general, the number of captured cells increased with increasing applied voltage (i.e., pDEP force), and decreased with increasing shear stress. Immunocapture was enhanced by pDEP at 10 MHz, and was diminished by nDEP at 10 kHz. This trend is observed over nearly the entire shear stress range; at the two highest shear stress values, however, the captured cell densities with and without DEP were comparable, suggesting that immunocapture performance was both poor and unaffected by DEP above a threshold shear stress. Although we present a quantitative comparison of immunocapture with and without DEP effects as a function of shear stress, the underlying mechanisms of shear-dependent cell adhesion and rolling have been described using more complex models by other researchers [57, 58].
Table 1.
Captured cell density (normalized for streamline divergence) with a J591 incubating solution concentration of 5 μg/mL under various applied electric field frequency and voltage conditions as a function of shear stress. Captured cell density is reported as mean ± standard deviation. The no-DEP condition had 15 experimental replicates; all other conditions had 3 replicates.
| Captured cell density [cells/mm2]
| ||||||
|---|---|---|---|---|---|---|
| Shear stress [Pa] | No DEP | 10 kHz, 6 Vpp | 10 MHz, 1 Vpp | 10 MHz, 3 Vpp | 10 MHz, 4.5 Vpp | 10 MHz, 6 Vpp |
|
| ||||||
| 0.009 | 123.9±70.1 | 44.8±20.3 | 151.3±140.5 | 147.9±105.9 | 263.3±80.8 | 227.5±146.4 |
| 0.011 | 71.1±35.3 | 34.1±36.9 | 93.7±87.7 | 133.8±66.7 | 142.3±37.2 | 195.9±147.3 |
| 0.013 | 53.1±25.0 | 18.7±6.6 | 64.1±50.4 | 104.4±51.8 | 85.7±17.5 | 103.7±58.4 |
| 0.015 | 44.4±24.3 | 13.4±8.3 | 35.7±25.2 | 79.7±46.8 | 49.1±9.8 | 63.7±18.9 |
| 0.017 | 33.6±13.9 | 15.0±4.0 | 24.2±12.5 | 49.6±22.2 | 41.5±22.6 | 61.1±25.9 |
| 0.018 | 23.6±11.6 | 14.4±7.3 | 19.1±3.2 | 35.6±20.7 | 29.2±5.6 | 36.1±17.5 |
| 0.020 | 21.1±7.2 | 10.8±0.8 | 15.2±10.0 | 27.0±2.2 | 22.1±3.9 | 37.8±8.6 |
| 0.021 | 18.9±6.6 | 10.9±5.5 | 12.7±11.9 | 19.6±11.4 | 21.4±10.3 | 28.2±4.2 |
| 0.023 | 17.9±7.5 | 13.6±1.9 | 17.0±7.2 | 20.0±8.1 | 20.0±1.9 | 27.6±1.5 |
| 0.024 | 18.7±8.0 | 16.3±8.8 | 12.0±7.3 | 17.1±7.7 | 17.9±7.3 | 17.9±5.5 |
| 0.026 | 17.4±6.9 | 16.2±9.1 | 18.8±8.8 | 16.6±7.5 | 14.7±4.1 | 11.7±5.1 |
Figure 5.

Captured cell density (normalized for streamline divergence) as a function of shear stress under representative cases of pDEP (10 MHz, 6 Vpp; black bars), nDEP (10 kHz, 6 Vpp; gray bars), and no DEP (white bars). Bars represent the mean captured cell density for the corresponding data listed in Table 1. The no-DEP condition had 15 experimental replicates; the pDEP and nDEP conditions had 3 replicates each. Error bars represent standard deviation.
To our knowledge, this is the first reported study of DEP effects on the immunocapture of cancer cells. Our results provide insight on the experimental conditions (e.g., applied voltage range, antibody concentration, flow parameters and device geometries that control shear stress) needed to optimize DEP-guided immunocapture performance. From a technology standpoint, this work was completed with a device that was designed to generate shear-dependent adhesion data [46]; we focused on characterization of cell physicochemical response rather than clinical and translational implementation of high-efficiency rare cell capture, which we have reported previously [9]. Our data on shear-dependent cell adhesion with the addition of DEP effects can be incorporated into computational fluid dynamics simulations of cancer and blood cell trajectories in 3D immunocapture devices to better predict capture performance and inform the design of future high-purity CTC capture systems that can facilitate subsequent clinical studies [17, 27].
Previous studies have also reported the combination of DEP with a variety of other techniques to enable cell capture, separation, or characterization. Yang et al. combined DEP and immunocapture to detect and concentrate Listeria and Salmonella cells [59, 60], Kim et al. demonstrated DEP-magnetic activated sorting of bacteria and cancer cells [41, 61], Hashimoto et al. selectively captured leukocytes using nDEP to direct cells to antibody-immobilized regions [62], and Cristofanilli et al. used DEP to separate cancer cells on an “electrosmear” slide with adhesive coating [63]. In addition, DEP has been used for anticancer drug screening [64], detection of cancer markers [65], and impedance sensing of cancer cells [66]. For applications in rare CTC capture from whole blood, however, DEP may best complement existing robust immunocapture techniques that demonstrate antigen specificity and high-efficiency capture [17]. A hybrid DEP-immunocapture system in which DEP is tuned to promote CTC interactions (by pDEP) and prevent leukocyte interactions (by nDEP) with capture surfaces can minimize problems associated with immunocapture techniques, such as nonspecific leukocyte adhesion. Such a DEP-guided immunocapture system has the potential to be used in high-impact clinical studies (e.g., genetic and pharmacological evaluation of CTCs [9]) that benefit from the platform’s improved CTC capture efficiency and purity relative to either DEP or immunocapture techniques alone.
4 Concluding remarks
This work characterizes shear-dependent cancer cell adhesion in a novel hybrid DEP-immunocapture microfluidic system. We measured the frequency-dependent pDEP response of LNCaPs, as well as their crossover frequency and nDEP frequency ranges. We showed that, depending on the applied frequency, DEP can control the capture performance of prostate cancer cells by attracting them to or repelling them from immunocapture surfaces, and that this phenomenon is dependent on local shear stresses experienced by the cells. In designing future CTC capture devices, we expect that DEP and immunocapture techniques will work synergistically to yield improved capture performance and facilitate subsequent biological studies on CTCs.
Acknowledgments
This work was supported by the Center on the Microenvironment and Metastasis at Cornell (Award Number U54CA-143876) from the National Cancer Institute Physical Sciences Oncology Center (NCI PS-OC). CH and BGH were supported by National Science Foundation (NSF) Graduate Research Fellowships, and SMS was supported by Cornell’s Learning Initiative in Medicine and Bioengineering (CLIMB) NSF GK-12 program and a Cornell Sloan Fellowship. Device fabrication was performed in part at the Cornell NanoScale Science and Technology Facility (CNF), a member of the National Nanotechnology Infrastructure Network, which is supported by the NSF (Grant ECS-0335765). The authors thank Erica D. Pratt and Srinitya Arasanipalai for helpful discussions.
References
- 1.Allard WJ, Matera J, Miller MC, Repollet M, Connelly MC, Rao C, Tibbe AGJ, Uhr JW, Terstappen LWMM. Clin Cancer Res. 2004;10:6897–904. doi: 10.1158/1078-0432.CCR-04-0378. [DOI] [PubMed] [Google Scholar]
- 2.Maheswaran S, Haber DA. Curr Opin Genet Dev. 2010;20:96–9. doi: 10.1016/j.gde.2009.12.002. [DOI] [PMC free article] [PubMed] [Google Scholar]
- 3.Cristofanilli M, Budd GT, Ellis MJ, Stopeck A, Matera J, Miller MC, Reuben JM, Doyle GV, Allard WJ, Terstappen LWMM, Hayes DF. N Engl J Med. 2004;351:781–91. doi: 10.1056/NEJMoa040766. [DOI] [PubMed] [Google Scholar]
- 4.Hayes DF, Cristofanilli M, Budd GT, Ellis MJ, Stopeck A, Miller MC, Matera J, Allard WJ, Doyle GV, Terstappen LWWM. Clin Cancer Res. 2006;12:4218–24. doi: 10.1158/1078-0432.CCR-05-2821. [DOI] [PubMed] [Google Scholar]
- 5.de Bono JS, Scher HI, Montgomery RB, Parker C, Miller MC, Tissing H, Doyle GV, Terstappen LWWM, Pienta KJ, Raghavan D. Clin Cancer Res. 2008;14:6302–9. doi: 10.1158/1078-0432.CCR-08-0872. [DOI] [PubMed] [Google Scholar]
- 6.Danila DC, Fleisher M, Scher HI. Clin Cancer Res. 2011;17:3903–12. doi: 10.1158/1078-0432.CCR-10-2650. [DOI] [PMC free article] [PubMed] [Google Scholar]
- 7.Leversha MA, Han J, Asgari Z, Danila DC, Lin O, Gonzalez-Espinoza R, Anand A, Lilja H, Heller G, Fleisher M, Scher HI. Clin Cancer Res. 2009;15:2091–7. doi: 10.1158/1078-0432.CCR-08-2036. [DOI] [PMC free article] [PubMed] [Google Scholar]
- 8.Stott SL, Lee RJ, Nagrath S, Yu M, Miyamoto DT, Ulkus L, Inserra EJ, Ulman M, Springer S, Nakamura Z, Moore AL, Tsukrov DI, Kempner ME, Dahl DM, Wu CL, Iafrate AJ, Smith MR, Tompkins RG, Sequist LV, Toner M, Haber DA, Maheswaran S. Sci Transl Med. 2010;2:25ra23. doi: 10.1126/scitranslmed.3000403. [DOI] [PMC free article] [PubMed] [Google Scholar]
- 9.Kirby BJ, Jodari M, Loftus MS, Gakhar G, Pratt ED, Chanel-Vos C, Gleghorn JP, Santana SM, Liu H, Smith JP, Navarro VN, Tagawa ST, Bander NH, Nanus DM, Giannakakou P. PLOS ONE. 2012;7:e35976. doi: 10.1371/journal.pone.0035976. [DOI] [PMC free article] [PubMed] [Google Scholar]
- 10.Rhim AD, Mirek ET, Aiello NM, Maitra A, Bailey JM, McAllister F, Reichert M, Beatty GL, Rustgi AK, Vonderheide RH, Leach SD, Stanger BZ. Cell. 2012;148:349–61. doi: 10.1016/j.cell.2011.11.025. [DOI] [PMC free article] [PubMed] [Google Scholar]
- 11.Yu M, Ting DT, Stott SL, Wittner BS, Ozsolak F, Paul S, Ciciliano JC, Smas ME, Winokur D, Gilman AJ, Ulman MJ, Xega K, Contino G, Alagesan B, Brannigan BW, Milos PM, Ryan DP, Sequist LV, Bardeesy N, Ramaswamy S, Toner M, Maheswaran S, Haber DA. Nature. 2012;487:510–3. doi: 10.1038/nature11217. [DOI] [PMC free article] [PubMed] [Google Scholar]
- 12.Racila E, Euhus D, Weiss AJ, Rao C, McConnell J, Terstappen LWMM, Uhr JW. P Natl Acad Sci USA. 1998;95:4589–94. doi: 10.1073/pnas.95.8.4589. [DOI] [PMC free article] [PubMed] [Google Scholar]
- 13.Krivacic RT, Ladanyi A, Curry DN, Hsieh HB, Kuhn P, Bergsrud DE, Kepros JF, Barbera T, Ho MY, Chen LB, Lerner RA, Bruce RH. P Natl Acad Sci USA. 2004;101:10501–4. doi: 10.1073/pnas.0404036101. [DOI] [PMC free article] [PubMed] [Google Scholar]
- 14.Pratt ED, Huang C, Hawkins BG, Gleghorn JP, Kirby B. J Chem Eng Sci. 2011;66:1508–22. doi: 10.1016/j.ces.2010.09.012. [DOI] [PMC free article] [PubMed] [Google Scholar]
- 15.Parkinson DR, Dracopoli N, Gumbs Petty B, Compton C, Cristofanilli M, Deisseroth A, Hayes DF, Kapke G, Kumar P, Lee JS, Liu MC, McCormack R, Mikulski S, Nagahara L, Pantel K, Pearson-White S, Punnoose EA, Roadcap LT, Schade AE, Scher HI, Sigman CC, Kelloff GJ. J Transl Med. 2012;10:138. doi: 10.1186/1479-5876-10-138. [DOI] [PMC free article] [PubMed] [Google Scholar]
- 16.Nagrath S, Sequist LV, Maheswaran S, Bell DW, Irimia D, Ulkus L, Smith MR, Kwak EL, Digumarthy S, Muzikansky A, Ryan P, Balis UJ, Tompkins RG, Haber DA, Toner M. Nature. 2007;450:1235–9. doi: 10.1038/nature06385. [DOI] [PMC free article] [PubMed] [Google Scholar]
- 17.Gleghorn JP, Pratt ED, Denning D, Liu H, Bander NH, Tagawa ST, Nanus DM, Giannakakou PA, Kirby BJ. Lab Chip. 2010;10:27–9. doi: 10.1039/b917959c. [DOI] [PMC free article] [PubMed] [Google Scholar]
- 18.Stott SL, Hsu CH, Tsukrov DI, Yu M, Miyamoto DT, Waltman BA, Rothenberg SM, Shah AM, Smas ME, Korir GK, Floyd FP, Gilman AJ, Lord JB, Winokur D, Springer S, Irimia D, Nagrath S, Sequist LV, Lee RJ, Isselbacher KJ, Maheswaran S, Haber DA, Toner M. P Natl Acad Sci USA. 2010;107:18392–7. doi: 10.1073/pnas.1012539107. [DOI] [PMC free article] [PubMed] [Google Scholar]
- 19.Wang S, Liu K, Liu J, Yu ZTF, Xu X, Zhao L, Lee T, Lee EK, Reiss J, Lee YK, Chung LWK, Huang J, Rettig M, Seligson D, Duraiswamy KN, Shen CKF, Tseng HR. Angew Chem Int Edit. 2011;50:3084–8. doi: 10.1002/anie.201005853. [DOI] [PMC free article] [PubMed] [Google Scholar]
- 20.Zheng S, Lin H, Liu J-Q, Balic M, Datar R, Cote RJ, Tai Y-C. J Chromatog A. 2007;1162:154–61. doi: 10.1016/j.chroma.2007.05.064. [DOI] [PubMed] [Google Scholar]
- 21.Lin HK, Zheng S, Williams AJ, Balic M, Groshen S, Scher HI, Fleisher M, Stadler W, Datar RH, Tai YC, Cote RJ. Clin Cancer Res. 2010;16:5011–8. doi: 10.1158/1078-0432.CCR-10-1105. [DOI] [PMC free article] [PubMed] [Google Scholar]
- 22.Adams AA, Okagbare PI, Feng J, Hupert ML, Patterson D, Göttert J, McCarley RL, Nikitopoulos D, Murphy MC, Soper SA. J Am Chem Soc. 2008;130:8633–41. doi: 10.1021/ja8015022. [DOI] [PMC free article] [PubMed] [Google Scholar]
- 23.Dharmasiri U, Njoroge SK, Witek MA, Adebiyi MG, Kamande JW, Hupert ML, Barany F, Soper SA. Anal Chem. 2011;83:2301–9. doi: 10.1021/ac103172y. [DOI] [PMC free article] [PubMed] [Google Scholar]
- 24.Hughes AD, King MR. Langmuir. 2010;26:12155–64. doi: 10.1021/la101179y. [DOI] [PubMed] [Google Scholar]
- 25.Hughes AD, Mattison J, Western LT, Powderly JD, Greene BT, King MR. Clin Chem. 2012;58:846–53. doi: 10.1373/clinchem.2011.176669. [DOI] [PubMed] [Google Scholar]
- 26.Wang S, Wang H, Jiao J, Chen K-J, Owens GE, Kamei K-i, Sun J, Sherman DJ, Behrenbruch CP, Wu H, Tseng H-R. Angew Chem Int Edit. 2009;48:8970–3. doi: 10.1002/anie.200901668. [DOI] [PMC free article] [PubMed] [Google Scholar]
- 27.Smith JP, Barbati AC, Santana SM, Gleghorn JP, Kirby BJ. Electrophoresis. 2012;33:3133–42. doi: 10.1002/elps.201200263. [DOI] [PMC free article] [PubMed] [Google Scholar]
- 28.Hawkins BG, Gleghorn JP, Kirby BJ, Zahn JD, editors. Methods in Bioengineering: Biomicrofabrication and Biomicrofluidics. Artech House; Boston: 2009. pp. 133–81. [Google Scholar]
- 29.Jones TB. Electromechanics of Particles. Cambridge University Press; New York: 1995. [Google Scholar]
- 30.Morgan H, Green N. AC Electrokinetics: Colloids and Nanoparticles. Research Studies Press, Ltd; Baldock, Hertfordshire, England: 2002. [Google Scholar]
- 31.Kirby BJ. Micro- and Nanoscale Fluid Mechanics: Transport in Microfluidic Devices. Cambridge University Press; New York: 2010. [Google Scholar]
- 32.Voldman J. Annu Rev Biomed Eng. 2006;8:425–54. doi: 10.1146/annurev.bioeng.8.061505.095739. [DOI] [PubMed] [Google Scholar]
- 33.Gascoyne PRC, Noshari J, Anderson TJ, Becker FF. Electrophoresis. 2009;30:1388–98. doi: 10.1002/elps.200800373. [DOI] [PMC free article] [PubMed] [Google Scholar]
- 34.Shim S, Gascoyne P, Noshari J, Hale KS. Integr Biol. 2011;3:850–62. doi: 10.1039/c1ib00032b. [DOI] [PMC free article] [PubMed] [Google Scholar]
- 35.Gupta V, Jafferji I, Garza M, Melnikova VO, Hasegawa DK, Pethig R, Davis DW. Biomicrofluidics. 2012;6:024133. doi: 10.1063/1.4731647. [DOI] [PMC free article] [PubMed] [Google Scholar]
- 36.Wu L, Lanry Yung L-Y, Lim K-M. Biomicrofluidics. 2012;6:14113. doi: 10.1063/1.3690470. [DOI] [PMC free article] [PubMed] [Google Scholar]
- 37.Bhattacharya S, Chao TC, Ros A. Electrophoresis. 2011;32:2550–8. doi: 10.1002/elps.201100066. [DOI] [PubMed] [Google Scholar]
- 38.Shafiee H, Sano MB, Henslee EA, Caldwell JL, Davalos RV. Lab Chip. 2010;10:438–45. doi: 10.1039/b920590j. [DOI] [PubMed] [Google Scholar]
- 39.Henslee EA, Sano MB, Rojas AD, Schmelz EM, Davalos RV. Electrophoresis. 2011;32:2523–9. doi: 10.1002/elps.201100081. [DOI] [PubMed] [Google Scholar]
- 40.Salmanzadeh A, Romero L, Shafiee H, Gallo-Villanueva RC, Stremler MA, Cramer SD, Davalos RV. Lab Chip. 2012;12:182–9. doi: 10.1039/c1lc20701f. [DOI] [PubMed] [Google Scholar]
- 41.Kim U, Shu CW, Dane KY, Daugherty PS, Wang JYJ, Soh HT. P Natl Acad Sci USA. 2007;104:20708–12. doi: 10.1073/pnas.0708760104. [DOI] [PMC free article] [PubMed] [Google Scholar]
- 42.Alazzam A, Stiharu I, Bhat R, Meguerditchian AN. Electrophoresis. 2011;32:1327–36. doi: 10.1002/elps.201000625. [DOI] [PubMed] [Google Scholar]
- 43.Moon H-S, Kwon K, Kim S-I, Han H, Sohn J, Lee S, Jung H-I. Lab Chip. 2011;11:1118–25. doi: 10.1039/c0lc00345j. [DOI] [PubMed] [Google Scholar]
- 44.Yang F, Yang X, Jiang H, Wang G. Electrophoresis. 2011;32:2377–84. doi: 10.1002/elps.201100039. [DOI] [PMC free article] [PubMed] [Google Scholar]
- 45.Liu H, Moy P, Kim S, Xia Y, Rajasekaran A, Navarro V, Knudsen B, Bander NH. Cancer Res. 1997;57:3629–34. [PubMed] [Google Scholar]
- 46.Santana SM, Liu H, Bander NH, Gleghorn JP, Kirby BJ. Biomed Microdevices. 2012;14:401–7. doi: 10.1007/s10544-011-9616-5. [DOI] [PMC free article] [PubMed] [Google Scholar]
- 47.Usami S, Chen HH, Zhao Y, Chien S, Skalak R. Ann Biomed Eng. 1993;21:77–83. doi: 10.1007/BF02368167. [DOI] [PubMed] [Google Scholar]
- 48.Sethu P, Sin A, Toner M. Lab Chip. 2006;6:83–9. doi: 10.1039/b512049g. [DOI] [PubMed] [Google Scholar]
- 49.Murthy SK, Sin A, Tompkins RG, Toner M. Langmuir. 2004;20:11649–55. doi: 10.1021/la048047b. [DOI] [PubMed] [Google Scholar]
- 50.Sanchis A, Brown AP, Sancho M, Martínez G, Sebastián JL, Muñoz S, Miranda JM. Bioelectromagnetics. 2007;28:393–401. doi: 10.1002/bem.20317. [DOI] [PubMed] [Google Scholar]
- 51.Hawkins BG, Huang C, Arasanipalai S, Kirby BJ. Anal Chem. 2011;83:3507–15. doi: 10.1021/ac2002017. [DOI] [PubMed] [Google Scholar]
- 52.Foster KR, Sauer FA, Schwan HP. Biophys J. 1992;63:180–90. doi: 10.1016/S0006-3495(92)81588-6. [DOI] [PMC free article] [PubMed] [Google Scholar]
- 53.Becker FF, Gascoyne PR, Wang XB, Huang Y, Pethig R, Vykoukal J. P Natl Acad Sci USA. 1995;92:860–4. doi: 10.1073/pnas.92.3.860. [DOI] [PMC free article] [PubMed] [Google Scholar]
- 54.Sano MB, Henslee EA, Schmelz E, Davalos RV. Electrophoresis. 2011;32:3164–71. doi: 10.1002/elps.201100351. [DOI] [PubMed] [Google Scholar]
- 55.Huang Y, Yang J, Wang XB, Becker FF, Gascoyne PRC. J Hematoth Stem Cell. 1999;8:481–90. doi: 10.1089/152581699319939. [DOI] [PMC free article] [PubMed] [Google Scholar]
- 56.Mulhall HJ, Labeed FH, Kazmi B, Costea DE, Hughes MP, Lewis MP. Anal Bioanal Chem. 2011;401:2455–63. doi: 10.1007/s00216-011-5337-0. [DOI] [PubMed] [Google Scholar]
- 5.Hammer DA, Lauffenburger DA. Biophys J. 1987;52:475–87. doi: 10.1016/S0006-3495(87)83236-8. [DOI] [PMC free article] [PubMed] [Google Scholar]
- 58.Caputo KE, Lee D, King MR, Hammer DA. Biophys J. 2007;92:787–97. doi: 10.1529/biophysj.106.082321. [DOI] [PMC free article] [PubMed] [Google Scholar]
- 59.Yang L, Banada PP, Chatni MR, Seop Lim K, Bhunia AK, Ladisch M, Bashir R. Lab Chip. 2006;6:896–905. doi: 10.1039/b607061m. [DOI] [PubMed] [Google Scholar]
- 60.Yang L. Talanta. 2009;80:551–8. doi: 10.1016/j.talanta.2009.07.024. [DOI] [PubMed] [Google Scholar]
- 61.Kim U, Soh HT. Lab Chip. 2009;9:2313–8. doi: 10.1039/b903950c. [DOI] [PubMed] [Google Scholar]
- 62.Hashimoto M, Kaji H, Nishizawa M. Biosens Bioelectron. 2009;24:2892–7. doi: 10.1016/j.bios.2009.02.025. [DOI] [PubMed] [Google Scholar]
- 63.Cristofanilli M, Krishnamurthy S, Das CM, Reuben JM, Spohn W, Noshari J, Becker F, Gascoyne PR. J Sep Sci. 2008;31:3732–9. doi: 10.1002/jssc.200800366. [DOI] [PubMed] [Google Scholar]
- 64.Hsiung L-C, Chiang C-L, Wang C-H, Huang Y-H, Kuo C-T, Cheng J-Y, Lin C-H, Wu V, Chou H-Y, Jong D-S, Lee H, Wo AM. Lab Chip. 2011;11:2333–42. doi: 10.1039/c1lc20147f. [DOI] [PubMed] [Google Scholar]
- 65.Ramón-Azcón J, Yasukawa T, Mizutani F. Biosens Bioelectron. 2011;28:443–9. doi: 10.1016/j.bios.2011.07.073. [DOI] [PubMed] [Google Scholar]
- 66.Chuang CH, Huang YW, Wu YT. Sensors. 2011;11:11021–35. doi: 10.3390/s111111021. [DOI] [PMC free article] [PubMed] [Google Scholar]