

Abstract
Huntington disease (HD) is most widely known for its selective degeneration of striatal neurons but there is also growing evidence for white matter (WM) deterioration. The primary objective of this research was to conduct a large‐scale analysis using multisite diffusion‐weighted imaging (DWI) tractography data to quantify diffusivity properties along major prefrontal cortex WM tracts in prodromal HD. Fifteen international sites participating in the PREDICT‐HD study collected imaging and neuropsychological data on gene‐positive HD participants without a clinical diagnosis (i.e., prodromal) and gene‐negative control participants. The anatomical prefrontal WM tracts of the corpus callosum (PFCC), anterior thalamic radiations (ATRs), inferior fronto‐occipital fasciculi (IFO), and uncinate fasciculi (UNC) were identified using streamline tractography of DWI. Within each of these tracts, tensor scalars for fractional anisotropy, mean diffusivity, radial diffusivity, and axial diffusivity coefficients were calculated. We divided prodromal HD subjects into three CAG‐age product (CAP) groups having Low, Medium, or High probabilities of onset indexed by genetic exposure. We observed significant differences in WM properties for each of the four anatomical tracts for the High CAP group in comparison to controls. Additionally, the Medium CAP group presented differences in the ATR and IFO in comparison to controls. Furthermore, WM alterations in the PFCC, ATR, and IFO showed robust associations with neuropsychological measures of executive functioning. These results suggest long‐range tracts essential for cross‐region information transfer show early vulnerability in HD and may explain cognitive problems often present in the prodromal stage. Hum Brain Mapp 36:3717–3732, 2015. © 2015 Wiley Periodicals, Inc.
Keywords: diffusion weighted MRI, diffusion tractography, diffusion tensor imaging, Huntington's disease, prefrontal cortex, multicenter studies, cross‐sectional analysis
INTRODUCTION
Huntington disease (HD) is a progressive neurodegenerative disorder characterized by motor, cognitive, and behavioral disturbances. HD is inherited in an autosomal dominant fashion where there is an expansion of polygutamine (cytosine–adenine–guanine [CAG]) repeats in the huntingtin gene. The manifestation of motor symptoms is used to clinically diagnose the disease. On average, motor onset occurs in the fourth decade of life, with a life expectancy after motor onset of 15–20 years [Harper, 1991; Hayden, 1981]. Unfortunately, present day pharmacologic options for treatment only target symptoms, and do not slow or stop disease progression. Therefore, there are several studies, such as Neurobiological Predictors of Huntington's Disease (PREDICT‐HD) and TRACK‐HD, focused on identifying biomarkers of disease progression to judge efficacy of new treatments [Paulsen et al., 2008; Tabrizi et al., 2011].
Structural magnetic resonance imaging (s‐MRI) has uncovered consistent features of disease progression in both diagnosed and prodromal HD individuals [Esmaeilzadeh et al., 2011]. Atrophy of the caudate and putamen was demonstrated in symptomatic HD individuals [Jernigan et al., 1991] and shown to be a progressive feature of HD [Aylward et al., 1997] that was evident many years prior to diagnosis [Paulsen et al., 2008; Tabrizi et al., 2012]. The degree of basal ganglia atrophy is predictive of years to disease onset in prodromal HD patients [Aylward et al., 1996; Harris et al., 1999] and correlated with greater clinical impairment [Campodonico et al., 1998; Harris et al., 1999]. In addition to the extensively studied basal ganglia abnormalities, evidence of decreased white matter (WM) volume is demonstrated in prodromal HD individuals more than 15 years from diagnosis [Paulsen et al., 2006, 2010]. There is also evidence that WM has a greater association with cognitive deficits in symptomatic HD individuals than the correlation between decreased striatal volume and cognitive deficits [Beglinger et al., 2005]. As for specific regions of WM, features of frontal lobe WM have consistently tracked with the clinical features of HD [Aylward et al., 1998]. Much like striatal volume, frontal lobe WM volume loss was first demonstrated in diagnosed HD [Aylward et al., 1998] and later in prodromal HD individuals [Stoffers et al., 2010].
Although decrease in WM volume correlates with disease progression in HD, characterizing WM microstructural changes (in addition to volume) may be helpful in understanding clinical manifestations of HD. Diffusion‐weighted imaging (DWI) is a method for detecting and quantifying tissue microstructure. WM contains significant restrictions to water mobility and reductions in anisotropy may reflect altered properties due to disease processes. Diffusion can be modeled at each voxel as a tensor to compose a diffusion tensor image (DTI) [Basser and Pierpaoli, 1996]. The diffusion tensor model decomposes diffusion into direction and magnitude with eigenvectors and eigenvalues, respectively, where diffusion tensor scalars are derived from the eigenvalues. Diffusion tensor scalar measures are, therefore, numerical representations of diffusion anisotropy degree or magnitude and are computed at the voxel level or averaged over a region of interest [Basser, 1995; Basser and Pierpaoli, 1996; Jones et al., 2013]. Fractional anisotropy (FA) is dimensionless and represents degree of diffusion anisotropy or ordered diffusion on a scale of 0 (isotropic or disordered diffusion) to 1 (high anisotropy or ordered diffusion). Therefore, an area of high FA contains uniform diffusion or minimal crossing fibers [Basser and Pierpaoli, 1996; Jones et al., 2013]. In humans, decreases in FA have been used to detect differences in normal appearing WM in individuals with multiple sclerosis [Filippi et al., 2001] and Alzheimer disease [Huang et al., 2007] in comparison to controls. Mean diffusivity (MD, units = mm2/s) represents average diffusion magnitude along the three eigenvectors of the diffusion tensor model [Basser, 1995]. Axial diffusivity (AD, units = mm2/s) is the magnitude of diffusion of the principal eigenvector, while radial diffusivity (RD, units = mm2/s) is the average magnitude along the second and third eigenvectors [Basser, 1995]. In animal studies, changes in RD and AD have been shown to correlate with incomplete myelination [Song et al., 2002] or myelin injury [Song et al., 2003, 2005] and axonal injury [Song et al., 2003], respectively.
WM tracts innervating the prefrontal cortex (PFC) are of particular interest in HD because of known connections between the PFC and portions of the basal ganglia [Alexander et al., 1986] and the importance of PFC‐mediated networks in cognitive and executive functioning [Roberts et al., 1998]. Early studies of WM volume [Aylward et al., 1998] provided evidence that the frontal lobe WM volume is affected in HD subjects. Voxel‐based scalar studies on PFC WM have reported significantly increased and/or decreased FA and increased MD in both prodromal [Magnotta et al., 2009; Reading et al., 2005; Rosas et al., 2006] and symptomatic HD [Della Nave et al., 2010; Delmaire et al., 2013; Rosas et al., 2006] participants relative to gene‐negative controls. Regions of interest (ROI)‐based scalar analyses of PFC WM have reported decreased FA and increased MD in WM passing through the superior frontal cortex in early HD [Dumas et al., 2012], while increased MD and RD were seen in inferior and lateral PFC WM in prodromal HD groups relative to controls [Matsui et al., 2014]. In the aforementioned scalar analyses, diffusivity in the HD participants correlated with poorer performance on cognitive tests such as the Stroop Color and Word Test [Dumas et al., 2012] and Trail Making Test (TMT) Part B [Delmaire et al., 2013; Matsui et al., 2014] that are both abnormal in prodromal HD participants [Paulsen et al., 2013].
This study used tractography to build upon aforementioned voxel [Magnotta et al., 2009; Reading et al., 2005; Rosas et al., 2006] and region of interest‐based [Dumas et al., 2012; Matsui et al., 2014] studies in prodromal HD subjects. Tractography‐based methods use DWI to provide tract‐specific information about WM properties and thereby reveal specific anatomical tracts that show alterations as a function of HD progression. In our study, a tract‐based analysis was performed on four well‐established PFC WM fiber tracts: the prefrontal section of the corpus callosum (PFCC), left and right anterior thalamic radiations (ATRs), left and right inferior fronto‐occipital fasciculi (IFOs), and left and right uncinate fasciculi (UNCs). The PFCC is a large interhemispheric tract of fibers that projects from the genu of the corpus callosum [Wakana et al., 2004]. These four PFC WM fiber tracts were selected for their connection to the PFC and demonstrated relationship to both prodromal HD and cognitive reserve. Previously, a voxel‐based WM study [Rizk‐Jackson et al., 2011] indicated the PFCC and UNC together might be a good imaging biomarker for the prodromal HD group. The IFO and UNC were also correlated to cognitive reserve in an Alzheimer disease study in comparison to the healthy controls [Arenaza‐Urquijo et al., 2011]. Previous tractography‐based studies, although not focusing specifically on the PFC tracts examined here, suggest that the PFC may be altered in symptomatic HD subjects. Bohanna and colleagues investigated 12 symptomatic HD patients and 14 matched controls from a single site and found higher FA and MD in WM projections from the caudate and putamen to the PFC [Bohanna et al., 2011]. Recently, Poudel and colleagues studied 35 prodromal participants, 36 symptomatic participants, and 35 controls from two sites and found robust alterations in WM connections between putamen and lateral PFC in both symptomatic HD and prodromal HD participants. RD was higher in this tract, although there were no differences in FA. Additionally, Phillips et al. [2014] analyzed DWI data from 25 prodromal participants, 25 symptomatic participants, and 50 controls from a single site. They demonstrated widespread deep WM changes for symptomatic HD participants and more limited changes in prodromal HD for DWI measures of large long‐range tracts (including some portions of the PFC).
This study is a novel in‐depth investigation of specific WM tracts emanating from the PFC measured from 146 prodromal and 65 control participants collected at 15 PREDICT‐HD sites. The PFCC, ATR, IFO, and UNC WM tracts were selected for their connection to the PFC and demonstrated relationship to both prodromal HD and cognitive reserve. To expand on the initial tractography work in HD, we exclusively focused on identifying changes in the prodromal phase with streamline tractography using the largest sample (to our knowledge) of imaging and neuropsychological data collected from prodromal HD subjects. In addition, this study demonstrates the feasibility of processing and analyzing DWI data on a scale similar to the requirements of proposed clinical trials that often require several hundred participants from multiple sites to obtain sufficient sample sizes. We hypothesized that diffusivity differences along each tract among groups of prodromal HD participants separated by degree of genetic exposure would be significantly different from controls. It was also hypothesized that the strength of differences in diffusivity would be a function of genetic exposure that was previously well established by age and CAG repeat length [Zhang et al., 2011], with the group with the highest genetic exposure showing the greatest difference. In addition, we hypothesized changes in diffusivity will correlate with cognitive performances in prodromal HD [Paulsen et al., 2013].
MATERIALS AND METHODS
Participants
Imaging and clinical data collected from 15 PREDICT‐HD sites included 65 controls and 146 prodromal CAG‐expanded individuals. PREDICT‐HD is a multisite collaboration with the goal of utilizing neurobiological and clinical markers to understand the progression of HD before diagnosis and provide candidate disease markers to assist future preventative HD clinical trials. We obtained written informed consent from each participant, and all research was performed in compliance with the Code of Ethics of the World Medical Association (Declaration of Helsinki) and the standards established by the Institutional Review Board at each respective site. Healthy controls were members of HD families who did not possess the CAG expansion. Based on their CAG‐Age Product (CAP) designation [Zhang et al., 2011], prodromal CAG‐expanded individuals were stratified into Low (n = 43; CAP < 287.16), Medium (n = 54; 287.16 < CAP < 367.12), and High (n = 49; CAP > 367.12) groups of HD diagnosis probability. The CAP score is similar to disease burden (i.e., genetic toxicity) and is an index of cumulative toxicity of the HD genetic mutation at a given age [Zhang et al., 2011]. Table 1 lists a summary of participant characteristics, and their site information is listed in Supporting Information Table SI.
Table 1.
Summary of demographic and clinical data for healthy controls and prodromal Huntington disease participants, including number of participants in each control and CAG‐age product group
| Demographic | Mean (SD) | |||
|---|---|---|---|---|
| Number of subjects | Control | Low | Medium | High |
| Age (years) | 46.4 (11.4) | 34.4 (8.6) | 40.8 (9.9) | 45.3 (12.0) |
| Educ (years) | 15.4 (2.2) | 14.7 (2.5) | 15.0 (2.3) | 14.9 (2.9) |
| Motor | 3.8 (3.6) | 2.5 (3.5) | 6.1 (4.7) | 7.7 (7.1) |
| SDMT | 54.8 (10.4) | 60.0 (10.3) | 52.0 (9.6) | 48.1 (10.1) |
| S Color | 84.7 (12.4) | 87.1 (13.6) | 78.8 (11.6) | 74.9 (14.3) |
| S Word | 104.6 (15.1) | 106.9 (17.6) | 99.4 (16.6) | 98.1 (19.9) |
| S Interference | 49.6 (9.5) | 52.5 (11.7) | 48.0 (10.4) | 44.9 (11.9) |
| TMTA | 21.5 (6.3) | 20.6 (6.0) | 23.2 (7.7) | 25.1 (7.5) |
| TMTB | 51.4 (22.7) | 49.9 (16.9) | 56.3 (24.8) | 60.9 (23.6) |
| Gender | 22M/43F | 9M/34F | 16M/38F | 13M/36F |
| Total N | 65 | 43 | 54 | 49 |
Abbreviations: Educ, education; Motor, sum of all items of the unified Huntington's disease rating scale motor assessment scale; SDMT, symbol digit modalities test; S Color, Stroop Color and Word Test—color condition; S Word, Stroop Color and Word Test—word condition; S Interference, Strop Color and Word Test—interference condition; TMTA, trail making test, part A; TMTB, trail making test, part B.
Measures
Participants were evaluated by experienced clinicians certified in the administration of the Unified Huntington's Disease Rating Scale (UHDRS) [Huntington Study Group, 1996]. Formal diagnosis of HD was based on a diagnostic confidence level (DCL) rating of 4, indicating the “unequivocal presence of an otherwise unexplained extrapyramidal movement disorder” with >99% confidence according to the certified motor rater [Huntington Study Group, 1996]. We excluded participants with a rating of DCL = 4 at scan time to restrict this analysis to prodromal HD subjects. The total motor impairment score (sum of all the individual motor ratings from the UHDRS) is reported [Huntington Study Group, 1996]. Cognitive performance was assessed with the Symbol Digit Modalities Test (SDMT), the Stroop Color and Word Test, and the TMT. The SDMT score is the number of correct matches between numbers and their designated symbol based on a key and is a reflection of psychomotor speed, cognitive flexibility, and working memory [Smith, 1991]. The Stroop Color and Word Test score is a measure of processing speed and executive function, as it measures the number of correct responses in three conditions: color naming (name colors), word reading (read color names), and interference (inhibition of dominant reading response while naming color) [Stroop, 1935]. The TMT score is a measure of psychomotor speed and executive functions. The TMT score is the number of seconds required to sequentially connect numbers (TMT Part A, TMTA) followed by a task requiring the alternation of sequential numbers and letters (TMT Part B, TMTB) both in ascending order [Reitan, 1958]. A greater time required to complete the TMT results in a higher score and is interpreted as worse performance or poorer function. A summary of participant characteristics and scores on the six cognitive measures is provided in Table 1.
Imaging
Imaging data consisted of multimodal structural (T1‐ and T2‐weighted images) and diffusion‐weighted images collected on 3 Tesla scanners. Due to the multisite nature of our study, this dataset contains representative datasets from Siemens, Philips, and GE‐manufactured scanners. Our earlier work [Magnotta et al., 2012] investigated multicenter reliability of mean DTI scalar measures in lobar WM: intrasubject coefficient of variation (CV) was typically <1% and intersite CV only increased to 1–3%. A diffusion‐weighted scan for a single participant consisted minimally of 30 noncollinear diffusion‐weighted gradients with diffusion‐weighting of b = 1,000 s/mm2 and at least one b = 0 s/mm2 (b 0 image or subvolume without diffusion weighting) acquisition. Imaging parameters for all the sites that contributed scans for our study are shown in Supporting Information Tables SII for DWIs and Supporting Information Tables SIII and SIV for structural images. All scans were transferred to The University of Iowa for processing and analysis.
Image Processing
An image‐processing pipeline was carefully designed and tested for robust processing of both s‐MRI and DWI datasets acquired from the multicenter PREDICT‐HD study.
s‐MRI preprocessing
All visual inspections and preprocessing of images were completed at the University of Iowa Scalable Informatics, Neuroscience, Analysis, Processing, and Software Engineering (SINAPSE) Laboratory while blinded to participant group status. All T1‐ and T2‐weighted images were first visually inspected and given a quality rating ranging from 0 (unusable) to 10 (best quality). Structural images that received a quality rating lower than six were excluded from further processing and analysis, which resulted in excluding approximately 7% of available structural images. All images collected in the same scan session (i.e., 1–3 repeats of T1‐ and T2‐weighted images within a single scan session) were processed simultaneously using methods previously described [BRAINSia, 2013; Pierson et al., 2011]. The best‐rated T1‐weighted image within a scan session was used to estimate a consistent AC‐PC anatomical orientation with a constellation‐based landmark detection algorithm (BRAINS Constellation Detector) that uses the anterior and posterior commissures and the mid‐sagittal plane as prominent features [Ghayoor et al., 2013]. The remaining T1‐ and T2‐weighted images that passed visual inspection were rigidly aligned to the spatially normalized T1‐weighted image [Young Kim and Johnson, 2013]. Each of the multimodal images were bias‐field corrected using an atlas‐based classification algorithm (BRAINSABC), resulting in 17 tissue probability maps and average images of each modality resampled to a 1 mm × 1 mm × 1 mm voxel lattice. Brain tissue probability maps were converted to a brain mask and used to skull‐strip the participant's corresponding average bias‐field corrected T1‐ and T2‐weighted images.
DWI preprocessing
DTIPrep [Liu et al., 2010; Oguz et al., 2014] performed several quality assurance steps and removed gradient subvolumes within the DWI scan that did not meet its minimal quality criteria. If a participant received multiple DWI scans in a single session, the repetitions were concatenated end‐to‐end and processed by DTIPrep. DTIPrep first detected intensity artifacts (which were often susceptibility artifacts) by comparing normalized correlation values of corresponding neighboring slices across all volumes within a DWI scan. A subvolume containing an intensity artifact was removed if it possessed a normalized correlation value outside the designated number of standard derivations from the average normalized correlation value. Interlace artifacts were detected in a similar manner where normalized correlation coefficients were computed between interleaving slices for each subvolume. If a DWI scan contained multiple b 0 images due to concatenation of multiple scans within a session or collection of multiple b 0 images per scan, DTIPrep also averaged multiple b 0 images within a scan to create a single reference average b 0 image per DWI scan. All DWI subvolumes were coregistered to the averaged b 0 image via affine transform for eddy‐current and head motion artifact correction, as eddy current‐induced distortions can lead to misregistration between different DWI scans and eventually to error in the tensor image in all voxels. The final step in DTIPrep removed subvolumes with remaining residual motion or translation relative to the averaged b 0 image and updated the diffusion weighting directions based on the rotational component of the affine transform. DTIPrep excluded an entire scan if the number of diffusion‐weighted subvolumes fell below 30. The final output of DTIPrep contained an averaged b 0 image and only those DWI subvolumes that passed the above quality assurance tests. Of the available DWI scans, DTIPrep excluded approximately 13% from further analysis. The output of DTIPrep was again visually inspected to ensure that the DWI scan was indeed free of interlace artifact, dropout, major susceptibility artifacts, and incomplete brain coverage. We have previously reported the multicenter reliability of using DTIPrep, and used DTIPrep in a DTI scalar study [Matsui et al., 2014].
DTI derivation from DWI
DTIs were estimated using a weighted least squares method [Kingsley, 2006] in the original DWI space in the area limited to the brain mask. For each subject, a nonlinear transform was derived from the average b 0 image in the DWI scan produced by DTIPrep in the previous section to the corresponding bias field‐corrected T2‐weighted s‐MRI using the symmetric image normalization (SyN) registration method [Avants et al., 2008]. The inverse of this nonlinear transform was used to resample a binary brain mask in s‐MRI space to DWI space to provide optimal brain masking during the tensor estimation step. A DTI was then estimated using the preprocessed DWI and the deformed brain mask. The transformation from the averaged b 0 image of a participant's DWI to the corresponding bias field corrected T2‐weighted image was then used to resample the resulting DTI to s‐MRI space. In the resampling process, preservation of principal direction mode with linear interpolation was used to resample the DTIs in the Log‐Euclidean domain [Alexander et al., 2001; Arsigny et al., 2006; Budin et al., 2010; Kaiser, 2013] into the s‐MRI anatomical space.
Unbiased cross‐sectional DTI template building
An unbiased template space was created with the unbiased template building algorithm originally proposed by Avants and coauthors [Avants and Gee, 2004; Avants et al., 2010], and was used to create four major PFC WM tracts: PFCC, left and right ATR, left and right IFO, and left and right UNC. FA, MD, AD, and RD were then projected to each derived tract skeleton for the analysis in relation to groups and cognitive variables. High anatomical resolution T1‐weighted images from all healthy controls and prodromal HD participants were equally weighted in the creation of the unbiased T1‐weighted template. Each participant's DTI was resampled into the unbiased T1‐weighted template space using the ResampleDTILogEuclidean tool [Budin et al., 2010]. Each participant's DTI was previously aligned to the participant's T1‐weighted image space. Thus, the transform defined by the template building process was directly applied to the DTI in order to consistently place them in template space, as suggested by Tustison and coauthors, to minimize circularity bias of our study's experimental design [Tustison et al., 2014].
Resampled DTIs were then averaged with a tool called dtiaverage [Kaiser, 2013] to form the final DTI template that served as the unbiased DTI template for fiber tracking. The unbiased DTI template was visually inspected to ensure valid alignment with its corresponding T1‐weighted template and to ensure orientations of major fiber tracts were consistent with known anatomical organization (i.e., inferior tracts were oriented anterior to posterior, while corticospinal tracts were oriented superior to inferior). Figure 1 shows several axial views of the T1‐weighted template (upper) that was used to construct the corresponding unbiased DTI template (bottom).
Figure 1.
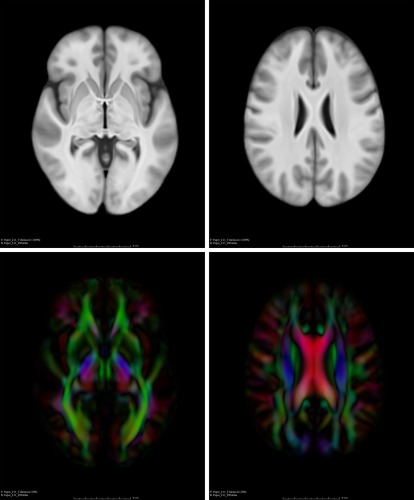
T1‐weighted (top) and DTI (bottom) templates that are encoded with color maps.
Fiber tracking on the unbiased diffusion tensor template
Full brain tractography was performed on the unbiased DTI template using the streamline tractography module and recommended parameter settings available in 3D Slicer [Fedorov et al., 2012] called TractographyLabelMapSeeding [Wassermann, 2013b]. The recommended parameter settings for seed spacing of 0.75 × 0.75 × 0.75 mm3 and linear measure (λ 1 − λ 2/λ 3) greater than or equal to 0.3 were used to initiate tractography. Tract termination criteria included exceeding a length of 800 mm, developing track curvature less than 0.7° per millimeter, or encountering a voxel whose FA was less than 0.1. An integration step length of 0.5 mm3 was used and tracts below 10 mm in length were excluded.
Fiber tract selection
Fiber tracts were selected manually with the TractographyDisplay graphical user interface tool from the Slicer toolkit that allows isolation of individual tracts with an adjustable selection box [Wassermann, 2013a]. Several WM tractography atlases and references were used for anatomical reference while selecting the tracts [Catani and Thiebaut de Schotten, 2008; Oishi et al., 2011; Wakana et al., 2004, 2007], along with visual inspection of the fiber tracts by a tractography expert from a national tractography user group. The following four major WM PFC fiber tracts were selected for analysis: PFCC, ATR, IFO, and UNC. The PFCC included projections from the genu of the corpus callosum into the frontal lobe, while the ATR involved radiations to the PFC associated with the mediodorsal thalamic nuclei [Wakana et al., 2007]. The IFO in our study is based on the definition established by Wakana and coauthors, which includes fronto‐parietal connections passing through the external capsule [Wakana et al., 2007]. The UNC included projections from the anterior temporal lobe to the medial and lateral orbitofrontal cortex [Catani and Thiebaut de Schotten, 2008; Wakana et al., 2007].
DTI scalar measure from fiber tracts
A tract probability map (TPM) (whose values ranged from 0 to 1) was computed for each fiber tract using the method described by Wasserman et al. [2010a, 2010b]. Each TPM was then skeletonized in the space of the DTI atlas using the tract‐based spatial statistics skeletonization tool [Smith et al., 2006] from the Oxford Centre for Functional MRI of the Brain's Software Library (FSL, v5.0.4) [Smith et al., 2004]. The skeleton of each tract was a curved sheet to represent the curved surface along the center of the tract. DTI scalar values (FA, MD, AD, and RD) from each participant were then projected to each tract's skeletonized TPM. For each voxel on the TPM skeleton, the DTI scalar map is searched along the direction perpendicular to the tract within an area restricted by a distance map of the TPM skeleton to find the maximum DTI scalar value. The maximum DTI scalar value is then assigned to the voxel on the TPM skeleton [Smith et al., 2006; Wassermann et al., 2010b].
Figure 2 shows several views of the fiber tracts (UNC, PFCC, IFO, and ATR) derived from whole brain tractography of the DTI templates overlaid on the T1‐weighted template. The tracts are highlighted as left UNC (light blue), right UNC (dark blue), PFCC (yellow), left IFO (light red), right IFO (dark red), left ATR (light green), and right ATR (dark green).
Figure 2.
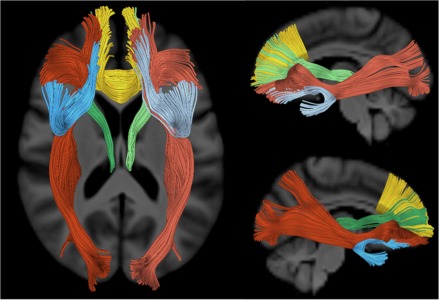
WM tracts extending to the prefrontal cortex that were examined in this study are highlighted with different colors: left uncinate fasciculus (light blue), right uncinate fasciculus (dark blue), anatomical prefrontal WM tracts of the corpus callosum (yellow), left inferior fronto‐occipital fasciculus (light red), right inferior fronto‐occipital fasciculus (dark red), left ATRs (light green), and right ATRs (dark green).
Descriptions of regions containing significantly different DTI scalar values between CAP groups and controls will be referred to using the regions identified in Supporting Information Figures SI, SII, SIII, and SIV for the PFCC, ATR, IFO, and UNC fiber tracts, respectively. The WM tract region names in our study were influenced by the convention FreeSurfer uses to label both cortical gray and WM regions. The medial orbitofrontal gyrus has been given a separate label in the IFO and UNC as it is included in the lateral orbitofrontal region defined by FreeSurfer [Desikan et al., 2006]. All the regions were defined in Table 2. Supporting Information Figures SI–SIV contain more detailed figures.
Table 2.
Four tracks with labeled regions
| PFCC | IFO | ||
|---|---|---|---|
| PFCC1 | Right medial orbitofrontal WM | IFO1 | Medial orbitofrontal gyrus |
| PFCC2 | Posterior to right anterior cingulate WM | IFO2 | Lateral orbitofrontal WM |
| PFCC3 | Lateral to right rostral anterior cingulate WM | IFO3 | Pars orbitalis WM |
| PFCC4 | Inferior to right caudal anterior cingulate | IFO4 | Pars triangularis WM |
| PFCC5 | Lateral to right superior frontal WM, medial to right rostral middle frontal WM | IFO5 | WM lateral to the putamen, medial to the insular gyrus |
| PFCC6 | Right superior frontal WM | IFO6 | WM posterior to the putamen but does not terminate in the occipital or parietal lobe |
| PFCC7 | Left medial orbitofrontal WM | IFO7 | WM that projects to the occipital lobe |
| PFCC8 | Posterior to left anterior cingulate WM | IFO8 | WM that projects to the parietal lobe |
| PFCC9 | Lateral to left rostral anterior cingulate WM | ||
| PFCC10 | Inferior to left caudal anterior cingulate | ||
| PFCC11 | Lateral to left superior frontal WM, medial to left rostral middle frontal WM | ||
| ATRs | UNCs | ||
| ATR1 | Thalamus | UNC1 | Medial orbitofrontal gyrus |
| ATR2 | Lateral to caudate | UNC2 | Posterior portion of lateral orbitofrontal WM |
| ATR3 | Lateral to rostral anterior cingulate WM | UNC3 | Connecting point between temporal and frontal lobe, lateral to insular gyrus |
| ATR4 | Lateral to superior frontal WM, medial to rostral middle frontal WM | UNC4 | Lateral to amygdala, medial to superior temporal gyrus |
| ATR5 | Superior frontal WM | UNC5 | Superior temporal WM |
Abbreviations: PFCC, anatomical prefrontal white matter (WM) tracts of the corpus callosum; ATR, anterior thalamic radiations; IFO, inferior fronto‐occipital fasciculus; UNC, uncinate fasciculus.
Statistical Analysis
Comparison of mean DTI scalars between controls and CAP groups
To compare mean values of FA, MD, AD, and RD along tract skeletons between controls and CAP group, the permutation tests program called randomise [Winkler et al., 2014] from the FSL 5.0.4 package was used to detect differences in mean DTI scalars along tract skeletons. Comparisons were made between controls and CAP groups using analysis of covariance GLM models. For each GLM model, age at scan, years of education, gender, and site of data collection served as covariates in unpaired two‐sample t‐tests using 50,000 permutations. The threshold‐free cluster enhancement (TFCE) method [Smith and Nichols, 2009] in randomise was used to obtain the distribution of data in our study to avoid setting a primary statistic threshold on the tract skeleton of interest before looking for differences in DTI scalar values between controls and CAP groups. The main advantage of using the TFCE approach is that it is designed to find both focal and diffuse areas containing significant differences in signal. The TFCE approach computes a TFCE score for each voxel that is determined by the voxel itself and immediately adjacent voxels that are contributing signal. Using a score for each voxel for statistical inference instead of the raw signal enhances areas of signal that may be part of a cluster without a primary statistic image threshold (such as that in cluster‐based thresholding), making it easier to discriminate between background noise and signal. Corrections for multiple comparisons within tract skeleton and across contrasts were done on the P‐value maps with false discovery rate (FDR) from FSL 5.0.4 at a criterion of q < 0.05.
Correlations between DTI scalars and cognitive performance in prodromal HD participants
Randomise was used to determine how DTI scalars (FA, MD, AD, and RD) correlated with performance on the following cognitive variables: SDMT, Stroop Word, Stroop Color, Stroop Interference, TMTA, and TMTB using the TFCE method. Only prodromal HD participants were included in the correlation analysis with age, years of education, gender, and site of data collection as covariates. Again, corrections for multiple comparisons within tract skeleton and across contrasts were done on the P‐value maps with FDR from FSL 5.0.4 at a criterion of q < 0.05.
RESULTS
Mean DTI Scalar Differences Between Controls and CAP Groups
In this section, we review the results when comparing controls to the three HD CAP groups for each of the mean DTI scalars (FA, MD, AD, and RD) within each of the seven PFC tracts (PFCC, IFO[L/R], ATR[L/R], and UNC[L/R]). Results in Figure 3 provide a summary of the permutation results indicating the percentage of each tract skeleton that differed on each of the four scalar measures between groups. For each of the areas that showed significant differences, we additionally plotted the mean DTI scalar values for each participant in Figure 4 (High vs. Controls) and Figure 5 (Medium vs. Controls). There were no significant differences in any of the tracts for any of the four DTI measures between the Low CAP group and control subjects.
Figure 3.
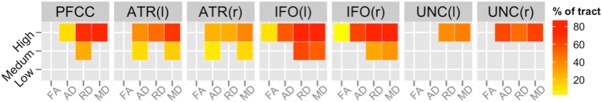
Percentages of voxels in each tract skeleton containing significant differences in DTI scalars between controls and CAP groups. These results were acquired with the threshold‐free cluster enhancement method at 50,000 permutations and corrected with FDR at a criterion of q < 0.05 for left (l) and right (r). More details are shown in Figures 4 and 5. Abbreviations: PFCC, anatomical prefrontal WM tracts of the corpus callosum; ATR(l), anterior thalamic radiations left; ATR(r), anterior thalamic radiations right; IFO(l), inferior fronto‐occipital fasciculus left; IFO(r), inferior fronto‐occipital fasciculus right; UNC(l), uncinate fasciculus left; UNC(r), uncinate fasciculus right; FA, fractional anisotropy; AD, axial diffusivity; RD, radial diffusivity; MD, mean diffusivity.
Figure 4.
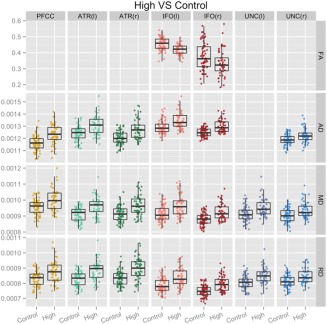
Detailed differences in DTI scalars between control and High CAP groups. Plots of mean DTI scalars across tract skeleton voxels that contained significant differences between Control and High CAP groups for each participant. These results were acquired with the threshold‐free cluster enhancement method at 50,000 permutations and corrected with FDR at a criterion of q < 0.05 for left (l) and right (r). Abbreviations: PFCC, anatomical prefrontal WM tracts of the corpus callosum; ATR(l), anterior thalamic radiations left; ATR(r), anterior thalamic radiations right; IFO(l), inferior fronto‐occipital fasciculus left; IFO(r), inferior fronto‐occipital fasciculus right; UNC(l), uncinate fasciculus left; UNC(r), uncinate fasciculus right; FA, fractional anisotropy; AD, axial diffusivity; RD, radial diffusivity; MD, mean diffusivity.
Figure 5.
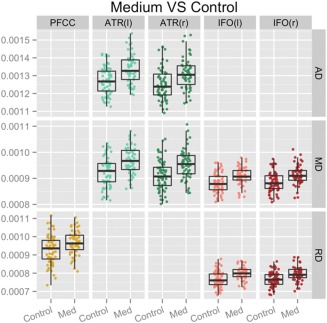
Detailed differences in DTI scalars between control and Medium CAP groups. Plots of mean DTI scalars across tract skeleton voxels that contained significant differences between control and Medium CAP groups for each participant. These results were acquired with the threshold‐free cluster enhancement method at 50,000 permutations and corrected with FDR at a criterion of q < 0.05 for left (l) and right (r). Abbreviations: PFCC, anatomical prefrontal WM tracts of the corpus callosum; ATR(l), anterior thalamic radiations left; ATR(r), anterior thalamic radiations right; IFO(l), inferior fronto‐occipital fasciculus left; IFO(r), inferior fronto‐occipital fasciculus right; AD, axial diffusivity; MD, mean diffusivity; RD, radial diffusivity; Med, medium.
Of the four tracts examined in our study, the IFO had the largest percentage of tract skeleton area where measurable differences between the controls and Medium or High CAP groups were present for diffusivity measures. The ATR demonstrated increased MD, RD, and AD for the Medium and High CAP groups compared to the Control group for regions immediately adjacent to the caudate. The PFCC showed increased MD, RD, and AD for the High CAP group compared to the Control group throughout the tract. Increased RD was seen for the Medium CAP group in comparison to the Control group in regions immediately anterior to the caudate. The UNC differences were generally weaker, with detectable differences only between the controls and the High CAP group.
Out of the three CAP groups, the High CAP group presented the most widespread findings across PFC tracts with regard to all four DTI scalar measures. The IFO tract showed the most widespread diffusivity difference between High and Control groups and also presented evidence of FA changes that were not observed elsewhere. It is important to note that significant differences in MD and RD were noticeable in all seven PFC tracts when comparing the High CAP and Control groups.
As anticipated, the Medium CAP group presented changes in areas similar to the High CAP group but were not as widespread, reflecting the Medium CAP group's less severe genetic toxicity. ATR and IFO showed symmetrical diffusivity differences for FA and MD and RD and MD, respectively, between Control and Medium CAP groups. Mean RD change was observed in the PFCC tract while there were no findings for the UNC tract. Mean DTI scalar differences also generally presented with left‐right symmetry, as illustrated in Figure 3.
Association Between Neuropsychological Performance and DTI Scalar Values
Similar to the results provided in Figure 3, correlational analyses between neuropsychological performance and diffusion‐tensor metrics are summarized in Figure 6. After permutation‐based correction, we identified the percentage of each tract skeleton that correlated with each of the neuropsychological variables. Across all regions, lower FA and higher MD, RD, and AD were linked to greater impairment in neuropsychological performance. Among the four scalar measures, correlational findings relating to neuropsychological performance were most widespread for MD and RD. For the PFCC, DTI scalar measures were broadly related to neuropsychological performance on all but the Stroop Interference task. Significant relationships between FA, MD, and RD but not AD with neuropsychological measures were present in the PFCC. In the ATR, MD and RD were significantly correlated with performance on the SDMT, Stroop Color, Stroop Word, and TMTB tasks. The IFO, MD, and RD measures were significantly correlated with performance on the SDMT and TMTA/B tasks and fewer correlations with performance on the Stroop tasks. Of the four tracts examined, the UNC showed the lowest correlation with neuropsychological performance, with significant associations bilaterally for TMTB with RD and TMTA with FA. Please see Supporting Information Tables SVII, SVIII and Supporting Information Figure SVII for a more detailed characterization of these correlational findings.
Figure 6.
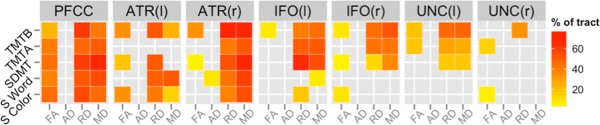
Percentages of voxels in each tract skeleton containing significant correlations between DTI scalars and cognitive variables that showed decreased anisotropy was related to cognitive decline for prodromal HD participants. These results were acquired with the threshold‐free cluster enhancement method with 50,000 permutations and corrected with FDR at a criterion of q < 0.05. Abbreviations: TMTA, Trail Making Test A; TMTB, Trail Making Test B; SDMT, Symbol Digit Modalities Test; S Word, Stroop Color and Word Test—word condition; S Color, Stroop Color and Word Test—color condition; PFCC, anatomical prefrontal WM tracts of the corpus callosum; ATR(l), anterior thalamic radiations left; ATR(r), anterior thalamic radiations right; IFO(l), inferior fronto‐occipital fasciculus left; IFO(r), inferior fronto‐occipital fasciculus right; UNC(l), uncinate fasciculus left; UNC(r), uncinate fasciculus right; FA, fractional anisotropy; AD, axial diffusivity; RD, radial diffusivity; MD, mean diffusivity.
DISCUSSION
Prior work has documented the effectiveness of DWI in studying WM changes throughout HD progression. The purpose of this study is to describe and examine the diffusivity properties of four major PFC WM tracts in prodromal HD participants and how WM alterations relate to genetic toxicity and neuropsychological test scores. Our results are in general agreement with previous prodromal HD DTI scalar studies that showed decreased FA and increased MD, AD, and RD associated with increased CAP scores. We also identified significant increases in MD and RD profiles between the Medium CAP group and healthy controls in the IFO tracts.
Decreased FA and increased MD, AD, and RD together suggest decreased anisotropy that is generally thought to reflect compromise in the WM cell membranes. This finding is consistent with at least one animal study showing greater anisotropic diffusion in areas containing multiple axons versus those areas with fewer axons, demonstrating that WM sheaths and greater numbers of axons are important sources of anisotropic diffusion [Takahashi et al., 2002]. Other animal studies have shown decreased myelin integrity is specific to an increase in RD, and is a separate process from axonal injury [Song et al., 2002, 2003, 2005]. In animal studies, AD was decreased due to axonal injury in the same studies showing increased [Song et al., 2003] or unchanged RD [Song et al., 2002, 2005]. Another animal study showed that both AD and RD were decreased and the authors attributed this change to Wallerian degeneration [Sun et al., 2008].
Increased AD has been seen in the WM of HD subjects in the corpus callosum [Rosas et al., 2010]. Comparatively, AD also decreases with time in HD subjects [Weaver et al., 2009]. Collectively, the changes in diffusivity throughout multiple tracts in our study support previous findings of global WM volume abnormalities in prodromal HD subjects [Paulsen et al., 2006, 2010; Phillips et al., 2014].
Increased MD and RD and, to a lesser degree, decreased FA, negatively correlated with cognitive performance for many of the tracts in our study. TMTA and TMTB performance time was highly correlated with FA, MD, and RD in almost all tracts. SDMT also had many significant correlations in the PFCC, IFO, and ATR. Stroop Word Test scores were limited to significant correlations in the PFCC for FA, MD, and RD, and in the ATR tracts for MD and RD. Together, the gradient of effects seen in the differences in DTI scalar values and their correlations with cognitive variables that have a documented association with cognitive changes in prodromal HD participants suggest DWI scalar tensor values can be reliable markers of disease progression. For example, the results of our study suggest that monitoring MD and RD in the IFO while measuring TMT time may serve as a reliable biomarker to monitor disease progression in the prodromal HD stage. In addition, correlations between compromised cognitive performance and diffusivity changes that imply decreased WM functionality are consistent with findings of reduced functional brain connectivity seen in prodromal HD individuals that becomes more widespread in manifest HD [Dumas et al., 2013].
Maturation of the PFCC has been reported to be associated with language development [Paul, 2011], and alterations in the PFCC have been linked to autism [Jou et al., 2011]. The ATR runs through the anterior limb of the internal capsule and connects the PFC to the mediodorsal thalamic nucleus [Wakana et al., 2004] that is believed to be involved with declarative memory [Mamah et al., 2010; Van der Werf et al., 2003]. Robust associations between an infant's visuospatial working memory performance and ATR have also been found [Short et al., 2013]. The IFO connects the orbitofrontal areas to the ventral occipital lobe, while coursing through the external capsule [Catani and Thiebaut de Schotten, 2008; Wakana et al., 2004]. The IFO is believed to only exist in humans [Catani et al., 2007] and may have a role in reading [Epelbaum et al., 2008], attention [Doricchi et al., 2008], and visual processing [Rudrauf et al., 2008]. Alterations in WM properties in the IFO have been linked to autism [Jou et al., 2011]. The UNC connects the orbitofrontal cortex to the anterior lobe [Catani and Thiebaut de Schotten, 2008; Wakana et al., 2004] and may be involved in episodic memory, language, and social emotional processing [Von Der Heide et al., 2013]. Increased mean AD of the UNC was identified in medial temporal lobe epilepsy patients [Kim et al., 2011].
Overall in our study, MD and RD reliably produced the most widespread and significant findings in the mean differences between controls and those with the greatest disease burden and showed the highest association with cognitive performance decline. Of all cognitive measures evaluated, TMT is the most highly correlated with diffusivity changes in almost every tract. These findings with MD, RD, and TMT times are consistent with a previous study that investigated mean scalar values in a limited number of ROI in PFC WM [Matsui et al., 2014]. Widespread positive correlations between decreased cognitive functioning measured by increased TMT times [O'Rourke et al., 2011] and microstructural damage indicators (increased MD and RD and decreased FA) are seen in our study. Increased TMTA times demonstrated in prodromal HD participants may be explained by deficits in attention and visual processing caused by diffusivity changes in the WM of the IFOs that reflect increased genetic toxicity [Doricchi et al., 2008; Rudrauf et al., 2008]. Additionally, increased TMTB times that are indicative of deficits in memory performance were related to diffusivity changes in the WM of the ATRs and UNCs that also tracked with increased genetic toxicity [Mamah et al., 2010; O'Rourke et al., 2011; Van der Werf et al., 2003; Von Der Heide et al., 2013]. Recognizing that the SDMT score is a measure of working memory, one may deduce that decreased SDMT performance is caused in part by the biological changes that resulted in diffusivity changes in the ATRs and left UNC [Smith, 1991; Von Der Heide et al., 2013].
One of the main limitations in this study was the lack of direct susceptibility distortion correction on the s‐MRIs or DWIs. As we were examining WM in the PFC, susceptibility distortion correction may have greatly improved our results, especially in the orbitofrontal and temporal regions as they are in close proximity to large air‐tissue interfaces. Although efforts were made to limit the analysis of distorted images, findings in the UNC may have been more widespread if structural anatomy and WM fiber tracts were more accurate. Another limitation of this study was the use of streamline tractography instead of a more sophisticated fiber tracking algorithm. Many fiber tracking algorithms that derive tracts from more than a single tensor require performing fiber tracking on DWIs instead of tensor images and would require a DWI atlas‐based approach. In this study, we did not employ a DWI atlas‐based approach because that would involve nonlinearly deforming individual DWI subvolumes, which may have introduced unknown error and further distortion of diffusion information. It will be important for future studies to compare and contrast different fiber tracking algorithms in prodromal HD. In addition, although our CAP group analyses point to degeneration of WM tracts as a function of disease burden, it will be important for longitudinal studies to identify changes in WM over time. These studies would benefit from larger sample sizes to more effectively identify associations between WM and cognitive changes.
Future directions include expanding upon these findings in the PFC by examining other tracts of interest related to prodromal HD. In addition to WM in the PFC, it may also be useful to examine WM extending from the PFC to the striatum and beyond to characterize how HD affects corticostriatal loops in their entirety. Ultimately, the above analyses will be expanded to characterize changes in individual subjects longitudinally.
CONCLUSION
Our study examined the diffusivity properties of major WM tracts in the PFC in prodromal HD. The effects seen in the differences in DTI scalar values and their correlations with cognitive performance measures known to track with genetic toxicity in prodromal HD participants suggest DWI can be a reliable marker of disease progression. Specifically, the results of our study suggest that monitoring MD and RD in the PFC while measuring cognitive metrics of HD provide a reliable model to further characterize prodromal HD.
Supporting information
Supporting Information
ACKNOWLEDGMENTS
The authors would like to acknowledge Norman Williams, David Welch, Jessica Forbes, Eric Axelson, Jacquie Marietta, Kathryn Jones, and Daniel Langstraat for their assistance in completing this analysis. The authors thank the PREDICT‐HD sites, the study participants, the National Research Roster for Huntington Disease Patients and Families, the Huntington's Disease Society of America and the Huntington Study Group. The content is solely the responsibility of the authors and does not necessarily represent the official views of the NIH.
PREDICT‐HD Investigators, Coordinators, Motor Raters, Cognitive Raters: Isabella De Soriano, Courtney Shadrick, and Amanda Miller (University of Iowa, Iowa City, Iowa, USA); Edmond Chiu, Joy Preston, Anita Goh, Stephanie Antonopoulos, and Samantha Loi (St. Vincent's Hospital, The University of Melbourne, Kew, Victoria, Australia); Phyllis Chua and Angela Komiti (The University of Melbourne, Royal Melbourne Hospital, Melbourne, Victoria, Australia); Lynn Raymond, Joji Decolongon, Mannie Fan, and Allison Coleman (University of British Columbia, Vancouver, British Columbia, Canada); Christopher A. Ross, Mark Varvaris, Maryjane Ong, and Nadine Yoritomo (Johns Hopkins University, Baltimore, Maryland); William M. Mallonee and Greg Suter (Hereditary Neurological Disease Centre, Wichita, Kansas); Ali Samii, Emily P. Freney, and Alma Macaraeg (University of Washington and VA Puget Sound Health Care System, Seattle, Washington); Randi Jones, Cathy Wood‐Siverio, and Stewart A. Factor (Emory University School of Medicine, Atlanta, Georgia); Roger A. Barker, Sarah Mason, and Natalie Valle Guzman (John van Geest Centre for Brain Repair, Cambridge, UK); Elizabeth McCusker, Jane Griffith, Clement Loy, Jillian McMillan, and David Gunn (Westmead Hospital, Sydney, New South Wales, Australia); Michael Orth, Sigurd Süβmuth, Katrin Barth, Sonja Trautmann, Daniela Schwenk, and Carolin Eschenbach (University of Ulm, Ulm, Germany); Kimberly Quaid, Melissa Wesson, and Joanne Wojcieszek (Indiana University School of Medicine, Indianapolis, Indiana); Mark Guttman, Alanna Sheinberg, Albie Law, and Irita Karmalkar (Centre for Addiction and Mental Health, University of Toronto, Markham, Ontario, Canada); Susan Perlman and Brian Clemente (UCLA Medical Center, Los Angeles, California); Michael D. Geschwind, Sharon Sha, Joseph Winer, and Gabriela Satris (University of California, San Francisco, San Francisco, California); Tom Warner and Maggie Burrows (National Hospital for Neurology and Neurosurgery, London, UK); Anne Rosser, Kathy Price, and Sarah Hunt (Cardiff University, Cardiff, Wales, UK); Frederick Marshall, Amy Chesire, Mary Wodarski, and Charlyne Hickey (University of Rochester, Rochester, New York); Peter Panegyres, Joseph Lee, Maria Tedesco, and Brenton Maxwell (Neurosciences Unit, Graylands, Selby‐Lemnos & Special Care Health Services, Perth, Western Australia, Australia); Joel Perlmutter, Stacey Barton, and Shineeka Smith (Washington University, St. Louis, Missouri); Zosia Miedzybrodzka, Daniela Rae, Vivien Vaughan, and Mariella D'Alessandro (Clinical Genetics Centre, Aberdeen, Scotland, UK); David Craufurd, Judith Bek, and Elizabeth Howard (University of Manchester, Manchester, UK); Pietro Mazzoni, Karen Marder, and Paula Wasserman (Columbia University Medical Center, New York, New York); Rajeev Kumar, Diane Erickson, Christina Reeves, and Breanna Nickels (Colorado Neurological Institute, Englewood, Colorado); Vicki Wheelock, Lisa Kjer, Amanda Martin, and Sarah Farias (University of California, Davis, Sacramento, California); Wayne Martin, Oksana Suchowersky, Pamela King, Marguerite Wieler, and Satwinder Sran (University of Alberta, Edmonton, Alberta, Canada); Anwar Ahmed, Stephen Rao, Christine Reece, Alex Bura, and Lyla Mourany (Cleveland Clinic Foundation, Cleveland, Ohio).
Executive Committee: Principal Investigator Jane S. Paulsen, Jeffrey D. Long, Hans J. Johnson, Thomas Brashers‐Krug, Phil Danzer, Amanda Miller, H. Jeremy Bockholt, and Kelsey Montross.
Scientific Consultants: Deborah Harrington (University of California, San Diego); Holly Westervelt (Rhode Island Hospital/Alpert Medical School of Brown University); Elizabeth Aylward (Seattle Children's Research Institute); Stephen Rao (Cleveland Clinic); David J. Moser, Janet Williams, Nancy Downing, Vincent A. Magnotta, Hans J. Johnson, Thomas Brashers‐Krug, Jatin Vaidya, Daniel O'Leary, and Eun Young Kim (University of Iowa).
Core Sections—Biostatistics: Jeffrey D. Long, Ji‐In Kim, Spencer Lourens (University of Iowa); Ying Zhang and Wenjing Lu (University of Indiana).
Ethics: Cheryl Erwin (Texas Tech University Health Sciences Center); Thomas Brashers‐Krug, Janet Williams (University of Iowa); and Martha Nance (University of Minnesota).
Biomedical Informatics: H. Jeremy Bockholt, Jason Evans, and Roland Zschiegner (University of Iowa).
REFERENCES
- Alexander DC, Pierpaoli C, Basser PJ, Gee JC (2001): Spatial transformations of diffusion tensor magnetic resonance images. IEEE Trans Med Imaging 20:1131–1139. [DOI] [PubMed] [Google Scholar]
- Alexander GE, DeLong MR, Strick PL (1986): Parallel organization of functionally segregated circuits linking basal ganglia and cortex. Annu Rev Neurosci 9:357–381. [DOI] [PubMed] [Google Scholar]
- Arenaza‐Urquijo EM, Bosch B, Sala‐Llonch R, Sole‐Padulles C, Junque C, Fernandez‐Espejo D, Bargallo N, Rami L, Molinuevo JL, Bartres‐Faz D (2011): Specific anatomic associations between white matter integrity and cognitive reserve in normal and cognitively impaired elders. Am J Geriatr Psychiatry 19:33–42. [DOI] [PubMed] [Google Scholar]
- Arsigny V, Fillard P, Pennec X, Ayache N (2006): Log‐Euclidean metrics for fast and simple calculus on diffusion tensors. Magn Reson Med 56:411–421. [DOI] [PubMed] [Google Scholar]
- Avants B, Gee JC (2004): Geodesic estimation for large deformation anatomical shape averaging and interpolation. Neuroimage 23(Suppl 1):S139–S150. 1 [DOI] [PubMed] [Google Scholar]
- Avants BB, Epstein CL, Grossman M, Gee JC (2008): Symmetric diffeomorphic image registration with cross‐correlation: Evaluating automated labeling of elderly and neurodegenerative brain. Med Image Anal 12:26–41. [DOI] [PMC free article] [PubMed] [Google Scholar]
- Avants BB, Yushkevich P, Pluta J, Minkoff D, Korczykowski M, Detre J, Gee JC (2010): The optimal template effect in hippocampus studies of diseased populations. Neuroimage 49:2457–2466. [DOI] [PMC free article] [PubMed] [Google Scholar]
- Aylward EH, Codori AM, Barta PE, Pearlson GD, Harris GJ, Brandt J (1996): Basal ganglia volume and proximity to onset in presymptomatic Huntington disease. Arch Neurol 53:1293–1296. [DOI] [PubMed] [Google Scholar]
- Aylward EH, Li Q, Stine OC, Ranen N, Sherr M, Barta PE, Bylsma FW, Pearlson GD, Ross CA (1997): Longitudinal change in basal ganglia volume in patients with Huntington's disease. Neurology 48:394–399. [DOI] [PubMed] [Google Scholar]
- Aylward EH, Anderson NB, Bylsma FW, Wagster MV, Barta PE, Sherr M, Feeney J, Davis A, Rosenblatt A, Pearlson GD, Ross CA (1998): Frontal lobe volume in patients with Huntington's disease. Neurology 50:252–258. [DOI] [PubMed] [Google Scholar]
- Basser PJ (1995): Inferring microstructural features and the physiological state of tissues from diffusion‐weighted images. NMR Biomed 8:333–344. [DOI] [PubMed] [Google Scholar]
- Basser PJ, Pierpaoli C (1996): Microstructural and physiological features of tissues elucidated by quantitative‐diffusion‐tensor MRI. J Magn Reson B 111:209–219. [DOI] [PubMed] [Google Scholar]
- Beglinger LJ, Nopoulos PC, Jorge RE, Langbehn DR, Mikos AE, Moser DJ, Duff K, Robinson RG, Paulsen JS (2005): White matter volume and cognitive dysfunction in early Huntington's disease. Cogn Behav Neurol 18:102–107. [DOI] [PubMed] [Google Scholar]
- Bohanna I, Georgiou‐Karistianis N, Egan GF (2011): Connectivity‐based segmentation of the striatum in Huntington's disease: Vulnerability of motor pathways. Neurobiol Dis 42:475–481. [DOI] [PubMed] [Google Scholar]
- BRAINSia (2013): BRAINSTools Package. Available at https://github.com/BRAINSia/BRAINSTools. Accessed on November 15, 2013.
- Budin F, Bouix S, Shenton M, Styner M, Oguz I (2010): An ITK implementation of a diffusion tensor images resampling filter. Insight J 1–12. 22499152 [Google Scholar]
- Campodonico JR, Aylward E, Codori AM, Young C, Krafft L, Magdalinski M, Ranen N, Slavney PR, Brandt J (1998): When does Huntington's disease begin? J Int Neuropsychol Soc 4:467–473. [DOI] [PubMed] [Google Scholar]
- Catani M, Allin MP, Husain M, Pugliese L, Mesulam MM, Murray RM, Jones DK (2007): Symmetries in human brain language pathways correlate with verbal recall. Proc Natl Acad Sci USA 104:17163–17168. [DOI] [PMC free article] [PubMed] [Google Scholar]
- Catani M, Thiebaut de Schotten M (2008): A diffusion tensor imaging tractography atlas for virtual in vivo dissections. Cortex 44:1105–1132. [DOI] [PubMed] [Google Scholar]
- Della Nave R, Ginestroni A, Tessa C, Giannelli M, Piacentini S, Filippi M, Mascalchi M (2010): Regional distribution and clinical correlates of white matter structural damage in Huntington disease: A tract‐based spatial statistics study. AJNR Am J Neuroradiol 31:1675–1681. [DOI] [PMC free article] [PubMed] [Google Scholar]
- Delmaire C, Dumas EM, Sharman MA, van den Bogaard SJ, Valabregue R, Jauffret C, Justo D, Reilmann R, Stout JC, Craufurd D, Tabrizi SJ, Roos RA, Durr A, Lehericy S (2013): The structural correlates of functional deficits in early Huntington's disease. Hum Brain Mapp 34:2141–2153. [DOI] [PMC free article] [PubMed] [Google Scholar]
- Desikan RS, Segonne F, Fischl B, Quinn BT, Dickerson BC, Blacker D, Buckner RL, Dale AM, Maguire RP, Hyman BT, Albert MS, Killiany RJ (2006): An automated labeling system for subdividing the human cerebral cortex on MRI scans into gyral based regions of interest. Neuroimage 31:968–980. [DOI] [PubMed] [Google Scholar]
- Doricchi F, Thiebaut de Schotten M, Tomaiuolo F, Bartolomeo P (2008): White matter (dis)connections and gray matter (dys)functions in visual neglect: Gaining insights into the brain networks of spatial awareness. Cortex 44:983–995. [DOI] [PubMed] [Google Scholar]
- Dumas EM, van den Bogaard SJ, Ruber ME, Reilman RR, Stout JC, Craufurd D, Hicks SL, Kennard C, Tabrizi SJ, van Buchem MA, van der Grond J, Roos RA (2012): Early changes in white matter pathways of the sensorimotor cortex in premanifest Huntington's disease. Hum Brain Mapp 33:203–212. [DOI] [PMC free article] [PubMed] [Google Scholar]
- Dumas EM, van den Bogaard SJ, Hart EP, Soeter RP, van Buchem MA, van der Grond J, Rombouts SA, Roos RA, TRACK‐HD Investigator Group (2013): Reduced functional brain connectivity prior to and after disease onset in Huntington's disease. Neuroimage Clin 2:377–384. [DOI] [PMC free article] [PubMed] [Google Scholar]
- Epelbaum S, Pinel P, Gaillard R, Delmaire C, Perrin M, Dupont S, Dehaene S, Cohen L (2008): Pure alexia as a disconnection syndrome: New diffusion imaging evidence for an old concept. Cortex 44:962–974. [DOI] [PubMed] [Google Scholar]
- Esmaeilzadeh M, Ciarmiello A, Squitieri F (2011): Seeking brain biomarkers for preventive therapy in Huntington disease. CNS Neurosci Ther 17:368–386. [DOI] [PMC free article] [PubMed] [Google Scholar]
- Fedorov A, Beichel R, Kalpathy‐Cramer J, Finet J, Fillion‐Robin JC, Pujol S, Bauer C, Jennings D, Fennessy F, Sonka M, Buatti J, Aylward S, Miller JV, Pieper S, Kikinis R (2012): 3D slicer as an image computing platform for the quantitative imaging network. Magn Reson Imaging 30:1323–1341. [DOI] [PMC free article] [PubMed] [Google Scholar]
- Filippi M, Cercignani M, Inglese M, Horsfield MA, Comi G (2001): Diffusion tensor magnetic resonance imaging in multiple sclerosis. Neurology 56:304–311. [DOI] [PubMed] [Google Scholar]
- Ghayoor A, Vaidya JG, Johnson H (2013): Development of a novel constellation based landmark detection algorithm. Proc SPIE Medical Imaging 8669. [Google Scholar]
- Harper PS (1991): Huntington's Disease. Philadelphia, London: W.B. Saunders. [Google Scholar]
- Harris G, Andreasen NC, Cizadlo T, Bailey JM, Bockholt HJ, Magnotta VA, Arndt S (1999): Improving tissue classification in MRI: A three‐dimensional multispectral discriminant analysis method with automated training class selection. J Comput Assist Tomogr 23:144–154. [DOI] [PubMed] [Google Scholar]
- Hayden MR (1981): Huntington's Chorea. Berlin, New York: Springer‐Verlag; 192 p. [Google Scholar]
- Huang J, Friedland RP, Auchus AP (2007): Diffusion tensor imaging of normal‐appearing white matter in mild cognitive impairment and early Alzheimer disease: Preliminary evidence of axonal degeneration in the temporal lobe. AJNR Am J Neuroradiol 28:1943–1948. [DOI] [PMC free article] [PubMed] [Google Scholar]
- Huntington Study Group (1996): Unified Huntington's disease rating scale: Reliability and consistency. Mov Disord 11:136–142. [DOI] [PubMed] [Google Scholar]
- Jernigan TL, Salmon DP, Butters N, Hesselink JR (1991): Cerebral structure on MRI, part II: Specific changes in Alzheimer's and Huntington's diseases. Biol Psychiatry 29:68–81. [DOI] [PubMed] [Google Scholar]
- Jones DK, Knosche TR, Turner R (2013): White matter integrity, fiber count, and other fallacies: The do's and don'ts of diffusion MRI. Neuroimage 73:239–254. [DOI] [PubMed] [Google Scholar]
- Jou RJ, Mateljevic N, Kaiser MD, Sugrue DR, Volkmar FR, Pelphrey KA (2011): Structural neural phenotype of autism: Preliminary evidence from a diffusion tensor imaging study using tract‐based spatial statistics. AJNR Am J Neuroradiol 32:1607–1613. [DOI] [PMC free article] [PubMed] [Google Scholar]
- Kaiser A (2013): DTIAtlasBuilder. Available at https://github.com/NIRALUser/DTIAtlas-Builder. Accessed on November 15, 2013.
- Kim CH, Chung CK, Koo BB, Lee JM, Kim JS, Lee SK (2011): Changes in language pathways in patients with temporal lobe epilepsy: Diffusion tensor imaging analysis of the uncinate and arcuate fasciculi. World Neurosurg 75:509–516. [DOI] [PubMed] [Google Scholar]
- Kingsley PB (2006): Introduction to diffusion tensor imaging mathematics: Part II. Anisotropy, diffusion‐weighting factors, and gradient encoding schemes. Concepts Magn Reson Part A Bridg Educ Res 28A:123–154. [Google Scholar]
- Liu Z, Wang Y, Gerig G, Gouttard S, Tao R, Fletcher T, Styner M (2010): Quality control of diffusion weighted images. Proc Soc Photo Opt Instrum Eng 7628. [DOI] [PMC free article] [PubMed] [Google Scholar]
- Magnotta VA, Kim J, Koscik T, Beglinger LJ, Espinso D, Langbehn D, Nopoulos P, Paulsen JS (2009): Diffusion tensor imaging in preclinical Huntington's disease. Brain Imaging Behav 3:77–84. [DOI] [PMC free article] [PubMed] [Google Scholar]
- Magnotta VA, Matsui JT, Liu D, Johnson HJ, Long JD, Bolster BD Jr, Mueller BA, Lim K, Mori S, Helmer KG, Turner JA, Reading S, Lowe MJ, Aylward E, Flashman LA, Bonett G, Paulsen JS (2012): Multicenter reliability of diffusion tensor imaging. Brain Connect 2:345–355. [DOI] [PMC free article] [PubMed] [Google Scholar]
- Mamah D, Conturo TE, Harms MP, Akbudak E, Wang L, McMichael AR, Gado MH, Barch DM, Csernansky JG (2010): Anterior thalamic radiation integrity in schizophrenia: A diffusion‐tensor imaging study. Psychiatry Res 183:144–150. [DOI] [PMC free article] [PubMed] [Google Scholar]
- Matsui JT, Vaidya JG, Johnson HJ, Magnotta VA, Long JD, Mills JA, Lowe MJ, Sakaie KE, Rao SM, Smith MM, Paulsen JS (2014): Diffusion weighted imaging of prefrontal cortex in prodromal Huntington's disease. Hum Brain Mapp 35:1562–1573. [DOI] [PMC free article] [PubMed] [Google Scholar]
- Oguz I, Farzinfar M, Matsui J, Budin F, Liu Z, Gerig G, Johnson HJ, Styner M (2014): DTIPrep: Quality control of diffusion‐weighted images. Front Neuroinform 8:4. [DOI] [PMC free article] [PubMed] [Google Scholar]
- Oishi K, Faria A, van Zijl PCM, Mori S (2011): MRI Atlas of Human White Matter, 2nd ed London: Academic Press, Elsevier; 272 p. [Google Scholar]
- O'Rourke JJ, Beglinger LJ, Smith MM, Mills J, Moser DJ, Rowe KC, Langbehn DR, Duff K, Stout JC, Harrington DL, Carlozzi N, Paulsen JS (2011): The trail making test in prodromal Huntington disease: Contributions of disease progression to test performance. J Clin Exp Neuropsychol 33:567–579. [DOI] [PMC free article] [PubMed] [Google Scholar]
- Paul LK (2011): Developmental malformation of the corpus callosum: A review of typical callosal development and examples of developmental disorders with callosal involvement. J Neurodev Disord 3:3–27. [DOI] [PMC free article] [PubMed] [Google Scholar]
- Paulsen JS, Magnotta VA, Mikos AE, Paulson HL, Penziner E, Andreasen NC, Nopoulos PC (2006): Brain structure in preclinical Huntington's disease. Biol Psychiatry 59:57–63. [DOI] [PubMed] [Google Scholar]
- Paulsen JS, Langbehn DR, Stout JC, Aylward E, Ross CA, Nance M, Guttman M, Johnson S, MacDonald M, Beglinger LJ, Duff K, Kayson E, Biglan K, Shoulson I, Oakes D, Hayden M, PREDICT‐HD Investigators and Coordinators of the Huntington Study Group (2008): Detection of Huntington's disease decades before diagnosis: The Predict‐HD study. J Neurol Neurosurg Psychiatry 79:874–880. [DOI] [PMC free article] [PubMed] [Google Scholar]
- Paulsen JS, Nopoulos PC, Aylward E, Ross CA, Johnson H, Magnotta VA, Juhl A, Pierson RK, Mills J, Langbehn D, Nance M (2010): Striatal and white matter predictors of estimated diagnosis for Huntington disease. Brain Res Bull 82:201–207. [DOI] [PMC free article] [PubMed] [Google Scholar]
- Paulsen JS, Smith MM, Long JD, PREDICT‐HD Investigators and Coordinators of the Huntington Study Group (2013): Cognitive decline in prodromal Huntington disease: Implications for clinical trials. J Neurol Neurosurg Psychiatry 84:1233–1239. [DOI] [PMC free article] [PubMed] [Google Scholar]
- Phillips O, Squitieri F, Sanchez‐Castaneda C, Elifani F, Caltagirone C, Sabatini U, Di Paola M (2014): Deep white matter in Huntington's disease. PLoS One 9:e109676. [DOI] [PMC free article] [PubMed] [Google Scholar]
- Pierson R, Johnson H, Harris G, Keefe H, Paulsen JS, Andreasen NC, Magnotta VA (2011): Fully automated analysis using BRAINS: AutoWorkup. Neuroimage 54:328–336. [DOI] [PMC free article] [PubMed] [Google Scholar]
- Reading SA, Yassa MA, Bakker A, Dziorny AC, Gourley LM, Yallapragada V, Rosenblatt A, Margolis RL, Aylward EH, Brandt J, Mori S, van Zijl P, Bassett SS, Ross CA (2005): Regional white matter change in pre‐symptomatic Huntington's disease: A diffusion tensor imaging study. Psychiatry Res 140:55–62. [DOI] [PubMed] [Google Scholar]
- Reitan R (1958): Validity of the trail making test as an indicator of organic brain damage. Percept Mot Skills 8:271–276. [Google Scholar]
- Rizk‐Jackson A, Stoffers D, Sheldon S, Kuperman J, Dale A, Goldstein J, Corey‐Bloom J, Poldrack RA, Aron AR (2011): Evaluating imaging biomarkers for neurodegeneration in pre‐symptomatic Huntington's disease using machine learning techniques. Neuroimage 56:788–796. [DOI] [PubMed] [Google Scholar]
- Roberts AC, Robbins TW, Weiskrantz L (1998): The Prefrontal Cortex: Executive and Cognitive Functions. Oxford, New York: Oxford University Press; 248 p. [Google Scholar]
- Rosas HD, Tuch DS, Hevelone ND, Zaleta AK, Vangel M, Hersch SM, Salat DH (2006): Diffusion tensor imaging in presymptomatic and early Huntington's disease: Selective white matter pathology and its relationship to clinical measures. Mov Disord 21:1317–1325. [DOI] [PubMed] [Google Scholar]
- Rosas HD, Lee SY, Bender AC, Zaleta AK, Vangel M, Yu P, Fischl B, Pappu V, Onorato C, Cha JH, Salat DH, Hersch SM (2010): Altered white matter microstructure in the corpus callosum in Huntington's disease: Implications for cortical “disconnection.” Neuroimage 49:2995–3004. [DOI] [PMC free article] [PubMed] [Google Scholar]
- Rudrauf D, Mehta S, Grabowski TJ (2008): Disconnection's renaissance takes shape: Formal incorporation in group‐level lesion studies. Cortex 44:1084–1096. [DOI] [PubMed] [Google Scholar]
- Short SJ, Elison JT, Goldman BD, Styner M, Gu HB, Connelly M, Maltbie E, Woolson S, Lin WL, Gerig G, Reznick JS, Gilmore JH (2013): Associations between white matter microstructure and infants’ working memory. Neuroimage 64:156–166. [DOI] [PMC free article] [PubMed] [Google Scholar]
- Smith A (1991): Symbol Digit Modalities Test: Manual (Revised). Los Angeles, CA: Western Psychological Services. [Google Scholar]
- Smith SM, Nichols TE (2009): Threshold‐free cluster enhancement: Addressing problems of smoothing, threshold dependence and localisation in cluster inference. Neuroimage 44:83–98. [DOI] [PubMed] [Google Scholar]
- Smith SM, Jenkinson M, Woolrich MW, Beckmann CF, Behrens TE, Johansen‐Berg H, Bannister PR, De Luca M, Drobnjak I, Flitney DE, Niazy RK, Saunders J, Vickers J, Zhang Y, De Stefano N, Brady JM, Matthews PM (2004): Advances in functional and structural MR image analysis and implementation as FSL. Neuroimage 23(Suppl 1):S208–S219. 2 [DOI] [PubMed] [Google Scholar]
- Smith SM, Jenkinson M, Johansen‐Berg H, Rueckert D, Nichols TE, Mackay CE, Watkins KE, Ciccarelli O, Cader MZ, Matthews PM, Behrens TE (2006): Tract‐based spatial statistics: voxelwise analysis of multi‐subject diffusion data. Neuroimage 31:1487–1505. [DOI] [PubMed] [Google Scholar]
- Song SK, Sun SW, Ramsbottom MJ, Chang C, Russell J, Cross AH (2002): Dysmyelination revealed through MRI as increased radial (but unchanged axial) diffusion of water. Neuroimage 17:1429–1436. [DOI] [PubMed] [Google Scholar]
- Song SK, Sun SW, Ju WK, Lin SJ, Cross AH, Neufeld AH (2003): Diffusion tensor imaging detects and differentiates axon and myelin degeneration in mouse optic nerve after retinal ischemia. Neuroimage 20:1714–1722. [DOI] [PubMed] [Google Scholar]
- Song SK, Yoshino J, Le TQ, Lin SJ, Sun SW, Cross AH, Armstrong RC (2005): Demyelination increases radial diffusivity in corpus callosum of mouse brain. Neuroimage 26:132–140. [DOI] [PubMed] [Google Scholar]
- Stoffers D, Sheldon S, Kuperman JM, Goldstein J, Corey‐Bloom J, Aron AR (2010): Contrasting gray and white matter changes in preclinical Huntington disease: An MRI study. Neurology 74:1208–1216. [DOI] [PMC free article] [PubMed] [Google Scholar]
- Stroop JR (1935): Studies of interference in serial verbal reactions. J Exp Psychol 18:643–662. [Google Scholar]
- Sun SW, Liang HF, Cross AH, Song SK (2008): Evolving Wallerian degeneration after transient retinal ischemia in mice characterized by diffusion tensor imaging. Neuroimage 40:1–10. [DOI] [PMC free article] [PubMed] [Google Scholar]
- Tabrizi SJ, Scahill RI, Durr A, Roos RA, Leavitt BR, Jones R, Landwehrmeyer GB, Fox NC, Johnson H, Hicks SL, Kennard C, Craufurd D, Frost C, Langbehn DR, Reilmann R, Stout JC, TRACK‐HD Investigators (2011): Biological and clinical changes in premanifest and early stage Huntington's disease in the TRACK‐HD study: The 12‐month longitudinal analysis. Lancet Neurol 10:31–42. [DOI] [PubMed] [Google Scholar]
- Tabrizi SJ, Reilmann R, Roos RA, Durr A, Leavitt B, Owen G, Jones R, Johnson H, Craufurd D, Hicks SL, Kennard C, Landwehrmeyer B, Stout JC, Borowsky B, Scahill RI, Frost C, Langbehn DR, TRACK‐HD Investigators (2012): Potential endpoints for clinical trials in premanifest and early Huntington's disease in the TRACK‐HD study: Analysis of 24 month observational data. Lancet Neurol 11:42–53. [DOI] [PubMed] [Google Scholar]
- Takahashi M, Hackney DB, Zhang G, Wehrli SL, Wright AC, O'Brien WT, Uematsu H, Wehrli FW, Selzer ME (2002): Magnetic resonance microimaging of intraaxonal water diffusion in live excised lamprey spinal cord. Proc Natl Acad Sci USA 99:16192–16196. [DOI] [PMC free article] [PubMed] [Google Scholar]
- Tustison NJ, Avants BB, Cook PA, Kim J, Whyte J, Gee JC, Stone JR (2014): Logical circularity in voxel‐based analysis: Normalization strategy may induce statistical bias. Hum Brain Mapp 35:745–759. [DOI] [PMC free article] [PubMed] [Google Scholar]
- Van der Werf YD, Jolles J, Witter MP, Uylings HB (2003): Contributions of thalamic nuclei to declarative memory functioning. Cortex 39:1047–1062. [DOI] [PubMed] [Google Scholar]
- Von Der Heide RJ, Skipper LM, Klobusicky E, Olson IR (2013): Dissecting the uncinate fasciculus: Disorders, controversies and a hypothesis. Brain 136:1692–1707. [DOI] [PMC free article] [PubMed] [Google Scholar]
- Wakana S, Jiang H, Nagae‐Poetscher LM, van Zijl PC, Mori S (2004): Fiber tract‐based atlas of human white matter anatomy. Radiology 230:77–87. [DOI] [PubMed] [Google Scholar]
- Wakana S, Caprihan A, Panzenboeck MM, Fallon JH, Perry M, Gollub RL, Hua K, Zhang J, Jiang H, Dubey P, Blitz A, van Zijl P, Mori S (2007): Reproducibility of quantitative tractography methods applied to cerebral white matter. Neuroimage 36:630–644. [DOI] [PMC free article] [PubMed] [Google Scholar]
- Wassermann D (2013a): TractographyDisplay. Available at http://www.slicer.org/slicerWiki/index.php/Documentation/4.2/Modules/TractographyDisplay. Accessed on November 15, 2013.
- Wassermann D (2013b): TractographyLabelMapSeeding. Available at http://www.slicer.org/slicerWiki/index.php/Documentation/4.0/Modules/TractographyLabelMap-Seeding. Accessed on November 15, 2013.
- Wassermann D, Bloy L, Kanterakis E, Verma R, Deriche R (2010a): Unsupervised white matter fiber clustering and tract probability map generation: Applications of a Gaussian process framework for white matter fibers. Neuroimage 51:228–241. [DOI] [PMC free article] [PubMed] [Google Scholar]
- Wassermann D, Kanterakis E, Gur RC, Deriche R, Verma R (2010b): Diffusion‐based population statistics using tract probability maps. Med Image Comput Comput Assist Interv 13:631–639. [DOI] [PubMed] [Google Scholar]
- Weaver KE, Richards TL, Liang O, Laurino MY, Samii A, Aylward EH (2009): Longitudinal diffusion tensor imaging in Huntington's disease. Exp Neurol 216:525–529. [DOI] [PMC free article] [PubMed] [Google Scholar]
- Winkler AM, Ridgway GR, Webster MA, Smith SM, Nichols TE (2014): Permutation inference for the general linear model. Neuroimage 92:381–397. [DOI] [PMC free article] [PubMed] [Google Scholar]
- Young Kim E, Johnson HJ (2013): Robust multi‐site MR data processing: Iterative optimization of bias correction, tissue classification, and registration. Front Neuroinform 7:29. [DOI] [PMC free article] [PubMed] [Google Scholar]
- Zhang Y, Long JD, Mills JA, Warner JH, Lu W, Paulsen JS, PREDICT‐HD Investigators and Coordinators of the Huntington Study Group (2011): Indexing disease progression at study entry with individuals at‐risk for Huntington disease. Am J Med Genet B Neuropsychiatr Genet B 156:751–763. [DOI] [PMC free article] [PubMed] [Google Scholar]
Associated Data
This section collects any data citations, data availability statements, or supplementary materials included in this article.
Supplementary Materials
Supporting Information